| English | 释义 | 拼音 |
|---|---|---|
| statistic/stəˈtɪstɪk/ | 统计量 | tǒng jì liàng |
| sampling variability/ˈsæmplɪŋ ˌveərɪəˈbɪlɪti/ | 抽样变异性 | chōu yàng biàn yì xìng |
| parameter/pəˈræmɪtə/ | 参数 | cān shù |
| sampling distribution/ˈsæmplɪŋ ˌdɪstrɪˈbjuːʃn/ | 抽样分布 | chōu yàng fēn bù |
| uncertainty/ʌnˈsɜːtənti/ | 不确定性 | bù què dìng xìng |
Why your sample differs from mine
- Take two random samples from the same population — their results can differ.
- A statistic 统计量 (like $\bar{x}$ or $\hat{p}$) varies from sample to sample.
- This built-in wobble is sampling variability 抽样变异性.
- It's not a mistake — it's the unavoidable nature of sampling.
Parameter vs. statistic
- A parameter 参数 is a fixed number describing the whole population (e.g. true mean $\mu$).
- A statistic is a number computed from a sample (e.g. sample mean $\bar{x}$).
- The parameter is unknown and constant; the statistic is known but varies.
- We use the varying statistic to estimate the fixed parameter.
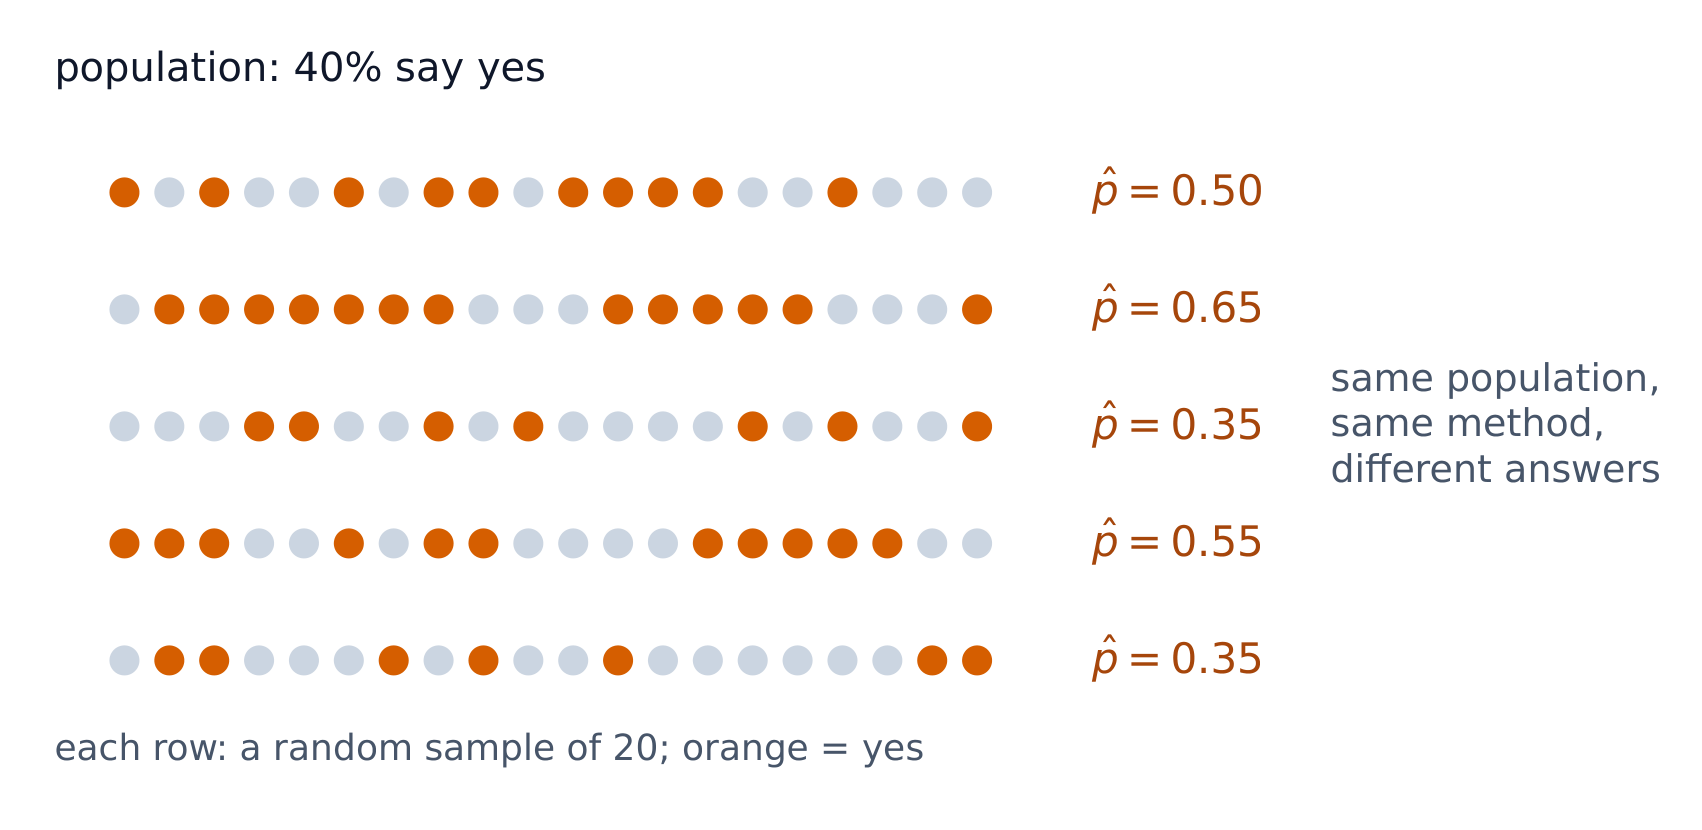
Five random samples from one population give five different sample proportions
The sampling distribution
- Imagine repeated samples of the same size under the same sampling design, recording the statistic each time.
- The probability distribution of those statistic values is the sampling distribution 抽样分布; each possible sample is weighted by its selection probability.
- It shows how the statistic behaves: its center, spread, and shape.
- This is the key idea that makes inference possible.
Variability means uncertainty
- Because the statistic varies, a single sample gives an estimate with uncertainty 不确定性.
- We can't be sure our one $\bar{x}$ equals the true $\mu$.
- But the sampling distribution tells us how far off we're likely to be.
- Quantifying that uncertainty is the whole point of Units 5–9.
Keep parameter and statistic straight — they use different symbols on purpose. A parameter ($\mu$, $p$, $\sigma$) is a fixed population truth we usually don't know; a statistic ($\bar{x}$, $\hat{p}$, $s$) comes from a sample and can vary between samples; two samples can give the same value. The sampling distribution describes the statistic, not any one sample.
A population has true mean $\mu=50$. Take simple random samples of a fixed size, so the sample mean is unbiased.
- Sample 1 gives $\bar{x} = 48$; Sample 2 gives $\bar{x} = 53$ — sampling variability.
- Neither equals $\mu$ exactly, and that's expected.
- The sampling distribution of $\bar{x}$ is centered at $50$ and shows the typical spread of these estimates.
A statistic varies from sample to sample (sampling variability), while a parameter is a fixed population value. The sampling distribution is the distribution of a statistic over all possible samples — it captures the uncertainty in using one sample to estimate a parameter.
Write from this case
- Many random samples are drawn from one population.
- Each sample has its own sample mean.
Many random samples of the same size are drawn from one fixed population, and their sample means differ. Why can the sample means differ while the population mean stays fixed?
New samples give new statistics.
What varies from sample to sample?
难度 1/5 · 今日首次完成可获 100 金币及少量额外奖励
The statistic changes. The parameter does not.
A sampling distribution
The statistic varies from sample to sample around the true parameter.
Which is a parameter (not a statistic)?
难度 1/5 · 今日首次完成可获 100 金币及少量额外奖励
μ is a fixed population value — a parameter. The others come from samples.
Two random samples from the same population will usually give slightly different statistics.
难度 1/5 · 今日首次完成可获 100 金币及少量额外奖励
That's sampling variability — expected, not an error.
The distribution of a statistic over all possible samples is the ___ distribution (one word).
难度 1/5 · 今日首次完成可获 100 金币及少量额外奖励
The sampling distribution describes how the statistic behaves.
A parameter is best described as...
难度 1/5 · 今日首次完成可获 100 金币及少量额外奖励
Parameters (μ, p, σ) are fixed population truths.
Because a statistic varies, a single sample gives an estimate with some uncertainty.
难度 1/5 · 今日首次完成可获 100 金币及少量额外奖励
The sampling distribution quantifies that uncertainty.