การแสดงผลข้อมูล
แนะนำใหม่| English | ความหมาย |
|---|---|
| stem-and-leaf/stem ænd liːf/ | แผนภูมิใบและก้าน |
| box-and-whisker/bɒks ænd ˈwɪskə/ | แผนภูมิกล่องและหนวด |
| quartile/ˈkwɔːtaɪl/ | ควอไทล์ |
| histogram/ˈhɪstəɡræm/ | ฮิสโตแกรม |
| cumulative frequency/ˈkjuːmjʊlətɪv ˈfriːkwənsi/ | ความถี่สะสม |
| median/ˈmiːdiːən/ | ค่ามัธยฐาน |
| interquartile range/ˌɪntəˈkwɔːtaɪl reɪndʒ/ | ช่วงควอไทล์ |
| frequency density/ˈfriːkwənsi ˈdensɪti/ | ความหนาแน่นของความถี่ |
| mean/miːn/ | ค่าเฉลี่ย |
| mode/məʊd/ | ค่าที่พบมากที่สุด |
| standard deviation/ˈstændəd ˌdiːvɪˈeɪʃn/ | ส่วนเบี่ยงเบนมาตรฐาน |
| variance/ˈveərɪəns/ | ความแปรปรวน |
| outlier/ˈaʊtlaɪə/ | ค่าผิดปกติ |
The diagram that changed history
- In 1854, John Snow mapped cholera deaths in London and spotted a cluster around one water pump. That diagram saved lives.
- Choosing the right statistical diagram is a skill — it reveals patterns that raw numbers hide.
Statistical diagrams
- Choose a diagram to suit the data:
- Stem-and-leaf 茎叶图 (keeps the values, shows shape),
- Box-and-whisker 箱线图 (lowest, three quartiles 四分位数, highest),
- Histogram 直方图 (grouped data — bar area = frequency),
- Cumulative frequency 累积频数 (running totals → median 中位数 and quartiles).
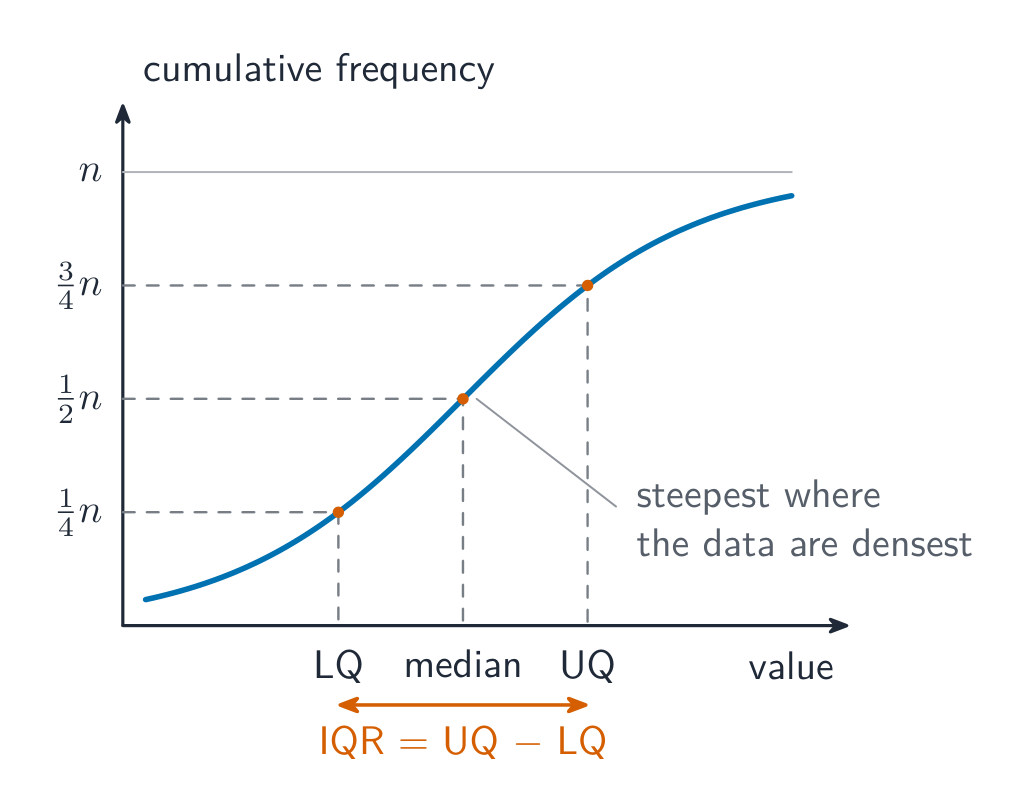
A cumulative frequency curve: read the median across from half the total, and the quartiles from a quarter and three-quarters
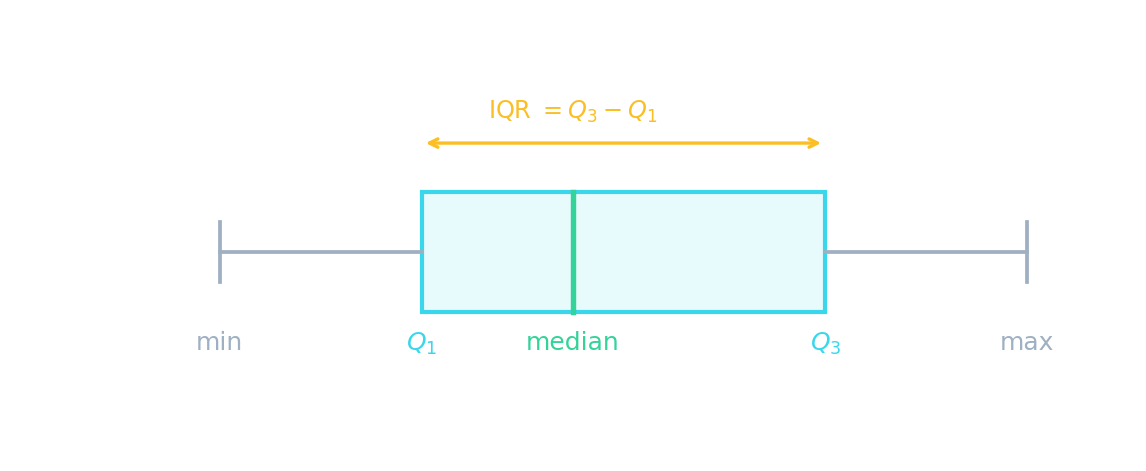
A box plot shows the five-number summary; the box spans the interquartile range 四分位距, IQR = Q₃ − Q₁.
Histogram vs bar chart. In a histogram, bars can have different widths and the area (not height) represents frequency. Frequency density 频率密度 $= \dfrac{\text{frequency}}{\text{class width}}$.
Histogram area = frequency, not height. When class widths are unequal, the vertical axis shows frequency density, not frequency. A tall narrow bar may represent fewer data points than a short wide one.
การกระจายและรูปทรงกระดิ่ง
P(−k < Z < k)
การกระจายวัดได้ด้วย ส่วนเบี่ยงเบนมาตรฐาน — ประมาณ 68% ของข้อมูลอยู่ภายใน 1 sd, 95% ภายใน 2
ในฮิสโตแกรมของข้อมูลกลุ่ม ค่าความถี่แสดงโดย:
ความยาก 1/5 · 100 เหรียญ + บอนัสน้อยๆ เมื่อทำสำเร็จครั้งแรกในวันนี้
ในฮิสโตแกรม พื้นที่ของแต่ละแท่งแทนค่าความถี่
ในฮิสโตแกรมที่มีความกว้างกลุ่มไม่เท่ากัน ความสูงของแต่ละแท่งเท่ากับค่าความถี่
ความยาก 1/5 · 100 เหรียญ + บอนัสน้อยๆ เมื่อทำสำเร็จครั้งแรกในวันนี้
เมื่อความกว้างไม่เท่ากัน ความสูงจะแสดงถึงความหนาแน่นของความถี่ (ความถี่/ความกว้าง) ไม่ใช่ความถี่โดยตรง พื้นที่แทนความถี่
จับคู่แผนภูมิสถิติแต่ละประเภทกับสิ่งที่มันแสดงได้ดีที่สุด
ความยาก 2/5 · 140 เหรียญ + บอนัสน้อยๆ เมื่อทำสำเร็จครั้งแรกในวันนี้
แผนภูมิกล่องแสดงควอไทล์และการกระจายตัว; ฮิสโตแกรมใช้พื้นที่แท่งสำหรับความถี่; ความถี่สะสมให้ค่ามัธยฐาน/ควอไทล์; ก้านและใบคงค่าข้อมูลเดิม
Averages and spread
- Central tendency: mean 平均数 $\bar{x} = \dfrac{\sum x}{n}$, median (middle), mode 众数 (most common).
- Spread: range, interquartile range, and standard deviation 标准差 $\sigma = \sqrt{\dfrac{\sum x^2}{n} - \bar{x}^2}$.
- Variance 方差 = $\sigma^2$.
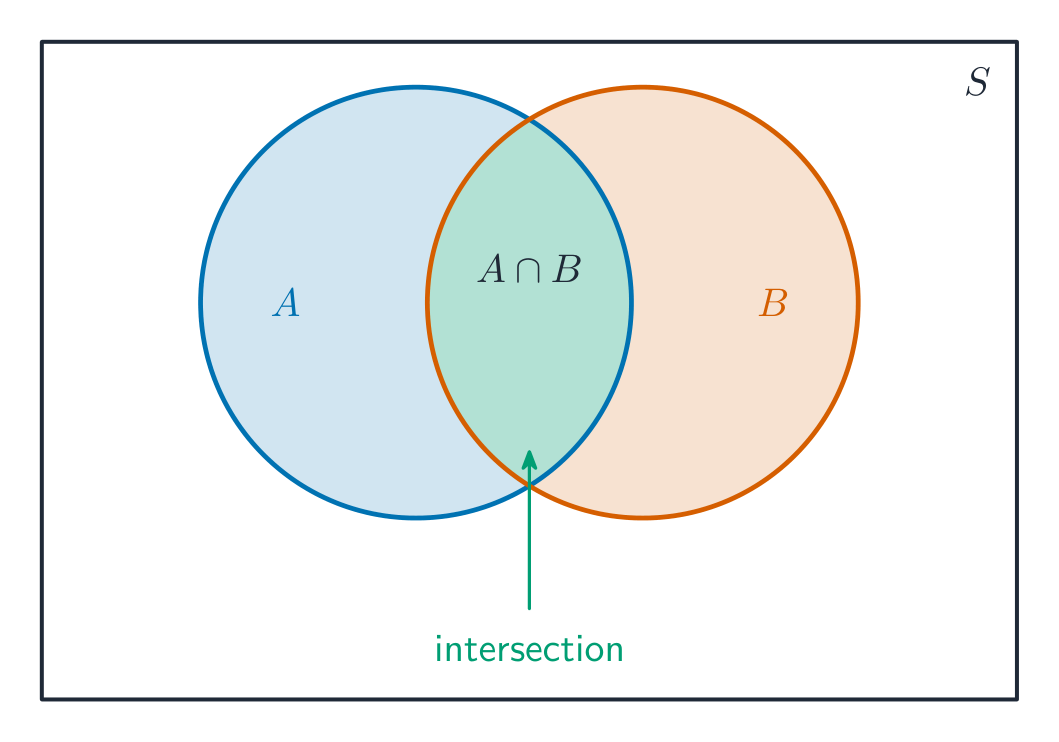
A Venn diagram: the overlap is the intersection of two events
สำหรับ 10 ค่าที่มี Σx = 50, ค่าเฉลี่ยคืออะไร?
ความยาก 2/5 · 140 เหรียญ + บอนัสน้อยๆ เมื่อทำสำเร็จครั้งแรกในวันนี้
ค่าเฉลี่ย = Σx / n = 50 / 10 = 5.
สำหรับ 10 ค่า, Σx = 50 และ Σx² = 300. ส่วนเบี่ยงเบนมาตรฐานคืออะไร? (√(Σx²/n − x̄²))
ความยาก 2/5 · 140 เหรียญ + บอนัสน้อยๆ เมื่อทำสำเร็จครั้งแรกในวันนี้
σ = √(300/10 − 5²) = √(30 − 25) = √5 ≈ 2.24.
สำหรับข้อมูล 2, 4, 4, 4, 5, 5, 7, 9,Median คืออะไร?
ความยาก 2/5 · 140 เหรียญ + บอนัสน้อยๆ เมื่อทำสำเร็จครั้งแรกในวันนี้
ด้วย 8 ค่า Median คือผลเฉลี่ยของค่าที่ 4 และ 5: (4 + 5)/2 = 4.5.
ถ้าส่วนเบี่ยงเบนมาตรฐานคือ 3, Variance คือเท่าใด?
ความยาก 2/5 · 140 เหรียญ + บอนัสน้อยๆ เมื่อทำสำเร็จครั้งแรกในวันนี้
Variance = σ² = 3² = 9.
Worked example — standard deviation
- Data: 2, 4, 4, 4, 5, 5, 7, 9. $n = 8$, $\sum x = 40$, $\sum x^2 = 232$.
- Mean $\bar{x} = \dfrac{40}{8} = 5$.
- Variance $= \dfrac{232}{8} - 5^2 = 29 - 25 = 4$.
- Standard deviation $\sigma = \sqrt{4} = 2$.
Choosing the right average
- Mean: uses all data, but affected by outliers 离群值.
- Median: not affected by outliers — good for skewed data (like salaries).
- Mode: useful for categorical data (most popular colour, most common shoe size).
- Display data with stem-and-leaf diagrams, box-and-whisker plots and cumulative frequency graphs, and measure its variation (spread).
You've got it
- diagrams: stem-and-leaf, box plot, histogram (area = frequency), cumulative frequency
- averages: mean, median, mode; spread: range, IQR, standard deviation
- $\sigma = \sqrt{\dfrac{\sum x^2}{n} - \bar{x}^2}$, and variance $= \sigma^2$
Write from the data: find the mean
- The values are 4, 4, 8 and 12. A class of width 4 has frequency 12.
- Find the mean, the median and the frequency density.
สำหรับ 4, 4, 8 และ 12 ค่าเฉลี่ยและค่ามัธยฐานคืออะไร? ความหนาของความถี่ของช่วงที่มีขนาด 4 และความถี่ 12 เป็นเท่าไหร่?
28 หารด้วย 4 ได้ 7 ค่าตรงกลางสองค่าเฉลี่ยได้ 6
ค่าเฉลี่ยคืออะไร?
ความยาก 1/5 · 100 เหรียญ + บอนัสน้อยๆ เมื่อทำสำเร็จครั้งแรกในวันนี้
28 หารด้วย 4 ได้ 7 ตัวเลือกอื่น — 5 (ค่าเฉลี่ยในบทเรียน); 3 (ความหนาของความถี่)