Descriptives: centre, spread, shape, outliers
Введено| English | Значение |
|---|---|
| mean/miːn/ | The sum of a set of values divided by the number of values. |
| median/ˈmiːdiːən/ | The middle value when data are arranged in order, or the mean of the two middle values for an even number of observations. |
| standard deviation/ˈstændəd ˌdiːvɪˈeɪʃn/ | A measure of spread equal to the square root of the variance. |
One sentence that hides a distribution
- "Average delivery: 27.4 minutes" is true — and almost empty. Forty orders sit behind it, from 16.8 to 38.5 minutes, and description is where you meet them.
- Four questions, every dataset: centre, spread, shape, outliers.
Centre: two answers, two jobs
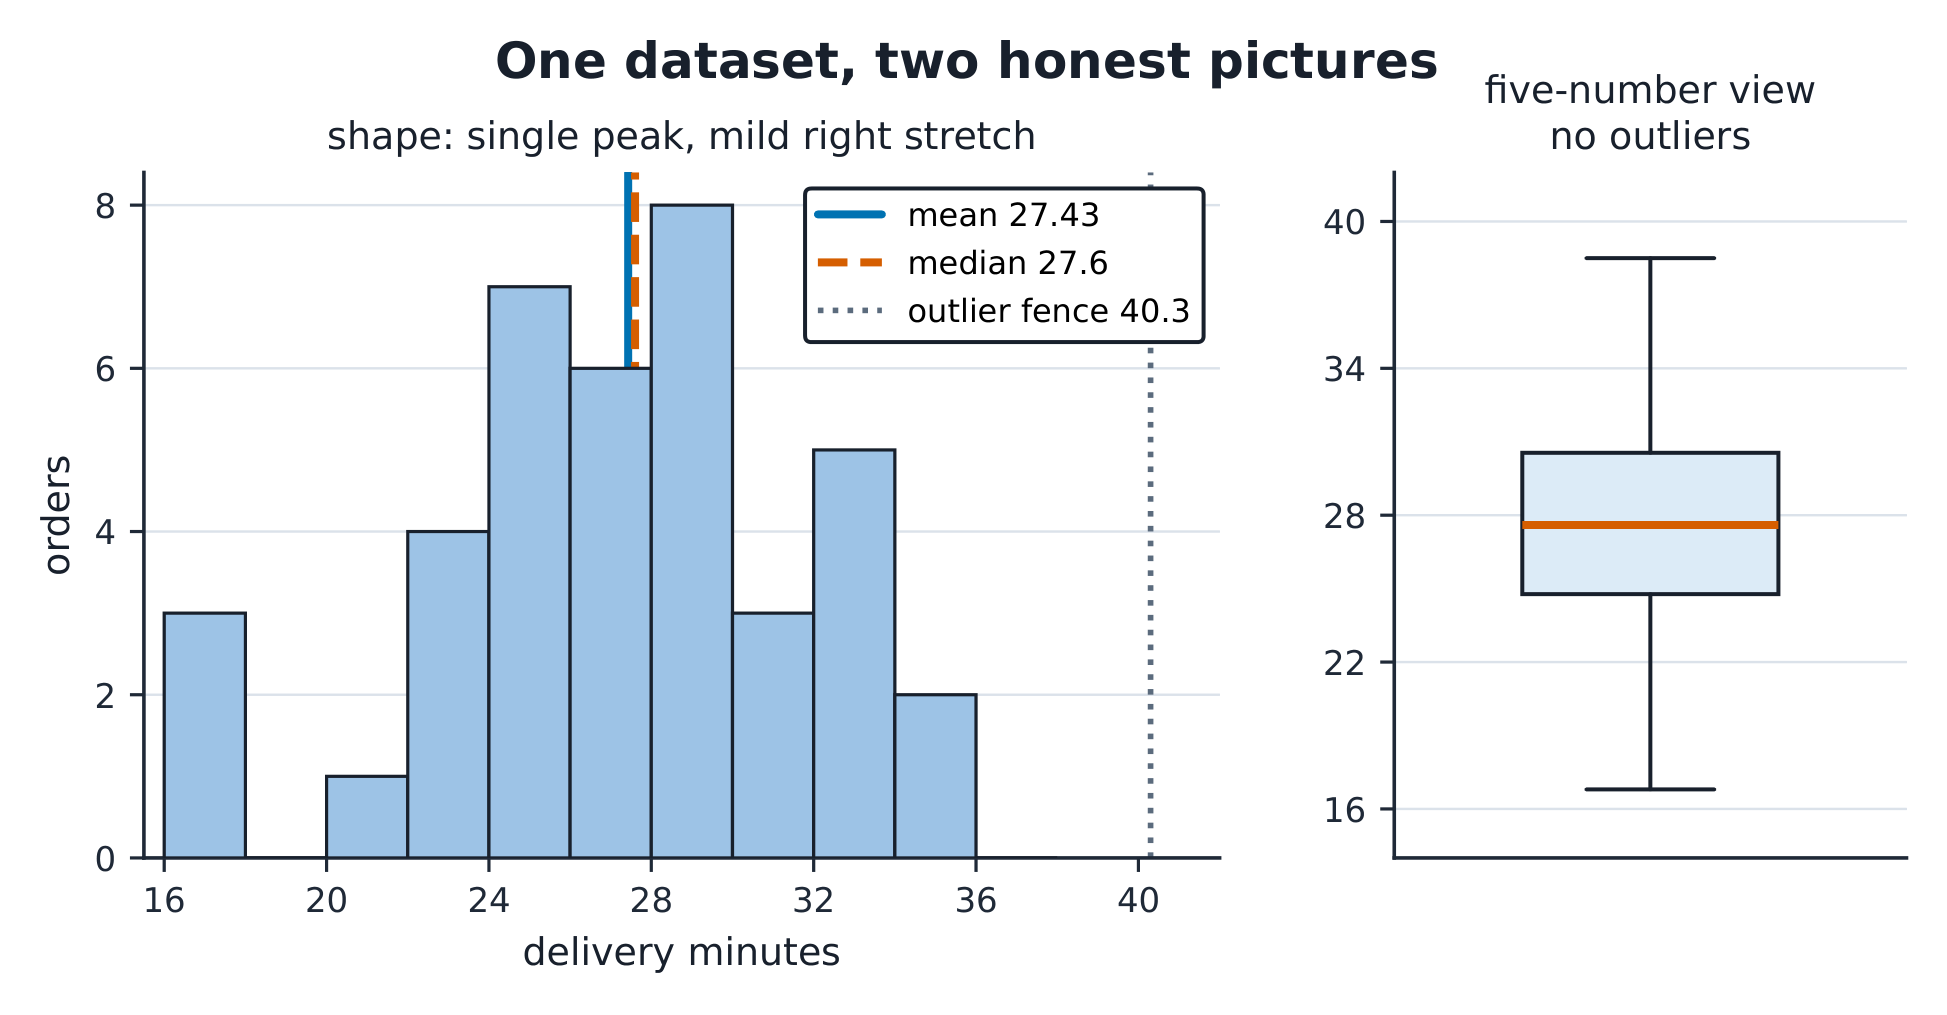
- Mean 均值 = sum ÷ n = 1,097.1 ÷ 40 = 27.43. The median 中位数 (middle order) = 27.6. So close because the data's stretch is mild.
- The mean follows the tail; the median resists it. For skewed money or delay data, report the median — and say why you did.
The 40 times sum to 1,097.1 minutes. The mean, to two decimals?
Сложность 2/5 · 140 монет + небольшой бонус за первое завершение сегодня
$1{,}097.1/40 = 27.4275 \approx 27.43$. The median, for contrast, is 27.6.
With a right-skewed distribution the mean is always above the median.
Сложность 1/5 · 100 монет + небольшой бонус за первое завершение сегодня
Usually - but the delivery data has mean 27.43 BELOW median 27.6 because the left side clusters under 18 minutes. Check the data; do not recite the slogan.
Spread: sd and IQR
- Standard deviation 标准差 $= \sqrt{940.9/39} = \mathbf{4.91}$ — the typical distance from the mean. Divide by $n-1$: one degree of freedom spent estimating the mean.
- The quartiles 24.5 / 27.6 / 30.9 give the IQR 6.3 — the middle half's width, immune to tails.
Which measure answers which question?
Match questions to the right measure and picture, and outlier cases to the right response.
The squared deviations sum to 940.9. The sample sd, to two decimals?
Сложность 2/5 · 140 монет + небольшой бонус за первое завершение сегодня
$s = \sqrt{940.9/39} = 4.91$. Dividing by n (40) would understate spread - one degree of freedom pays for estimating the mean.
Quartiles are 24.5 and 30.9. The IQR?
Сложность 2/5 · 140 монет + небольшой бонус за первое завершение сегодня
$30.9 - 24.5 = 6.4$ (the handout's 6.3 comes from the exact quantile method; either is fine if stated). The middle half of orders spans about six and a half minutes.
Match each question to the best single measure.
Сложность 2/5 · 140 монет + небольшой бонус за первое завершение сегодня
Robustness wants order statistics; totals want sums; each spread measure answers a different spread question.
Shape and the honest axis
- Single peak, mild right stretch — and the mean sits slightly BELOW the median (27.43 < 27.6): the left side has its own cluster (three runs under 18 minutes). Check the slogan "right skew ⇒ mean above median" against the data, never recite it.
- Chart honesty: an axis starting at 24 minutes triples visual differences. Draw from zero or declare the break.
A bar chart whose y-axis starts at 24 instead of 0 is dishonest even when every bar is drawn to scale.
Сложность 1/5 · 100 монет + небольшой бонус за первое завершение сегодня
Truncation multiplies visual differences - the numbers are true and the picture lies. Honest options: start at zero, or mark the break loudly.
Outliers: catch, investigate, decide
- The fence: Q1 − 1.5×IQR = 15.0, Q3 + 1.5×IQR = 40.3. No delivery crosses it — 38.5 is high but inside.
- Change one digit to 168 minutes: the mean jumps to 30.43, the sd quadruples to 22.0, the median barely moves — and the fence catches it. Never delete silently: investigate, document, decide.
With Q1 = 24.5, Q3 = 30.9: what is the UPPER outlier fence?
Сложность 2/5 · 140 монет + небольшой бонус за первое завершение сегодня
$Q3 + 1.5 \times IQR = 30.9 + 9.6 = 40.5$ (40.3-40.5 by method). The slowest real order, 38.5, stays inside - no outliers.
One delivery is mistyped as 168 minutes. What happens?
Сложность 1/5 · 100 монет + небольшой бонус за первое завершение сегодня
The mean gains $128/40 = 3.2$ minutes; the sd explodes to about 22; the median moves 0.05. One keystroke owns the mean - which is why outliers are investigated, not ignored.
Three descriptive slips
- A mean without a shape. Skew changes what the mean means.
- Silent outlier surgery. The decision must be documented, not implied.
- Chart-first thinking. Truncated axes and dual scales lie with true numbers.
Recap
- Centre (mean vs median), spread (sd, IQR), shape, outliers — report all four.
- The fence is a detector, not a verdict.
- The picture can lie while the numbers are true.