English
Learning Objective 1.1.A: Describe how the input and output values of a function vary together by comparing function values.
- 1.1.A.1 A function is a mathematical relation that maps a set of input values to a set of output values such that each input value is mapped to exactly one output value. The set of input values is called the domain of the function, and the set of output values is called the range of the function. The variable representing input values is called the independent variable, and the variable representing output values is called the dependent variable.
- 1.1.A.2 The input and output values of a function vary in tandem according to the function rule, which can be expressed graphically, numerically, analytically, or verbally.
- 1.1.A.3 A function is increasing over an interval of its domain if, as the input values increase, the output values always increase. That is, for all $a$ and $b$ in the interval, if $a < b$, then $f(a) < f(b)$.
- 1.1.A.4 A function is decreasing over an interval of its domain if, as the input values increase, the output values always decrease. That is, for all $a$ and $b$ in the interval, if $a < b$, then $f(a) > f(b)$.
Learning Objective 1.1.B: Construct a graph representing two quantities that vary with respect to each other in a contextual scenario.
- 1.1.B.1 The graph of a function displays a set of input-output pairs and shows how the values of the function's input and output values vary.
- 1.1.B.2 A verbal description of the way aspects of phenomena change together can be the basis for constructing a graph.
- 1.1.B.3 The graph of a function is concave up on intervals in which the rate of change is increasing.
- 1.1.B.4 The graph of a function is concave down on intervals in which the rate of change is decreasing.
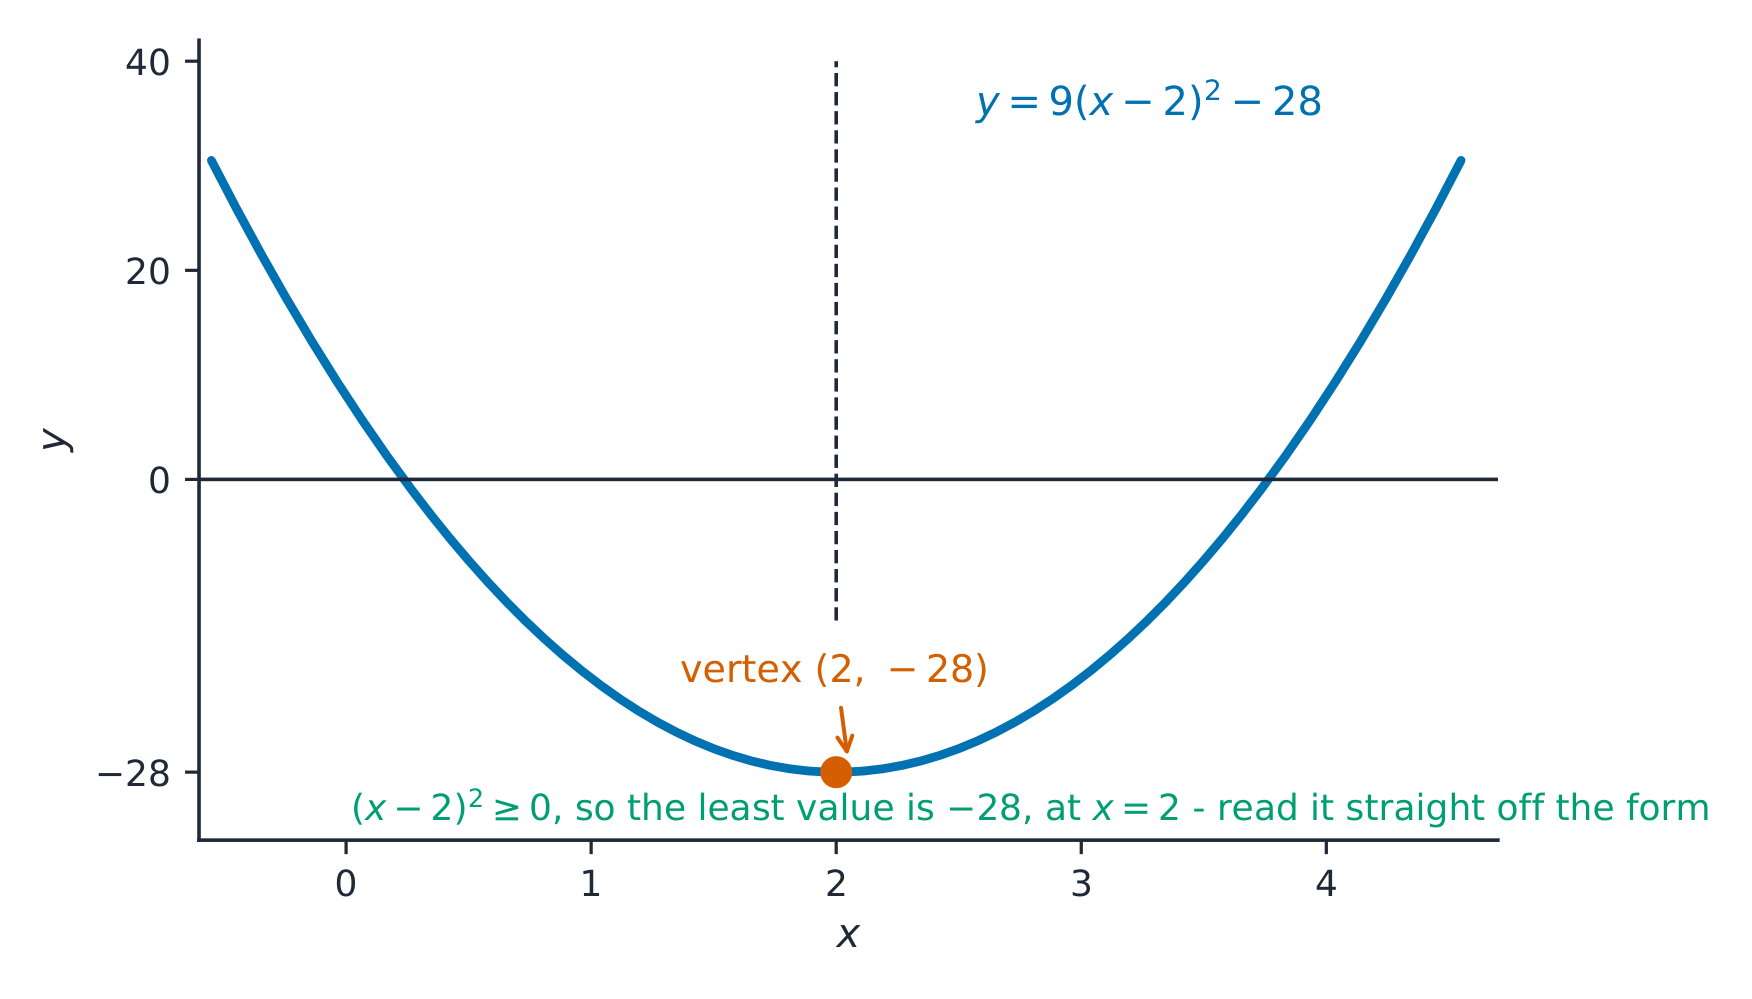
- 1.1.B.5 The graph intersects the $x$-axis when the output value is zero. The corresponding input values are said to be zeros of the function.
Русский
Цель обучения 1.1.A: Описывать, как входные и выходные значения функции изменяются совместно, сравнивая значения функции.
- 1.1.A.1 Функция — это математическая зависимость, которая ставит в соответствие каждому элементу множества входных значений ровно один элемент множества выходных значений. Множество входных значений называется областью определения функции, а множество выходных значений называется областью значений функции. Переменная, представляющая входные значения, называется независимой переменной, а переменная, представляющая выходные значения, называется зависимой переменной.
- 1.1.A.2 Входные и выходные значения функции изменяются совместно в соответствии с правилом функции, которое может быть выражено графически, численно, аналитически или словесно.
- 1.1.A.3 Функция является возрастающей на интервале её области определения, если при увеличении входных значений выходные значения также всегда увеличиваются. То есть, для любых $a$ и $b$ в этом интервале, если $a < b$, то $f(a) < f(b)$.
- 1.1.A.4 Функция является убывающей на интервале её области определения, если при увеличении входных значений выходные значения всегда уменьшаются. То есть, для любых $a$ и $b$ в этом интервале, если $a < b$, то $f(a) > f(b)$.
Цель обучения 1.1.B: Построить график, представляющий две величины, изменяющиеся друг относительно друга в контекстной ситуации.
- 1.1.B.1 График функции отображает набор пар вход-выход и показывает, как изменяются значения входных и выходных значений функции.
- 1.1.B.2: Вербальное описание того, как аспекты явлений изменяются совместно, может служить основой для построения графика.
- 1.1.B.3 График функции является выпуклым вниз (вогнутым вверх) на интервалах, где скорость изменения увеличивается.
- 1.1.B.4 График функции является выпуклым вверх (вогнутым вниз) на интервалах, где скорость изменения уменьшается.
- 1.1.B.5 График пересекает ось $x$, когда выходное значение равно нулю. Соответствующие входные значения называются нулями функции.