Diagramas de dispersão e correlação
Introduzido| English | Significado |
|---|---|
| scatter diagram/ˈskætə ˈdaɪəɡræm/ | diagrama de dispersão |
| correlation/ˌkɒrɪˈleɪʃn/ | correlação |
| positive correlation/ˈpɒzɪtɪv ˌkɒrɪˈleɪʃn/ | correlação positiva |
| negative correlation/ˈneɡətɪv ˌkɒrɪˈleɪʃn/ | correlação negativa |
| line of best fit/laɪn ɒv best fɪt/ | reta de melhor ajuste |
| extrapolation/ekˈstræpəleɪʃn/ | extrapolação |
| outlier/ˈaʊtlaɪə/ | valor atípico |
Do tall people have bigger feet?
- Plot height against shoe size for 30 people and you'll see a pattern: taller people tend to have larger feet.
- A scatter diagram 散点图 reveals whether two variables are linked — and how strongly.
Correlation 相关性
- Positive correlation 正相关: as one goes up, the other goes up (points slope upward).
- Negative correlation 负相关: as one goes up, the other goes down (points slope downward).
- Zero correlation: no clear pattern (points scattered randomly).
Correlation $\neq$ causation. Ice cream sales and drowning deaths both rise in summer — but ice cream doesn't cause drowning. Both are caused by a third factor: hot weather.
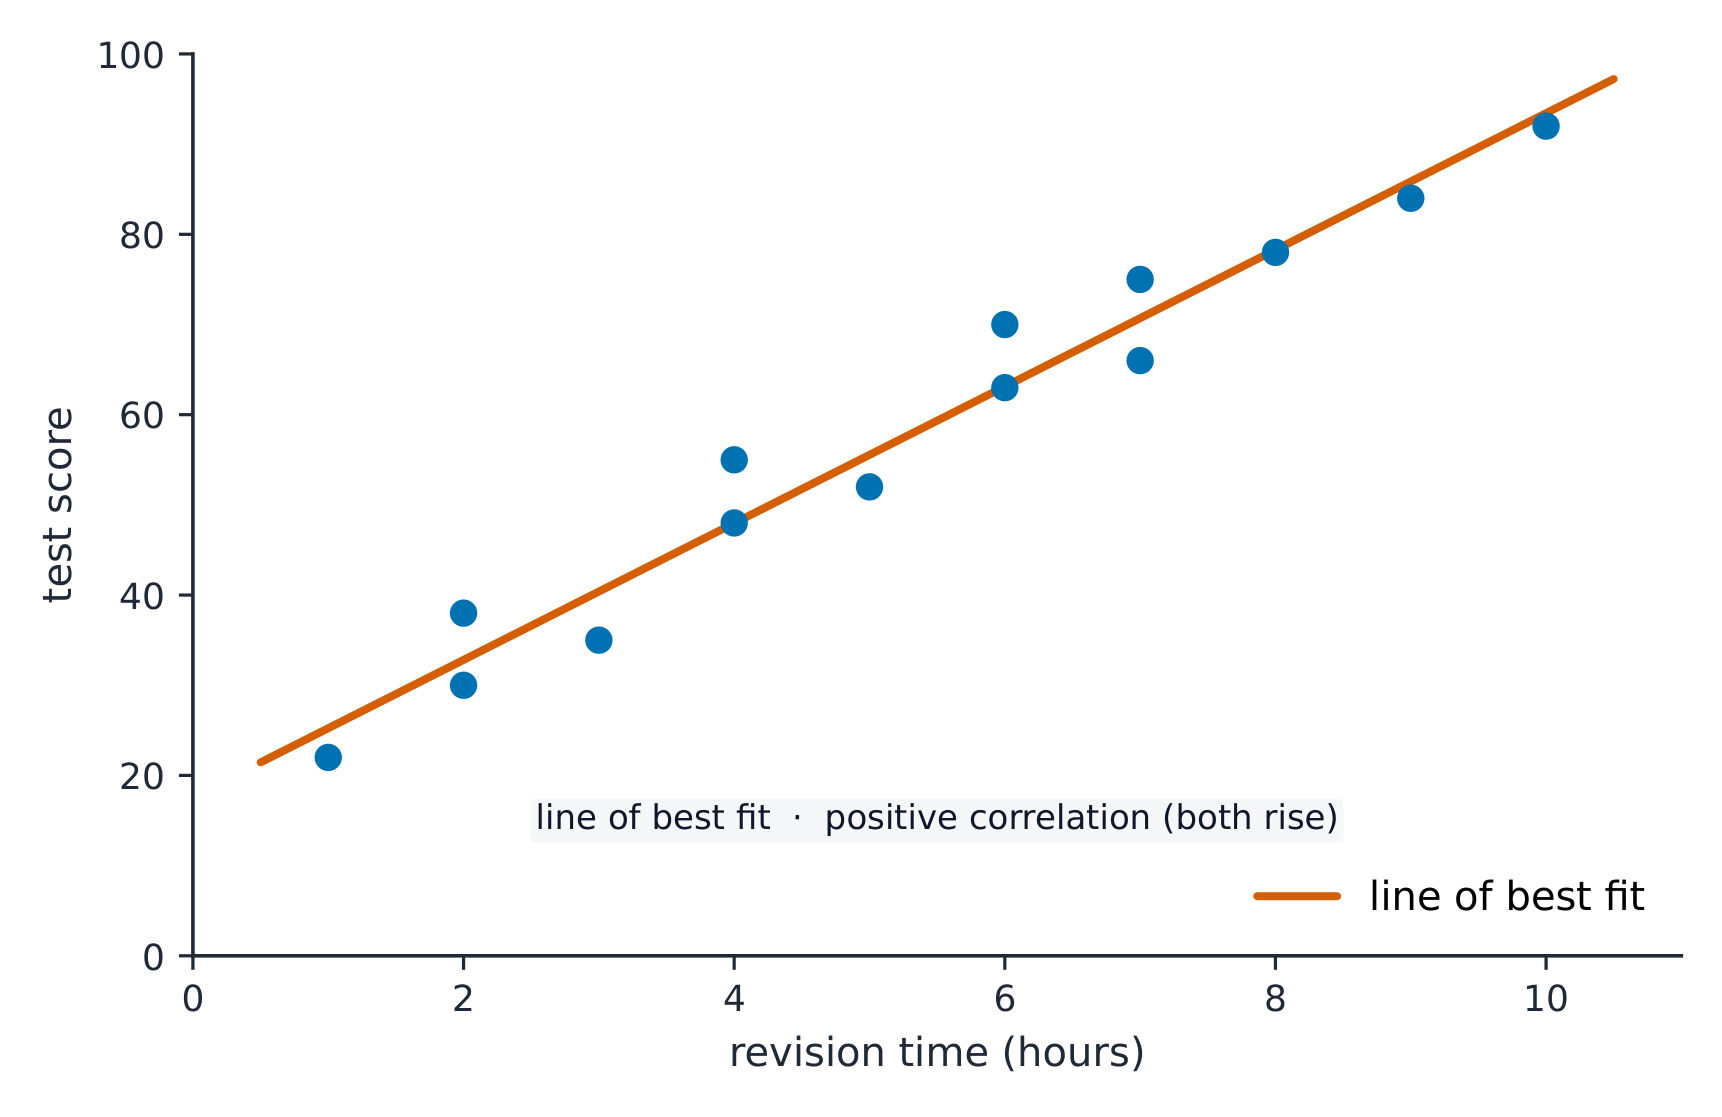
A line of best fit 最佳拟合线 is one straight line through the middle of the points, with about as many on each side; use it to predict
Dispersão & correlação
r próximo a ±1 = forte
Apertar os pontos para ver correlação forte; espalhar para fraca — leia r e a linha.
Quando uma quantidade aumenta, a outra também aumenta. Isso é:
Dificuldade 1/5 · Moedas 100 + pequeno bônus na primeira conclusão hoje
Ambos subindo juntos é correlação positiva.
Correlação negativa significa que quando uma quantidade sobe, a outra desce.
Dificuldade 1/5 · Moedas 100 + pequeno bônus na primeira conclusão hoje
Uma tendência descendente no gráfico de dispersão é correlação negativa.
Se duas variáveis estão correlacionadas, uma deve causar a outra.
Dificuldade 1/5 · Moedas 100 + pequeno bônus na primeira conclusão hoje
Correlação não prova causalidade — ambas podem ser causadas por um terceiro fator.
Line of best fit
- If there is correlation, draw one straight line through the middle of the points, with roughly equal numbers on each side.
- Use it to predict values.
A line of best fit through height-shoe size data: height $170$ cm → predicted shoe size $9$. But don't trust predictions far outside the data range (extrapolation 外推 is risky).
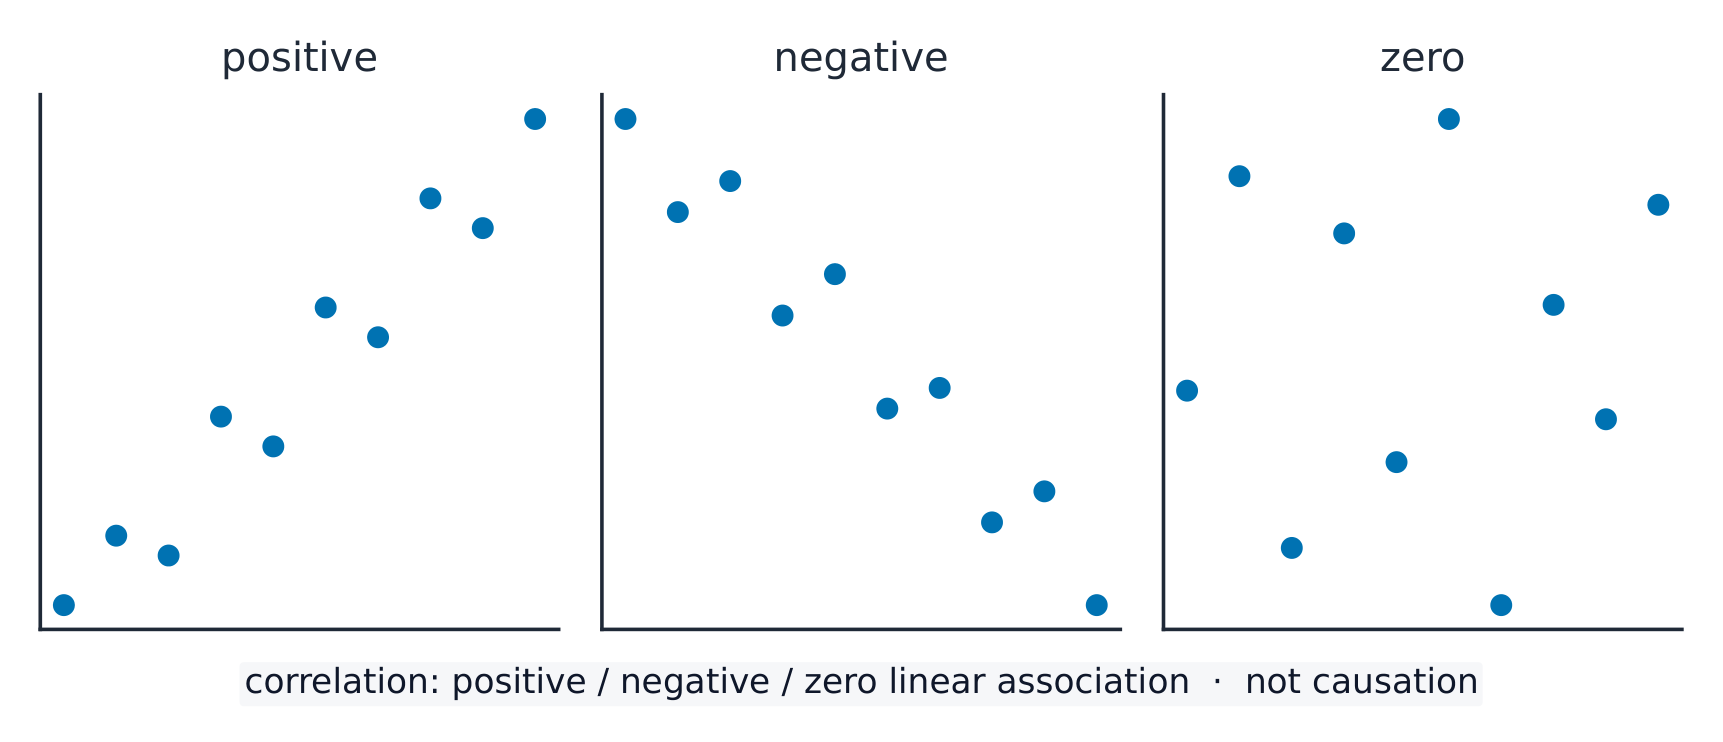
Positive correlation: both rise together. Negative: one rises as the other falls. Zero: no clear link
Uma linha de melhor ajuste é usada principalmente para:
Dificuldade 1/5 · Moedas 100 + pequeno bônus na primeira conclusão hoje
Ela modela a tendência para que você possa prever um valor a partir do outro.
Usar a linha de melhor ajuste para prever valores muito fora da faixa de dados é chamado de ______.
Dificuldade 1/5 · Moedas 100 + pequeno bônus na primeira conclusão hoje
Extrapolação é pouco confiável porque a tendência pode não continuar além dos dados observados.
Outliers 异常值 on scatter diagrams
- A point far from the general pattern is an outlier.
- Investigate before removing it — it might be a genuine unusual case, or a recording error.

Scatter diagrams reveal patterns: positive (like a rising line), negative (like a falling line), or zero (no pattern).
Em um gráfico de dispersão, a maioria dos pontos segue uma linha, mas um ponto está longe. Esse ponto é chamado de ______.
Dificuldade 1/5 · Moedas 100 + pequeno bônus na primeira conclusão hoje
Um outlier é um ponto de dado que não se encaixa no padrão geral.
Plot pairs and read an estimate
- Mark each pair with a small cross, not joined points. For $(1,12),(2,15),(3,19),(4,20),(5,24)$, a sensible by-eye line is close to $y=3x+9$; it spans all the data and roughly balances the points above and below.
- At $x=3.5$, this line estimates $y=19.5$. A nearby balanced line may give a slightly different answer. Predicting at $x=20$ is extrapolation and much less secure; correlation alone does not prove cause.
Use a reta y = 3x + 9 para estimar y em x = 3.5.
Dificuldade 2/5 · Moedas 140 + pequeno bônus na primeira conclusão hoje
y = 3(3.5) + 9 = 19.5.
You've got it
- positive correlation rises together; negative falls as the other rises; zero $=$ no link
- a line of best fit is one straight line through the middle of the points
- use the line to predict — but don't trust it far outside the data
Write from the data: find the estimate
- Use the line y equals 2x plus 5.
- Estimate y at x equals 4.
Use a reta y igual a 2x mais 5 para estimar y quando x for igual a 4.
8 mais 5 resulta em 13.
Qual é a estimativa?
Dificuldade 1/5 · Moedas 100 + pequeno bônus na primeira conclusão hoje
2 vezes 4 mais 5 resulta em 13. Outras opções — 19.5 (a estimativa da lição); 4 (a entrada).