Cumulative frequency diagrams · Diagramas de frequência cumulativa
| English | Português |
|---|---|
| cumulative frequency/ˈkjuːmjʊlətɪv ˈfriːkwənsi/ | frequência acumulada |
| median/ˈmiːdiːən/ | mediana |
| quartile/ˈkwɔːtaɪl/ | quartil |
The running total
- In a marathon, you don't just count runners per age group — you want to know "how many runners have finished by time $t$?"
- That's a cumulative frequency 累积频数: a running total that builds up from the lowest class to the highest.
O total acumulado
- Em uma maratona, você não conta apenas corredores por grupo etário — quer saber "quantos corredores terminaram até o tempo $t$?"
- Isso é uma frequência acumulada: um total crescente que se acumula da classe mais baixa à mais alta.
Cumulative frequency route · Rota de frequência cumulativa
Follow raw data into a cumulative frequency curve and percentile reading. · Siga os dados brutos até uma curva de frequência cumulativa e leitura percentil.
Drawing the curve
- Plot cumulative frequency against the upper end of each class.
- Join the points with a smooth curve (or straight lines).
- The curve always goes up (or stays flat) — it never goes down, because you're adding.
Classes $0$–$10$ (freq $5$), $10$–$20$ (freq $8$), $20$–$30$ (freq $12$): cumulative frequencies are $5, 13, 25$. Plot at $10, 20, 30$.
On a histogram with unequal class widths the bar AREA (not height) is the frequency, so the axis is frequency density
Desenhando a curva
- Plote a frequência acumulada contra o final de cada classe.
- Una os pontos com uma curva suave (ou linhas retas).
- A curva sempre vai para cima (ou se mantém plana) — nunca desce, porque você está somando.
Classes $0$–$10$ (freq $5$), $10$–$20$ (freq $8$), $20$–$30$ (freq $12$): frequências acumuladas são $5, 13, 25$. Plote em $10, 20, 30$.
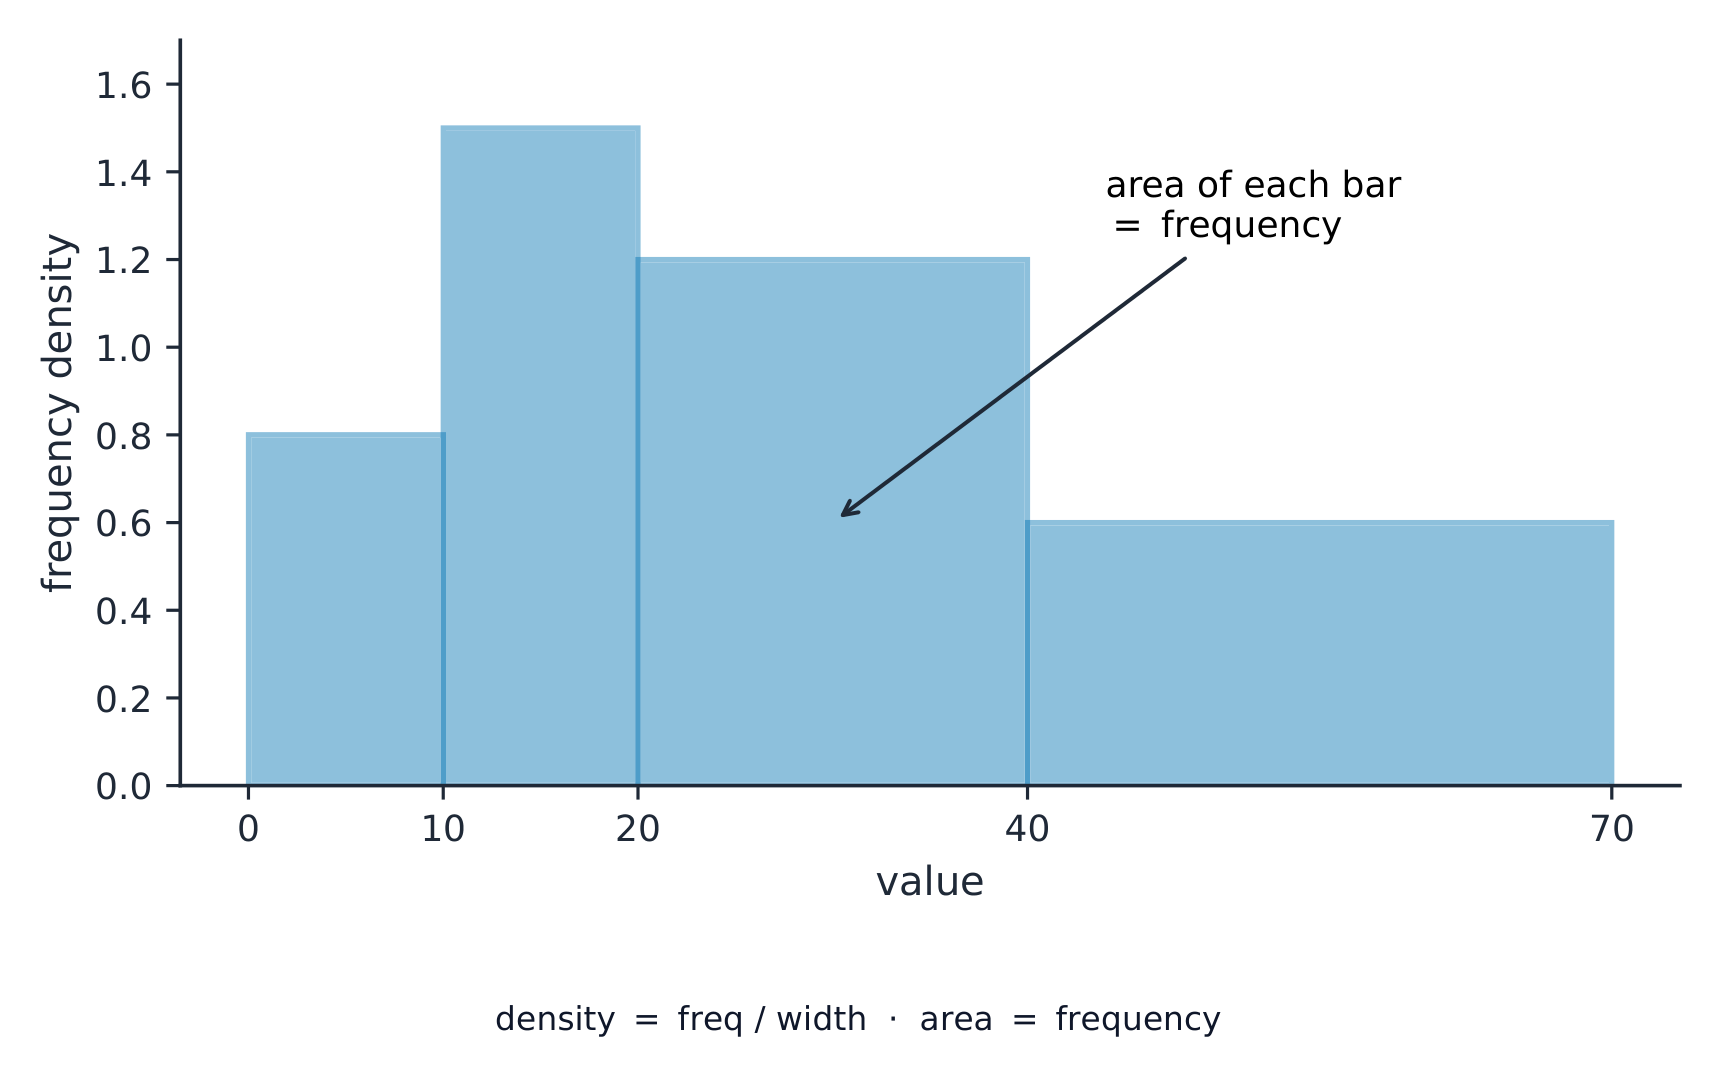
Em um histograma com larguras de classe desiguais, a ÁREA da barra (não a altura) é a frequência, então o eixo é densidade de frequência
Cumulative frequency is: · Frequência cumulativa é:
Each point adds the next class frequency to the total so far. · Cada ponto adiciona a próxima frequência de classe ao total até agora.
Cumulative frequency is plotted against the upper end of each class. · Frequência cumulativa é plotada contra o limite superior de cada classe.
Always plot the running total at the top boundary of the class. · Sempre plote o total acumulado no limite superior da classe.
A cumulative frequency curve can go down. · Uma curva de frequência cumulativa pode descer.
Cumulative frequency is a running total — it always increases or stays flat, never decreases. · Frequência cumulativa é uma soma acumulada — ela sempre aumenta ou permanece plana, nunca diminui.
Reading the curve
- Median 中位数: go across at half the total cumulative frequency, then down to the $x$-axis.
- Lower quartile 四分位数 (LQ): at $\dfrac{1}{4}$ of the total.
- Upper quartile (UQ): at $\dfrac{3}{4}$ of the total.
- IQR $=$ UQ $-$ LQ.
Across then down. To read a value from a cumulative frequency curve: go across from the $y$-axis to the curve, then down to the $x$-axis. Going the wrong way gives the wrong answer.
Read the median at half the total and the quartiles at one quarter and three quarters: go across to the curve, then down
Ler a curva
- Mediana: mova-se horizontalmente até a metade da frequência acumulada total, depois desça até o eixo $x$.
- Quartil inferior (QI): em $\dfrac{1}{4}$ do total.
- Quartil superior (QS): em $\dfrac{3}{4}$ do total.
- QRI $=$ QS $-$ QI.
Para o lado e depois para baixo. Para ler um valor de uma curva de frequência acumulada: vá para o lado do eixo $y$ até a curva, depois para baixo no eixo $x$. Ir no sentido errado dá a resposta errada.
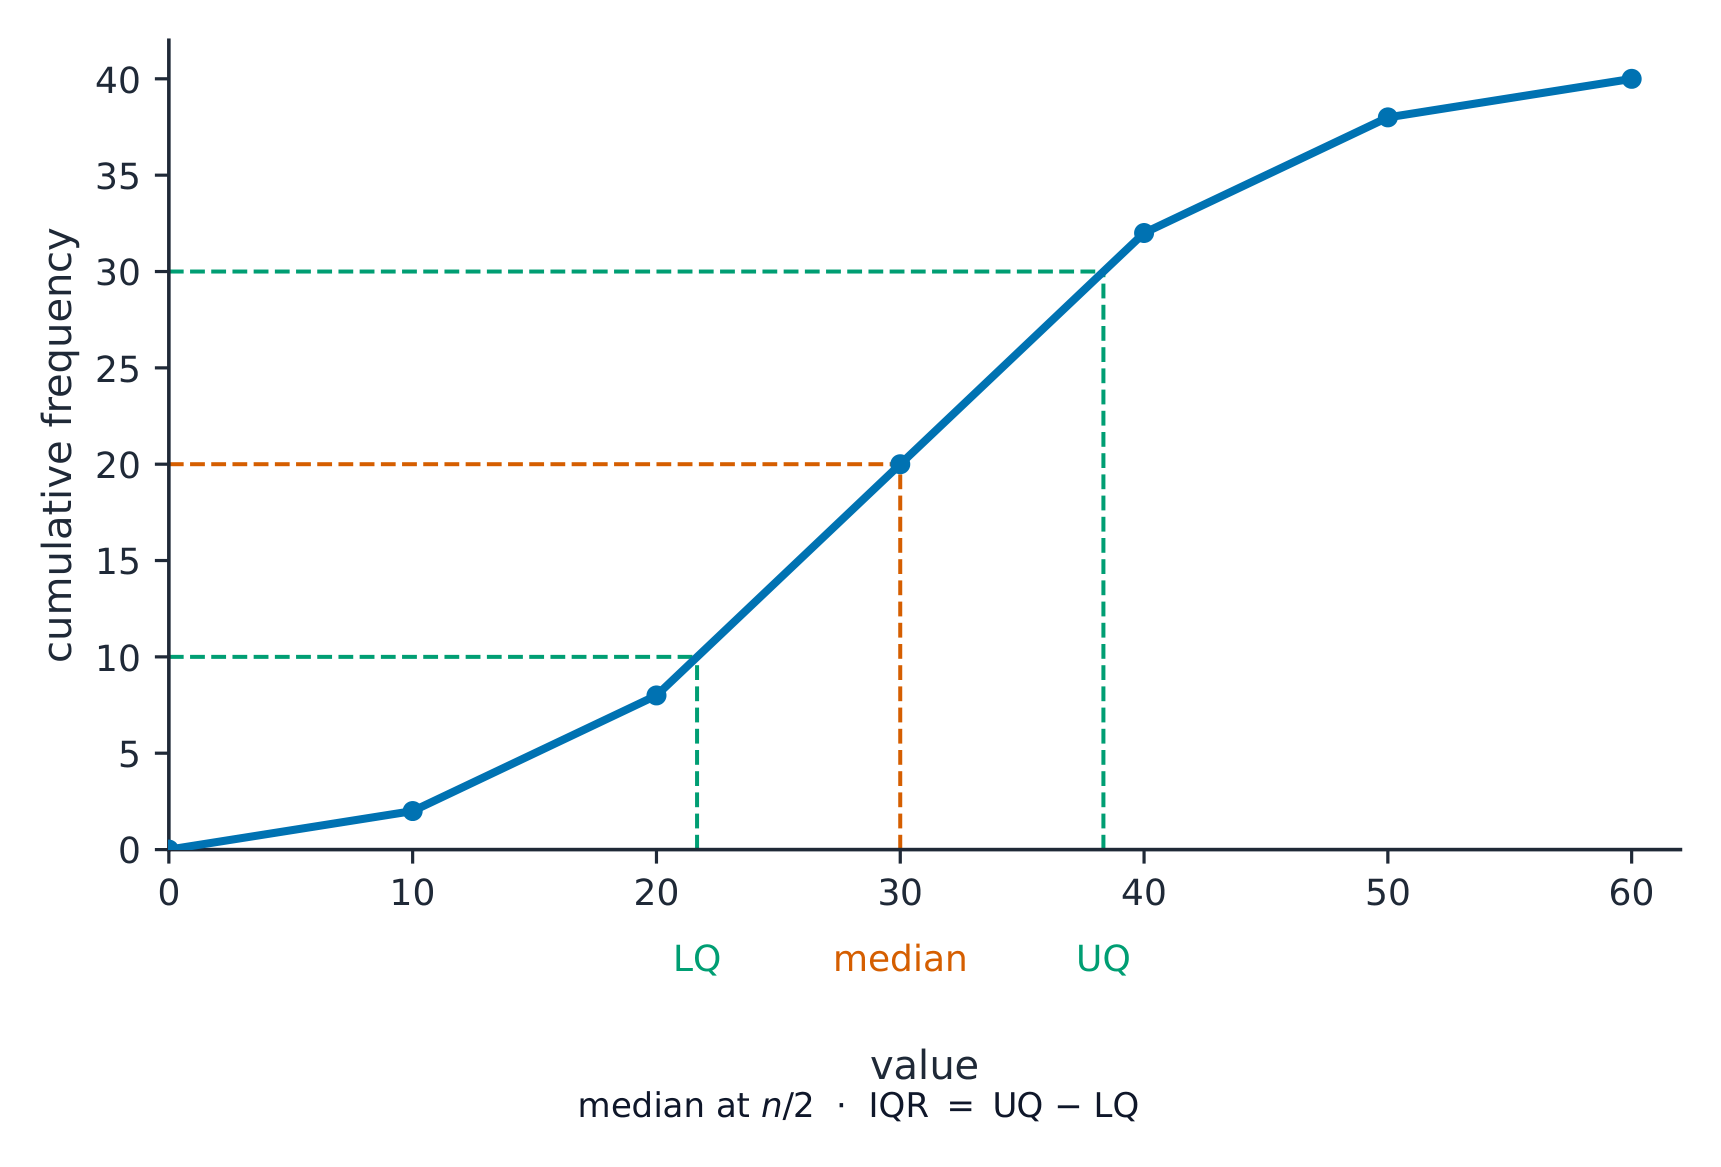
Leia a mediana em metade do total e os quartis em um quarto e três quartos: vá para o lado até a curva, depois para baixo
A cumulative frequency curve has total 80. At what cumulative frequency do you read the median? · Uma curva de frequência cumulativa tem total 80. Em que frequência cumulativa você lê a mediana?
The median is at half the total: 80 ÷ 2 = 40. · A mediana está na metade do total: 80 ÷ 2 = 40.
Total cumulative frequency is 120. At what cumulative frequency do you read the upper quartile? · A frequência cumulativa total é 120. Em que frequência cumulativa você lê o quartil superior?
UQ is at 3/4 of the total: (3/4) × 120 = 90. · O QU está em 3/4 do total: (3/4) × 120 = 90.
To read the median from a cumulative frequency curve, go ______ from the y-axis to the curve, then down to the x-axis. · Para ler a mediana de uma curva de frequência cumulativa, vá ______ do eixo y até a curva, depois para baixo até o eixo x.
Go across (horizontally) from the y-value to the curve, then down to read the x-value. · Vá horizontalmente (para o lado) do valor y até a curva, depois para baixo para ler o valor x.
Worked example
- Total cumulative frequency $= 80$. Median at $80 \div 2 = 40$. Read across at $40$ on the $y$-axis, then down — suppose it reads $24$. The median is $24$.
A cumulative frequency curve always rises — the shape is like an elongated S, steep where data is concentrated.
Exemplo resolvido
- Frequência acumulada total $= 80$. Mediana em $80 \div 2 = 40$. Leia para o lado em $40$ no eixo $y$, depois para baixo — suponha que leia $24$. A mediana é $24$.
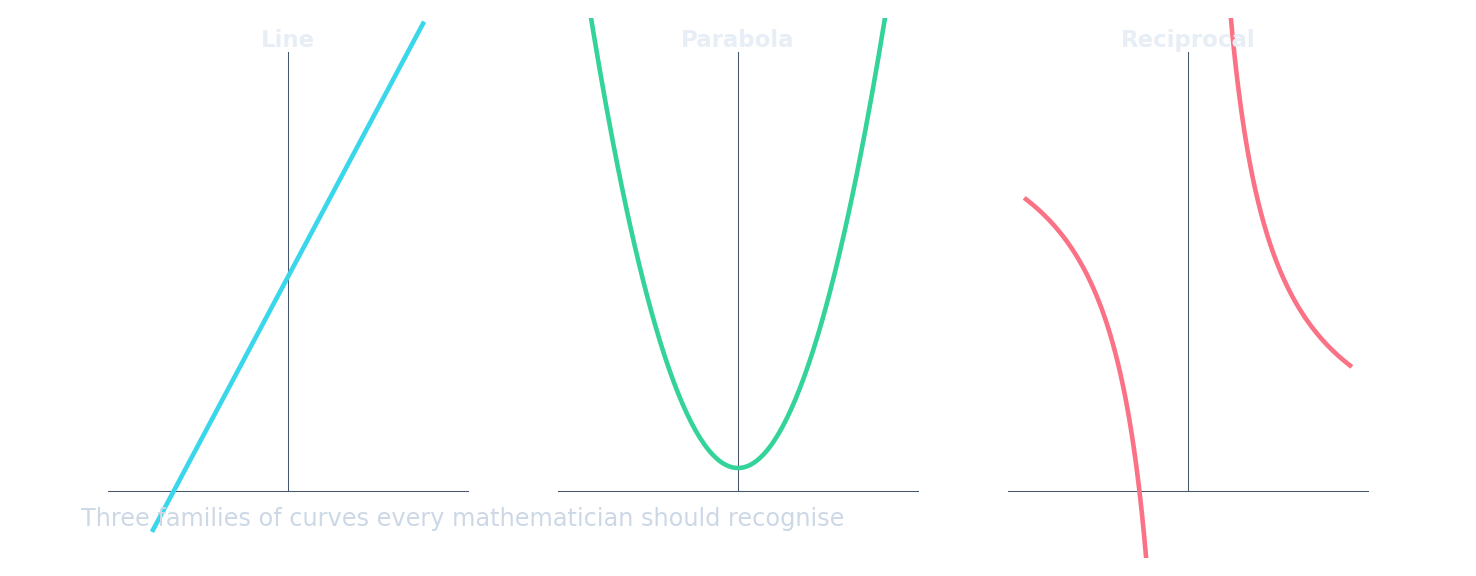
Uma curva de frequência acumulada sempre sobe — o formato é como um S alongado, íngreme onde os dados estão concentrados.
There are 25 observations and cumulative frequency 13 at 20. How many are at least 20? · Há 25 observações e frequência acumulada 13 em 20. Quantas têm pelo menos 20?
Subtract the count below 20: 25 − 13 = 12. · Subtraia a contagem abaixo de 20: 25 − 13 = 12.
Include the start and read a count
- For classes $0\le t<10,10\le t<20,20\le t<30$ with frequencies 5,8,12, plot $(0,0),(10,5),(20,13),(30,25)$. The first point states that none are below the lower starting boundary.
- At 20, cumulative frequency is 13, so $25-13=12$ observations are at least 20. Quartile positions are $25/4=6.25$ and $3(25)/4=18.75$ on the cumulative axis; read values from the drawn curve.
Incluir o início e ler uma contagem
- Para classes $0\le t<10,10\le t<20,20\le t<30$ com frequências 5,8,12, plotar $(0,0),(10,5),(20,13),(30,25)$. O primeiro ponto indica que nenhum valor está abaixo do limite inferior inicial.
- Em 20, a frequência acumulada é 13, então $25-13=12$ observações são pelo menos 20. As posições dos quartis são $25/4=6.25$ e $3(25)/4=18.75$ no eixo acumulado; leia os valores da curva desenhada.
You've got it
- cumulative frequency $=$ running total, plotted at each class's upper end
- read the median at half the total; quartiles at $\dfrac{1}{4}$ and $\dfrac{3}{4}$
- across to the curve, then straight down to the value
Entendeu?
- frequência cumulativa $=$ total acumulado, traçado no final superior de cada classe
- leia a mediana na metade do total; quartis em $\dfrac{1}{4}$ e $\dfrac{3}{4}$
- horizontalmente até à curva, depois verticalmente para baixo até ao valor