| English | 의미 |
|---|---|
| scatter diagram/ˈskætə ˈdaɪəɡræm/ | 산점도 |
| correlation/ˌkɒrɪˈleɪʃn/ | 상관관계 |
| positive correlation/ˈpɒzɪtɪv ˌkɒrɪˈleɪʃn/ | 양(正)의 상관관계 |
| negative correlation/ˈneɡətɪv ˌkɒrɪˈleɪʃn/ | 음(負)의 상관관계 |
| line of best fit/laɪn ɒv best fɪt/ | 최적拟合線 (최적 적합선) |
| extrapolation/ekˈstræpəleɪʃn/ | 외삽법 |
| outlier/ˈaʊtlaɪə/ | 이치값 |
Do tall people have bigger feet?
- Plot height against shoe size for 30 people and you'll see a pattern: taller people tend to have larger feet.
- A scatter diagram 散点图 reveals whether two variables are linked — and how strongly.
Correlation 相关性
- Positive correlation 正相关: as one goes up, the other goes up (points slope upward).
- Negative correlation 负相关: as one goes up, the other goes down (points slope downward).
- Zero correlation: no clear pattern (points scattered randomly).
Correlation $\neq$ causation. Ice cream sales and drowning deaths both rise in summer — but ice cream doesn't cause drowning. Both are caused by a third factor: hot weather.

A line of best fit 最佳拟合线 is one straight line through the middle of the points, with about as many on each side; use it to predict
산점도 및 상관관계
r이 ±1에 가까우면 = 강함
점을 밀집시켜 강한 상관관계를 보고, 흩어져 약한 상관관계를 보게 하십시오. r 값과 직선을 읽으세요.
한 양이 증가하면 다른 양도 증가합니다. 이것은:
난이도 1/5 · 100 코인 + 오늘 첫 완료 시 소액 보너스
둘 다 같이 상승하는 것은 양의 상관관계입니다.
음의 상관관계는 한 양이 증가할 때 다른 양이 감소함을 의미합니다.
난이도 1/5 · 100 코인 + 오늘 첫 완료 시 소액 보너스
산점도에서 아래로 향하는 추세는 음의 상관관계입니다.
두 변수가 상관관계에 있다면,其中一个必须导致另一个。
난이도 1/5 · 100 코인 + 오늘 첫 완료 시 소액 보너스
상관관계는 인과성을 증명하지 않습니다—둘 다 세 번째 요인에 의해 발생할 수 있습니다.
Line of best fit
- If there is correlation, draw one straight line through the middle of the points, with roughly equal numbers on each side.
- Use it to predict values.
A line of best fit through height-shoe size data: height $170$ cm → predicted shoe size $9$. But don't trust predictions far outside the data range (extrapolation 外推 is risky).

Positive correlation: both rise together. Negative: one rises as the other falls. Zero: no clear link
최적 적합선(line of best fit)은 주로 다음을 위해 사용됩니다:
난이도 1/5 · 100 코인 + 오늘 첫 완료 시 소액 보너스
추세를 모델링하여 하나의 값으로부터 다른 값을 예측할 수 있게 합니다.
최적 적합선을 사용하여 데이터 범위 밖으로 멀리 떨어진 값을 예측하는 것을 ______라고 합니다.
난이도 1/5 · 100 코인 + 오늘 첫 완료 시 소액 보너스
외삽은 신뢰할 수 없습니다. 관측된 데이터 범위를 넘어서 추세가 계속되지 않을 수 있기 때문입니다.
Outliers 异常值 on scatter diagrams
- A point far from the general pattern is an outlier.
- Investigate before removing it — it might be a genuine unusual case, or a recording error.
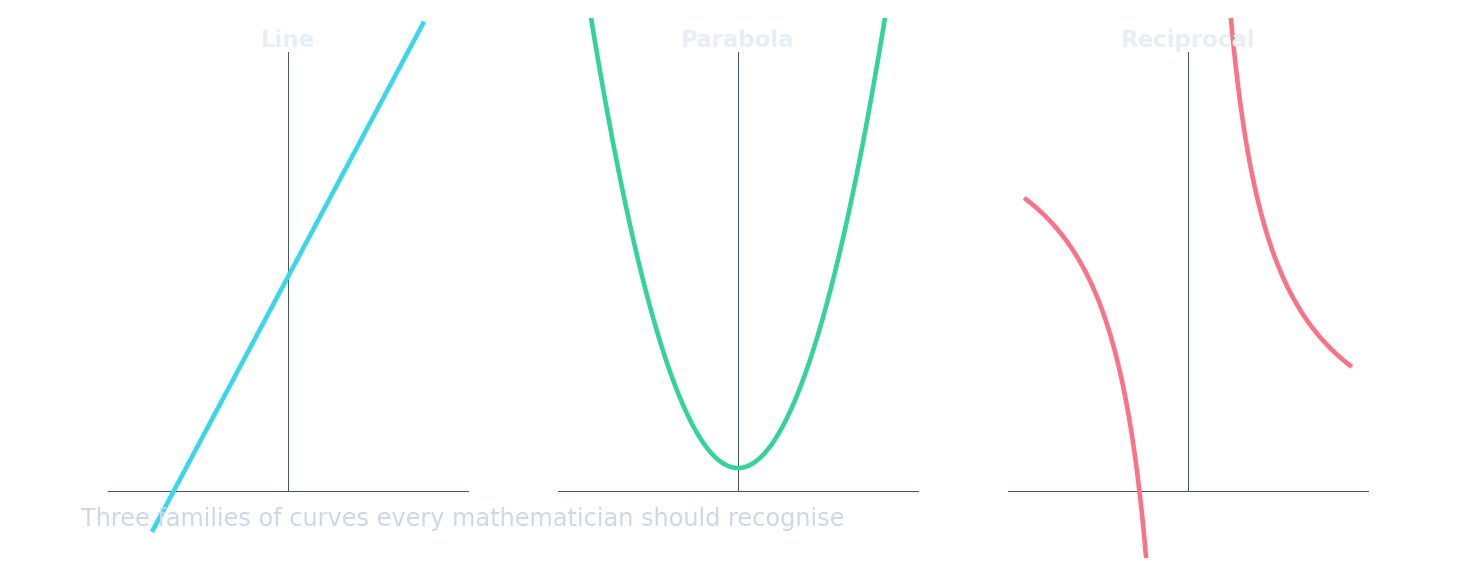
Scatter diagrams reveal patterns: positive (like a rising line), negative (like a falling line), or zero (no pattern).
산점도에서 대부분의 점이 선을 따르지만, 하나의 점은 매우 멀리 떨어져 있습니다. 이 점은 ______라고 불립니다.
난이도 1/5 · 100 코인 + 오늘 첫 완료 시 소액 보너스
이상치(outlier)는 일반적인 패턴에 맞지 않는 데이터 포인트입니다.
Plot pairs and read an estimate
- Mark each pair with a small cross, not joined points. For $(1,12),(2,15),(3,19),(4,20),(5,24)$, a sensible by-eye line is close to $y=3x+9$; it spans all the data and roughly balances the points above and below.
- At $x=3.5$, this line estimates $y=19.5$. A nearby balanced line may give a slightly different answer. Predicting at $x=20$ is extrapolation and much less secure; correlation alone does not prove cause.
직선 y = 3x + 9을 사용하여 x = 3.5일 때 y를 추정하세요.
난이도 2/5 · 140 코인 + 오늘 첫 완료 시 소액 보너스
y = 3(3.5) + 9 = 19.5.
You've got it
- positive correlation rises together; negative falls as the other rises; zero $=$ no link
- a line of best fit is one straight line through the middle of the points
- use the line to predict — but don't trust it far outside the data