Aggregate Demand and Aggregate Supply
Diperkenalkan| English | Makna |
|---|---|
| aggregate demand/ˈæɡrɪɡeɪt dɪˈmænd/ | Permintaan agregat |
| aggregate supply/ˈæɡrɪɡeɪt səˈplaɪ/ | Penawaran agregat |
| price level/praɪs ˈlevl/ | Tingkat harga |
| consumption/kənˈsʌmpʃn/ | Konsumsi |
| investment/ɪnˈvestmənt/ | Investasi |
| government spending/ˈɡʌvənmənt ˈspendɪŋ/ | Pengeluaran pemerintah |
| net exports/net ˈekspɔːts/ | Ekspor neto |
One diagram for the whole economy
- In one market, supply and demand set one price. For the whole economy, economists add up all spending and all production: aggregate demand 总需求 (AD) and aggregate supply 总供给 (AS). Where they meet sets the general price level 价格水平 and real output (real GDP).
- Almost every macroeconomic question (growth, inflation, unemployment, policy) is answered by shifting a curve on this diagram and explaining what follows.
Aggregate demand
- AD is total planned spending on a country's goods and services at each price level:
- C = consumption 消费 by households (the biggest part, about 60% in the UK); I = investment 投资 by firms in capital; G = government spending 政府支出 on goods and services; X − M = net exports 净出口. Worked example: C = 600, I = 200, G = 300, X = 150, M = 100 gives AD = 600 + 200 + 300 + 50 = 1,150.
Consumption is 300, investment 80, government spending 100, exports 70 and imports 50. What is aggregate demand?
Kesulitan 2/5 · 140 koin + bonus kecil pada penyelesaian pertama hari ini
300 + 80 + 100 + (70 − 50) = 500.
Why AD slopes downward
- Wealth effect: a higher price level lowers the real value of savings, so households spend less. Interest rate effect: higher prices raise demand for money, pushing up interest rates, which cuts C and I.
- Trade effect: if domestic prices rise faster than foreign prices, exports become less competitive and imports more attractive, so X − M falls. A change in the price level is a movement along AD; anything else that changes spending shifts it.
Match each reason AD slopes down to its explanation.
Kesulitan 2/5 · 140 koin + bonus kecil pada penyelesaian pertama hari ini
Each explains a movement along AD, not a shift.
Aggregate supply: short run and long run
- Short-run AS (SRAS) slopes upward: with wages and other costs fixed in the short run, higher prices make extra output profitable. SRAS shifts when costs change: wages, raw materials, energy, indirect taxes, import prices.
- Long-run AS (LRAS) shows the economy's productive capacity, its full-employment output. Classical economists draw it vertical; Keynesians draw it flat at low output (spare capacity), then rising, then vertical at full capacity. LRAS shifts right when the quantity or quality of resources grows: more workers, better education, more capital, new technology.
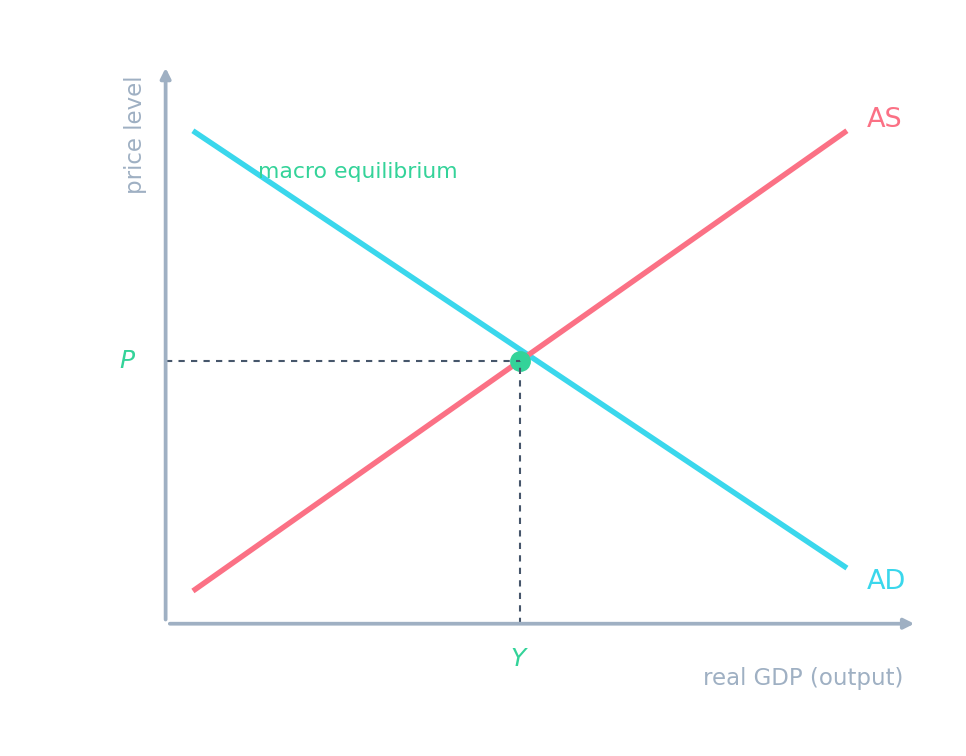
Aggregate demand & supply
AD dan AS cross at the price level and national output.
Which event shifts LRAS to the right?
Kesulitan 1/5 · 100 koin + bonus kecil pada penyelesaian pertama hari ini
LRAS shows capacity, which grows with the quantity and quality of resources. Oil prices shift SRAS; interest rates and confidence shift AD.
What shifts which curve
| Event | Curve | Direction | Effect on price level and output |
|---|---|---|---|
| Interest rates cut | AD | right | both rise |
| Consumer confidence falls | AD | left | both fall |
| Oil price rises | SRAS | left | prices rise, output falls |
| Wages fall | SRAS | right | prices fall, output rises |
| Better education and training | LRAS | right | capacity rises; output can grow without inflation |

Match each event to the curve it shifts.
Kesulitan 2/5 · 140 koin + bonus kecil pada penyelesaian pertama hari ini
Spending changes shift AD; cost changes shift SRAS; capacity changes shift LRAS.
Worked exam answer (explain, 6 marks)
Question: Explain, using an AD/AS diagram, the likely effect of a cut in interest rates on real output and the price level.
Model answer: A cut in interest rates makes borrowing cheaper and saving less rewarding, so households spend more on credit-financed goods (C rises) and firms invest more (I rises). It may also weaken the exchange rate, raising net exports. Since AD = C + I + G + (X − M), AD shifts right from AD₁ to AD₂. On the diagram, the new equilibrium has a higher price level (P₁ to P₂) and higher real output (Y₁ to Y₂). How much output rises depends on spare capacity: if the economy is near full employment, most of the effect is on prices.
- Why it scores: it explains the mechanism (cheaper borrowing → C and I), links it to the AD formula, labels the shift and both new values, and adds a condition about spare capacity.
Do not shift AD when the price level changes. A higher price level is a movement along AD. AD shifts only when one of C, I, G or X − M changes for another reason.
A rise in the price level shifts the AD curve to the left.
Kesulitan 1/5 · 100 koin + bonus kecil pada penyelesaian pertama hari ini
It is a movement along AD; only changes in C, I, G or X − M for other reasons shift it.
AD = C + I + G + (X − M) slopes down because of the wealth, interest-rate and trade effects. SRAS slopes up and shifts with costs; LRAS shows capacity and shifts with the quantity and quality of resources. Where AD meets AS sets the price level and real output. Explain every shift with its cause.
Explain, using an AD/AS diagram, the likely effect of a large rise in wages (with no rise in productivity) on real output and the price level.
Cause, shift, outcome, condition.