English
Learning Objective 1.1.A: Describe how the input and output values of a function vary together by comparing function values.
- 1.1.A.1 A function is a mathematical relation that maps a set of input values to a set of output values such that each input value is mapped to exactly one output value. The set of input values is called the domain of the function, and the set of output values is called the range of the function. The variable representing input values is called the independent variable, and the variable representing output values is called the dependent variable.
- 1.1.A.2 The input and output values of a function vary in tandem according to the function rule, which can be expressed graphically, numerically, analytically, or verbally.
- 1.1.A.3 A function is increasing over an interval of its domain if, as the input values increase, the output values always increase. That is, for all $a$ and $b$ in the interval, if $a < b$, then $f(a) < f(b)$.
- 1.1.A.4 A function is decreasing over an interval of its domain if, as the input values increase, the output values always decrease. That is, for all $a$ and $b$ in the interval, if $a < b$, then $f(a) > f(b)$.
Learning Objective 1.1.B: Construct a graph representing two quantities that vary with respect to each other in a contextual scenario.
- 1.1.B.1 The graph of a function displays a set of input-output pairs and shows how the values of the function's input and output values vary.
- 1.1.B.2 A verbal description of the way aspects of phenomena change together can be the basis for constructing a graph.
- 1.1.B.3 The graph of a function is concave up on intervals in which the rate of change is increasing.
- 1.1.B.4 The graph of a function is concave down on intervals in which the rate of change is decreasing.
- 1.1.B.5 The graph intersects the $x$-axis when the output value is zero. The corresponding input values are said to be zeros of the function.
עברית
מטרות לימוד 1.1.A: לתאר כיצד ערכי הקלט והיציאה של פונקציה משתנים יחד על ידי השוואת ערכי פונקציה.
- 1.1.A.1 פונקציה היא קשר מתמטי שמפתח קבוצה של ערכי קלט לקבוצה של ערכי יציאה כך שכל ערך קלט מופקד בדיוק לערך יציאה אחד. קבוצת ערכי הקלט נקראת תחום ההגדרה של הפונקציה, וקבוצת ערכי היציאה נקראת תחום הערכים של הפונקציה. המשתנה המייצג ערכי קלט נקרא משתנה עצמאי, והמשתנה המייצג ערכי יציאה נקרא משתנה תלוי.
- 1.1.A.2 ערכי הקלט והיציאה של פונקציה משתנים במקביל לפי חוק הפונקציה, שיכול להתבטא גרפית, מספרית, אנליטית או מילולית.
- 1.1.A.3 פונקציה היא עולה בעברן בתחום ההגדרה שלה אם, ככל שערכי הקלט גדלים, ערכי היציאה תמיד גדלים. כלומר, עבור כל $a$ ו-$b$ בעברן, אם $a < b$, אזי $f(a) < f(b)$.
- 1.1.A.4 פונקציה היא יורדת בעברן בתחום ההגדרה שלה אם, ככל שערכי הקלט גדלים, ערכי היציאה תמיד יורדים. כלומר, עבור כל $a$ ו-$b$ בעברן, אם $a < b$, אזי $f(a) > f(b)$.
מטרות לימוד 1.1.B: לבנות גרף המייצג שני גדלים המשתנים זה ביחס לזה בתרחיש הקשרי.
- 1.1.B.1 הגרף של פונקציה מציג סדרת זוגות קלט-יציאה ומראה כיצד ערכי הקלט והיציאה של הפונקציה משתנים.
- 1.1.B.2 תיאור מילולי של אופן השינוי המקביל של היבטים של תופעות יכול לשמש בסיס לבניית גרף.
- 1.1.B.3 הגרף של פונקציה הוא קעור כלפי מעלה בתחומים שבהם קצב השינוי עולה.
- 1.1.B.4 הגרף של פונקציה הוא קעור כלפי מטה בתחומים שבהם קצב השינוי יורד.
- 1.1.B.5 הגרף חותך את ציר ה-$x$ כאשר ערך הפלט הוא אפס. ערכי הקלט המתאימים נקראים אפסים של הפונקציה.
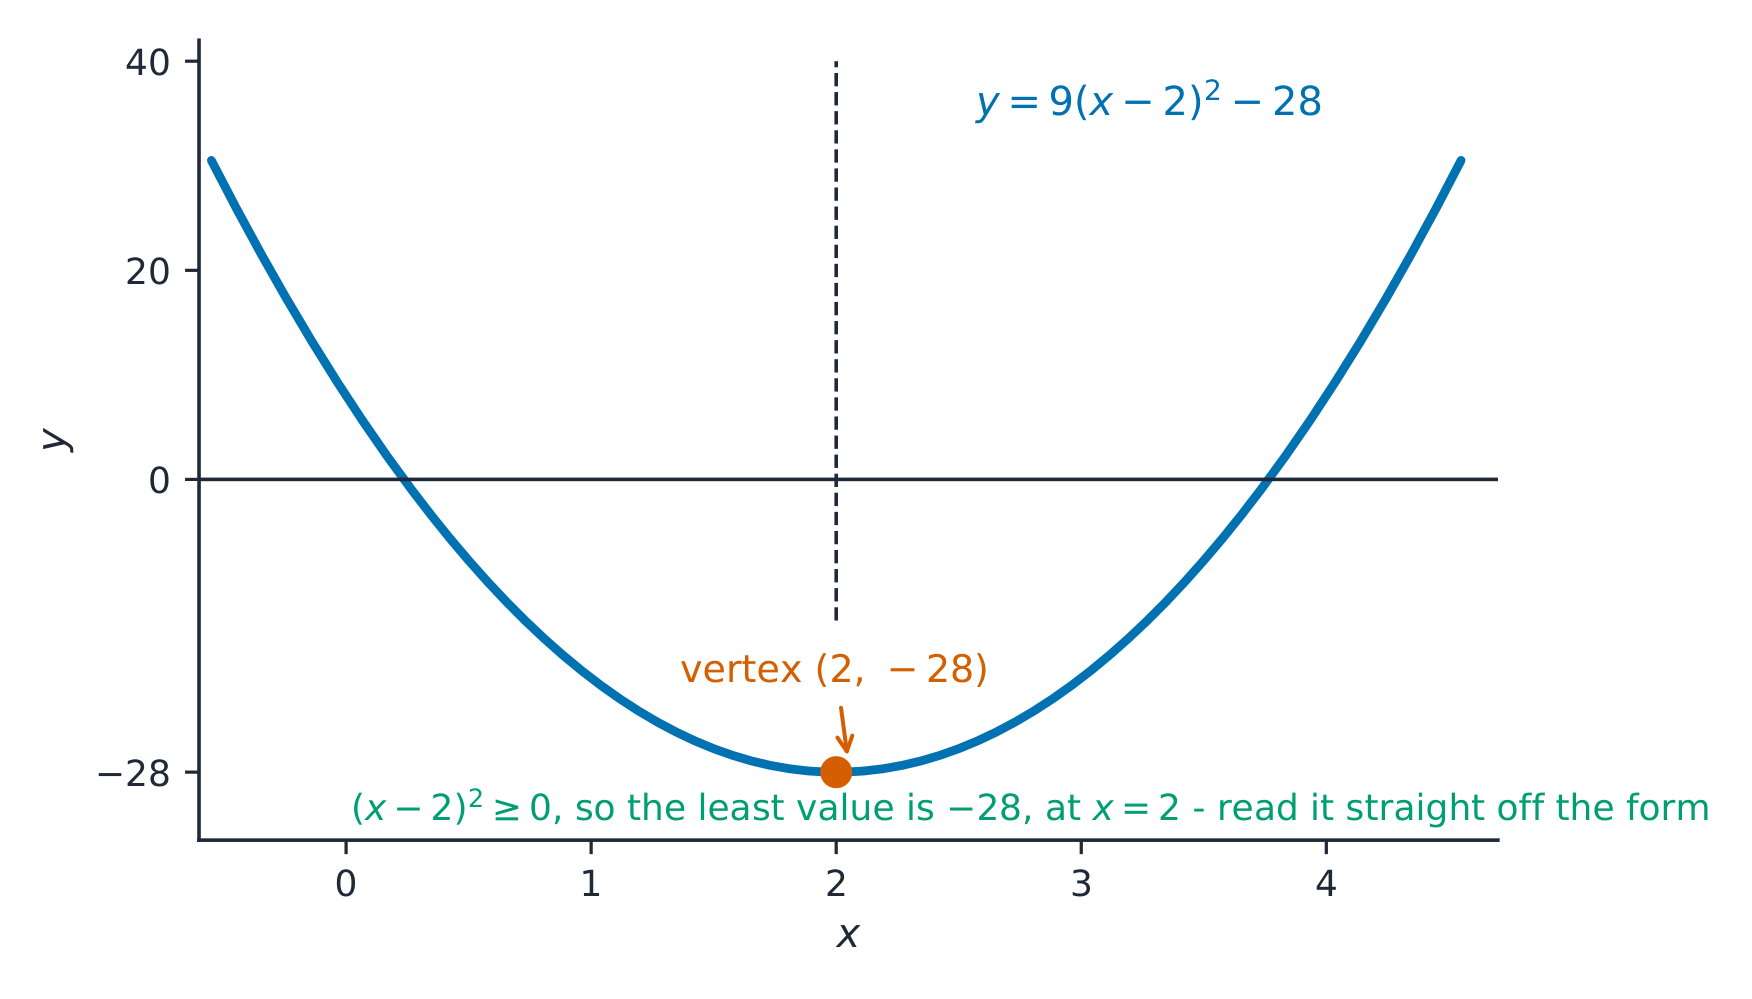
 כבל גשר תלוי לוקח צורה של עקומה דמוי פרבולה — ריבועית שניתן לראות בברזל,