Votre plan d'apprentissage · Continuer · Réviser →
Task 1 — sélectionner, rapporter et rédiger la vue d'ensemble
IntroduitVotre position enregistrée reste dans ce navigateur. Reprendre ne termine pas la leçon ni ne répond à ses questions.
A bigger share doesn't mean more journeys
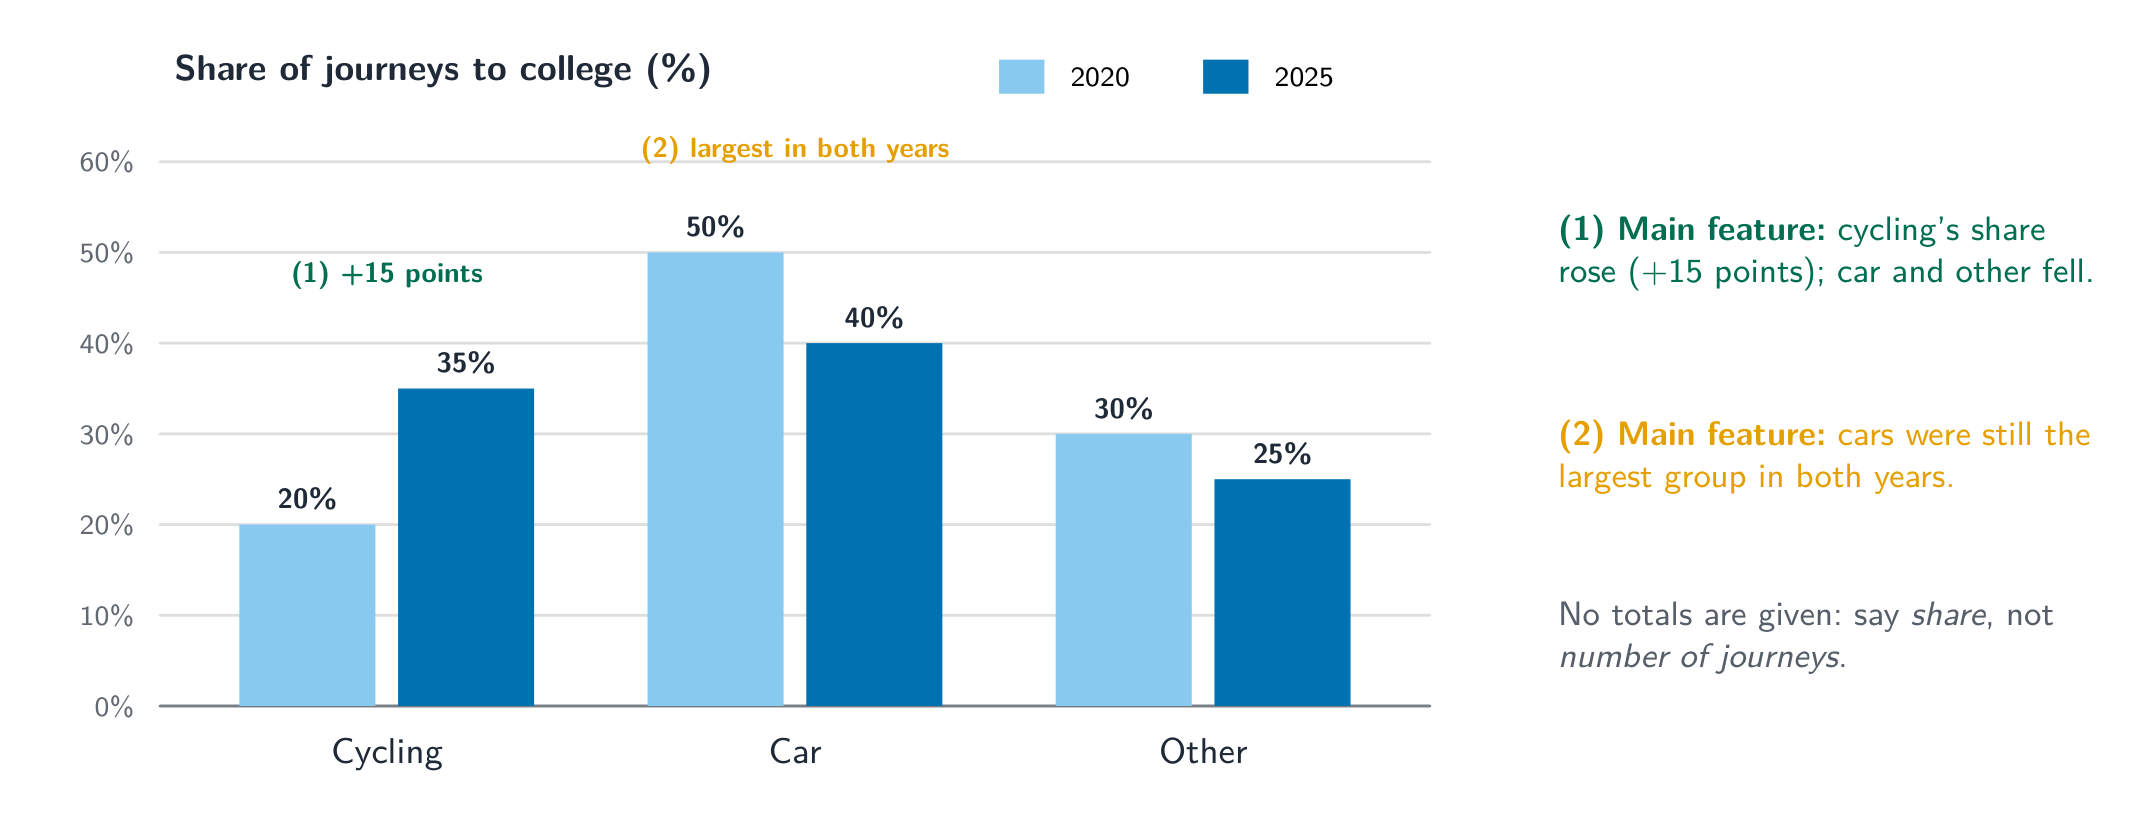
- Goal: choose the main features, group accurate comparisons, and write and revise a connected report. Start with Academic Writing orientation and the writing criteria. A survey: cycling 20% in 2020 → 35% in 2025; cars 50% → 40%; other travel 30% → 25%. Cycling gained share, the others lost share, and cars stayed the largest group.
- The totals aren't given, so you can't say the number of cycling journeys rose — or that a new cycle lane caused anything. A percentage knows its share of the pie, but not how big the whole pie was.
Dans Task 1, vous devriez expliquer pourquoi la tendance s'est produite.
Difficulté 1/5 · 100 pièces + un petit bonus lors de la première réussite aujourd'hui
Report what the visual information supports. An invented cause is unsupported and takes space from the task; no single sentence establishes an automatic score cap.
The overview: the main picture in one or two sentences
- Cycling gained share while the other categories declined, although cars remained the most common choice. That's an overview: it sums up the patterns. Cycling was 20% in 2020 is a detail that supports it.
- What counts as a main feature depends on the visual: the biggest category, the largest change, a crossover, or something that stayed the same. Don't invent a crossover if there isn't one.
In a visual with an important overall movement and a major line crossover, which features could be selected for the overview? Choose all that apply.
Difficulté 2/5 · 140 pièces + un petit bonus lors de la première réussite aujourd'hui
An overview selects the main patterns, such as the largest category or a major change. Supporting figures belong mainly in the detail paragraphs; avoid invented causes or opinions.
Group the details around comparisons
- A clear shape: say what the visual shows, give the overview, then two paragraphs of grouped details. Here: one paragraph for the rising cycling share, one for the falling ones, each with its numbers.
- That shape is common, not compulsory. Another visual may need a different organisation. What doesn't work is listing every number in the order it appears — the reader loses the relationships.
Put this suggested Task 1 plan in a useful order.
Difficulté 3/5 · 200 pièces + un petit bonus lors de la première réussite aujourd'hui
This plan introduces the visual, summarises its main picture and develops grouped details. It is one usable structure, not a mandatory paragraph or overview placement rule.
Check the labels before claiming an amount
- Housing took 26% of income, then 38%. That's a larger share — not necessarily more money, because income may have changed too. With only percentages, keep your claims about shares.
- Pie charts can show counts, amounts or percentages, so read the labels and units. When the visual gives amounts, use them.
A percentage-only housing comparison rises from 26% to 38% of income; total incomes are not given. Which sentence is supported?
Difficulté 1/5 · 100 pièces + un petit bonus lors de la première réussite aujourd'hui
The given percentages establish a larger share. Amount spent also depends on total income. A pie chart may show other units, so read its actual labels rather than generalising from its shape.
A diagram explicitly labels 120 bottles before sorting. What supports reporting that quantity?
Difficulté 1/5 · 100 pièces + un petit bonus lors de la première réussite aujourd'hui
The diagram supplies the count. Process information can include quantities, temperatures and durations.
Processes and maps: describe what is labelled
- A process diagram may give temperatures, times or quantities as well as stages. Heat water to 80°C, then filter it → include the temperature and the order. Use the passive when who does it doesn't matter, the active when a named person or machine does.
- Maps may show past, present or planned layouts. Choose the tense from the date and status: In the proposed plan, the entrance will move east — it hasn't moved yet. Never add features the map doesn't show.
Réécrivez à la voix passive : « People collect the bottles. » → « The bottles ___ collected. »
Difficulté 1/5 · 100 pièces + un petit bonus lors de la première réussite aujourd'hui
Are collected is the present passive form. It fits when the collection stage matters more than the actor; other process descriptions may appropriately use active verbs.
A map labels an eastern entrance as a proposed future change. Which description preserves that status?
Difficulté 1/5 · 100 pièces + un petit bonus lors de la première réussite aujourd'hui
The proposal is a future layout. Do not claim that it has already been built.
Make every detail match the data
- Cycling rose by 15 percentage points, to 35%; cars fell by 10 points, to 40%. These details support the overview and keep the correct units.
- Format checked on 19 October 2026: IELTS Academic Writing format. The survey, process and map examples are our own.
- Choose the main picture, support it with accurate details, and keep every claim inside the data.
Match the distinctions in this worked case.
Difficulté 2/5 · 140 pièces + un petit bonus lors de la première réussite aujourd'hui
Detail: cycling rose by 15 percentage points to 35%, while cars fell by 10 points to 40%. Both descriptions select comparisons from the same values without inventing a cause.
Which category has the largest share in 2025?
Difficulté 1/5 · 100 pièces + un petit bonus lors de la première réussite aujourd'hui
Original data: cycle share is 20% in 2020 and 35% in 2025; car share is 50% and 40%; other travel is 30% and 25%. Overview: cycling rose while the other two shares fell; cars remained the largest category. Detail: cycling rose by 15 percentage points to 35%, while cars fell by 10 points to 40%. Both descriptions select comparisons from the same values without inventing a cause.
Cycling shares of 20% and 35% do not show whether the number of cycling journeys rose unless the totals are known.
Difficulté 1/5 · 100 pièces + un petit bonus lors de la première réussite aujourd'hui
True. Counts need totals as well as shares; a smaller total could give the same or fewer journeys at 35%.
Different measures, different leaders
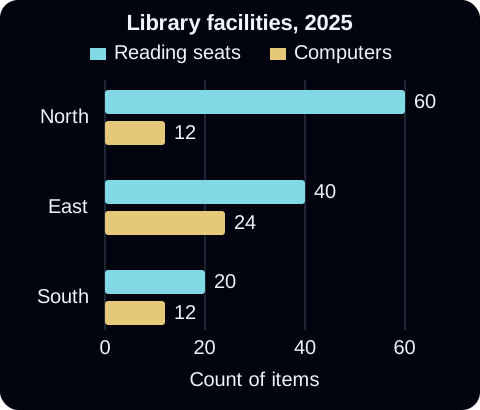
- One year, two measures. The chart below shows reading seats and computers at three libraries in 2025. North had the most facilities in every category misreads it. Better: North had the most reading seats, whereas East had the most computers; South had the fewest seats — with 60 seats at North, 24 computers at East, and 12 computers at both North and South. It's one year, so increased would invent a trend.
- Different units. A museum had 80,000 visits and £320,000 income in 2019, then 120,000 visits and £360,000 in 2024. Both rose by the same amount compares unlike units. Better: Both increased, but visits grew proportionally more — visits +50%, income +12.5%. Income per visit fell from £4 to £3, but that's an average you calculated, not a ticket price. A confident adjective cannot rescue the wrong denominator; it only makes the error stand taller.

Guided decisions: ten visuals with hints
- For each visual, first note the measure, unit, dates and any projection; then decide what belongs in the overview. Compare the start and end separately from the middle points: the same start and end value doesn't mean nothing changed in between.
- These are short decisions about what to write, not ten full reports. After each one, fix the exact problem the explanation names: wrong column, invented cause, wrong base, or a time claim the data doesn't support.
Données pédagogiques originales — passagers du ferry fluvial :
| Année | Passagers (milliers) |
|---|---|
| 2018 | 40 |
| 2020 | 55 |
| 2022 | 48 |
| 2024 | 70 |
Décision : Quelle vue d'ensemble préserve le motif échantillonné ?
Choisissez UNE seule réponse.
Indice de planification : Comparez les extrémités, puis vérifiez les valeurs intermédiaires.
Difficulté 1/5 · 100 pièces + un petit bonus lors de la première réussite aujourd'hui
Les extrémités augmentent de 40 à 70, mais 55 chute vers 48 avant la hausse finale. Un doublement exigerait 80. Aucune donnée sur les prix des billets n'est fournie. Une vue d'ensemble peut inclure le mouvement global et son interruption importante.
Données pédagogiques originales — trois centres sportifs à 2024 :
| Centre | Visites (milliers) |
|---|---|
| Elm | 90 |
| Pine | 60 |
| Oak | 30 |
Décision : Quelle est une comparaison principale appropriée ?
Choisissez UNE seule réponse.
Indice de planification : Une comparaison à date unique donne un classement, pas une tendance.
Difficulté 1/5 · 100 pièces + un petit bonus lors de la première réussite aujourd'hui
L'orme mène 90 à 60 à 30, et 90 est trois fois 30. Une année ne montre ni changement ni vitesse de croissance. Le pin représente deux tiers de l'orme, tandis que le chêne en représente un tiers.
Données d'enseignement originales — parts énergétiques domestiques :
| Source | 2015 (%) | 2025 (%) |
|---|---|---|
| Gaz | 60 | 45 |
| Électricité | 30 | 40 |
| Autre | 10 | 15 |
Décision : Quelle affirmation de changement est exacte ?
Choisissez UNE réponse.
Indice de planification : Gardez « by », « to » et l'unité séparés.
Difficulté 1/5 · 100 pièces + un petit bonus lors de la première réussite aujourd'hui
60 moins 45 équivaut à 15 points de pourcentage ; l'extrémité est 45 %. Aucun total ou unité énergétique n'est fourni. Une baisse relative correspond à 15/60 = 25 %, et non à 15 %.
Données d'enseignement originales — participation au club de lecture :
| Année | Membres | Part participant hebdomadairement (%) |
|---|---|---|
| 2020 | 200 | 40 |
| 2025 | 100 | 60 |
Décision : Que peut-on dire des participants hebdomadaires ?
Choisissez UNE réponse.
Indice de planification : Multipliez chaque part par le total de l'année correspondante.
Difficulté 1/5 · 100 pièces + un petit bonus lors de la première réussite aujourd'hui
40 % de 200 donne 80 ; 60 % de 100 donne 60. La part augmente de 20 points alors que le nombre diminue. Les totaux donnés permettent ce calcul ; ne pas laisser un nombre incalculable lorsque les données nécessaires sont présentes.
Données d'enseignement originales — installations de bibliothèque à 2025 :
| Bibliothèque | Places de lecture | Ordinateurs |
|---|---|---|
| Nord | 60 | 12 |
| Est | 40 | 24 |
| Sud | 20 | 12 |
Décision : Quelle vue d'ensemble couvre les deux mesures ?
Choisissez UNE réponse.
Indice de planification : Un leader dans une colonne n'est pas nécessairement leader dans l'autre.
Difficulté 1/5 · 100 pièces + un petit bonus lors de la première réussite aujourd'hui
Le Nord obtient 60 places ; l'Est obtient 24 ordinateurs. La taille du bâtiment n'est pas mesurée, et le Sud diffère de l'Est dans les deux comptages. Conserver chaque classement attaché à sa mesure.
Données d'enseignement originales — visites muséales et revenus :
| Année | Visites (milliers) | Revenu total (£ milliers) |
|---|---|---|
| 2019 | 80 | 320 |
| 2024 | 120 | 360 |
Décision : Quelle comparaison principale est étayée ?
Choisissez UNE seule réponse.
Indice de planification : Comparez la variation relative au sein de chaque mesure ; ne comparez pas les différences brutes inégales.
Difficulté 1/5 · 100 pièces + un petit bonus lors de la première réussite aujourd'hui
Les visites augmentent de 40/80 = 50% ; le revenu augmente de 40/320 = 12.5%. Les différences numériques égales ont des unités et des bases différentes. Le revenu par visite passerait de £4 à £3, mais le revenu total ne permet pas d'identifier le prix du billet.
Données d'enseignement originales — adhésion studio :
| Année | Membres |
|---|---|
| 2010 | 80 |
| 2015 | 120 |
| 2020 | 100 |
Décision : Quelle phrase évite d'inventer des observations ?
Choisissez UNE seule réponse.
Indice de planification : Limitez une affirmation sur un pic à la période et aux observations fournies.
Difficulté 1/5 · 100 pièces + un petit bonus lors de la première réussite aujourd'hui
120 est la valeur affichée la plus élevée ; 100 reste au-dessus de 80. Les années non enregistrées et l'histoire antérieure sont inconnues. Il y a une hausse puis une baisse sur les intervalles montrés, pas une diminution continue.
Données d'enseignement originales — catégories de trajet domicile-travail :
| Mode | 2020 (%) | 2025 (%) |
|---|---|---|
| Bus | 40 | 30 |
| Rail | 20 | 30 |
| Marche | 25 | 25 |
| Autre | 15 | 15 |
Décision : Quel regroupement offre un plan de rapport utile ?
Choisissez UNE seule réponse.
Indice de planification : Regroupez des relations significatives, tout en conservant les caractéristiques stables importantes.
Difficulté 1/5 · 100 pièces + un petit bonus lors de la première réussite aujourd'hui
Le bus diminue et le rail augmente, se rencontrant à 30%; la marche et l'autre restent constants. Ces groupes conservent les modèles clés. Bus plus rail représente 60% dans les deux années, mais les données n'attribuent pas le changement à une politique. Le bus et le rail évoluent en sens opposés, donc les regrouper comme augmentant tous deux est inexact.
Données d'enseignement originales — estimations de consommation d'eau :
| Année | Litres observés par foyer par jour | Litres projetés par foyer par jour |
|---|---|---|
| 2020 | 180 | — |
| 2025 | 160 | — |
| 2030 | — | 140 |
Décision : Quelle description préserve le statut ?
Choisissez UNE seule réponse.
Indice de planification : Lisez les étiquettes observées/projetées avant de choisir le temps verbal.
Difficulté 1/5 · 100 pièces + un petit bonus lors de la première réussite aujourd'hui
160 est la valeur observée pour 2025 ; 140 est une projection pour la moyenne d'un foyer en 2030. Une projection n'est ni un résultat observé ni une garantie exacte pour chaque foyer.
Données d'enseignement originales — deux enquêtes indépendantes auprès de visiteurs :
| Lieu | Visiteurs interrogés | Part préférant l'entrée du soir (%) |
|---|---|---|
| Galerie | 100 | 60 |
| Jardin | 200 | 40 |
Décision : Quelle comparaison est exacte ?
Choisissez UNE seule réponse.
Indice de planification : Calculez les effectifs avant de comparer des échantillons de tailles inégales.
Difficulté 1/5 · 100 pièces + un petit bonus lors de la première réussite aujourd'hui
Galerie : 60 sur 100 ; jardin : 80 sur 200. La première part est plus élevée, mais son effectif est plus faible. La part combinée est de 140/300, et non de 60+40%. Des bases d'enquête différentes ne peuvent pas être additionnées comme un seul pourcentage.
Independent decisions: twenty new visuals
- No hints now. Some compare places in one year; others compare times, proportions, rates or mixed measures. Keep what is actually measured: visits can include repeat visitors, an index is not a count, and sales in current prices don't show growth after inflation.
- Choose the best answer, then say why the others distort the data. You can split this over several sessions — keep a short list of the mistakes you need to fix.
Données d'enseignement originales — trajets en bus portuaire :
| Année | Trajets (millions) |
|---|---|
| 2016 | 12 |
| 2019 | 18 |
| 2022 | 15 |
| 2025 | 21 |
Décision : Quel aperçu correspond à toutes les observations ?
Choisissez UNE seule réponse.
Difficulté 1/5 · 100 pièces + un petit bonus lors de la première réussite aujourd'hui
21 dépasse 12, tandis que 18 chute vers 15 avant la hausse finale. Doubler 12 donnerait 24, et le niveau final est supérieur au départ. Vérifiez les points intermédiaires avant d'utiliser « sans interruption ».
Données d'enseignement originales — trois galeries à 2023 :
| Galerie | Expositions |
|---|---|
| Cèdre | 12 |
| Bouleau | 8 |
| Saule | 4 |
Décision : Quelle comparaison est étayée ?
Choisissez UNE seule réponse.
Difficulté 1/5 · 100 pièces + un petit bonus lors de la première réussite aujourd'hui
12 est trois fois 4. Une seule année fournit un ratio inter-galerie, pas une variation intra-galerie ou une perte antérieure. Le bouleau a deux tiers du compte du cèdre, et non le double.
Données d'enseignement originales — parts des dépenses ménagères :
| Catégorie | 2014 (%) | 2024 (%) |
|---|---|---|
| Logement | 25 | 40 |
| Nourriture | 35 | 25 |
| Autres | 40 | 35 |
Décision : Quelle phrase utilise la bonne unité de changement ?
Choisissez UNE réponse.
Difficulté 1/5 · 100 pièces + un petit bonus lors de la première réussite aujourd'hui
40 moins 25 équivaut à 15 points de pourcentage. L'augmentation relative est 15/25 = 60%; les totaux monétaires sont absents. La nouvelle part est 40%, et non 15%.
Données d'enseignement originales — inscriptions et présence au club :
| Année | Inscriptions | Part de présence hebdomadaire (%) |
|---|---|---|
| 2019 | 300 | 20 |
| 2024 | 200 | 40 |
Décision : Quelle conclusion découle de ces données ?
Choisissez UNE réponse.
Difficulté 1/5 · 100 pièces + un petit bonus lors de la première réussite aujourd'hui
300×20% = 60 et 200×40% = 80. La part augmente de 20 points de pourcentage, équivalent à un doublement de cette part. Les deux dénominateurs sont donnés, il faut donc calculer avant de déterminer la tendance du nombre de participants.
Données d'enseignement originales — trois centres d'apprentissage à 2025 :
| Centre | Places d'étude | Tablettes |
|---|---|---|
| Ouest | 90 | 15 |
| Central | 60 | 30 |
| Rivière | 30 | 15 |
Décision : Quelle vue d'ensemble conserve les classements principaux ?
Choisissez UNE réponse.
Difficulté 1/5 · 100 pièces + un petit bonus lors de la première réussite aujourd'hui
90 est le plus grand nombre de sièges, tandis que 30 est le plus grand nombre de tablettes. River et West possèdent toutes deux 15 tablettes. La surface du bâtiment n'est pas fournie. Évitez de remplacer deux classements spécifiques par une affirmation non fondée sur la taille globale.
Données d'enseignement originales — spectateurs et recettes de théâtre :
| Année | Fréquentations (milliers) | Recettes totales (£ milliers) |
|---|---|---|
| 2018 | 50 | 250 |
| 2024 | 75 | 300 |
Décision : Quelle synthèse compare correctement la croissance ?
Choisissez UNE seule réponse.
Difficulté 1/5 · 100 pièces + un petit bonus lors de la première réussite aujourd'hui
25/50 = 50 % ; 50/250 = 20 %. Le revenu par visiteur baisse de £5 à £4, mais les recettes ne sont pas étiquetées comme un seul revenu ticket, donc le prix du billet ne peut pas être déduit. Conservez le numérateur, le dénominateur et la mesure de revenus déclarée.
Données d'enseignement originales — comptage des bateaux de canal :
| Année | Bateaux |
|---|---|
| 2005 | 70 |
| 2010 | 110 |
| 2015 | 90 |
Décision : Quelle phrase limite appropriément l'affirmation ?
Choisissez UNE seule réponse.
Difficulté 1/5 · 100 pièces + un petit bonus lors de la première réussite aujourd'hui
110 est le plus grand total affiché. L'histoire entière et les années intermédiaires sont absentes ; le premier intervalle enregistré passe de 70 à 110. Restreignez une affirmation de pic aux preuves réellement disponibles.
Données d'enseignement originales — parts de loisirs :
| Activité | 2015 (%) | 2025 (%) |
|---|---|---|
| Lecture | 30 | 20 |
| Jeux vidéo | 20 | 30 |
| Sport | 25 | 25 |
| Autres | 25 | 25 |
Décision : Quel plan détaillé est le plus utile ?
Choisissez UNE seule réponse.
Difficulté 1/5 · 100 pièces + un petit bonus lors de la première réussite aujourd'hui
La lecture et les jeux vidéo échangent leurs positions, tandis que le sport et les autres restent égaux et inchangés. Un regroupement significatif montre ces relations ; une catégorie isolée la plus petite les manque. Les données n'identifient pas les changements individuels ni leurs causes.
Données d'enseignement originales — consommation électrique des entrepôts :
| Année | Statut | kWh par mètre carré |
|---|---|---|
| 2020 | Observé | 100 |
| 2025 | Observé | 80 |
| 2030 | Projeté | 70 |
Décision : Quelle description est exacte ?
Choisissez UNE seule réponse.
Difficulté 1/5 · 100 pièces + un petit bonus lors de la première réussite aujourd'hui
La mesure correspond à l'électricité par unité de surface, et non à une facture ou à une consommation totale. Seuls 2020/2025 sont observés ; 2030 est projeté. Une valeur par surface ne signifie pas un total identique pour chaque bâtiment.
Données d'enseignement originales — deux enquêtes de cours :
| Cours | Répondants | Part satisfait(e)s (%) |
|---|---|---|
| Art | 80 | 75 |
| Musique | 200 | 50 |
Décision : Quelle comparaison prend en compte les deux tailles d'échantillon ?
Choisissez UNE seule réponse.
Difficulté 1/5 · 100 pièces + un petit bonus lors de la première réussite aujourd'hui
L'Art compte 80×75% = 60 répondants satisfaits ; la Musique compte 200×50% = 100. Les parts ne peuvent pas s'additionner entre des échantillons différents. Comparez les effectifs et les proportions séparément.
Données d'enseignement originales — production régionale :
| Année | Indice de production (2010 = 100) |
|---|---|
| 2010 | 100 |
| 2020 | 150 |
Décision : Quelle description respecte l'indice ?
Choisissez UNE seule réponse.
Difficulté 1/5 · 100 pièces + un petit bonus lors de la première réussite aujourd'hui
Un indice exprime un changement par rapport à une base, pas un nombre de produits ni un total monétaire. Le gain est 50/100 = 50%, pas 150%. Conservez l'étiquette de l'année de base dans une introduction.
Données d'enseignement originales — précipitations mensuelles sur trois sites :
| Site | Pluies en juin (mm) |
|---|---|
| Colline | 120 |
| Côte | 80 |
| Vallée | 40 |
Décision : Quelle vue d'ensemble évite toute explication non justifiée ?
Choisissez UNE seule réponse.
Difficulté 1/5 · 100 pièces + un petit bonus lors de la première réussite aujourd'hui
Le tableau classe trois relevés de juin. Les autres mois, les causes météorologiques et l'évolution temporelle ne sont pas affichés. Une comparaison statique peut être claire sans inventer une tendance ou une cause.
Données d'enseignement originales — parts des origines des visiteurs :
| Origine | 2020 (%) | 2025 (%) |
|---|---|---|
| Local | 50 | 50 |
| Ailleurs dans le pays | 30 | 35 |
| Étranger | 20 | 15 |
Décision : Quelle caractéristique principale est soutenue ?
Choisissez UNE réponse.
Difficulté 1/5 · 100 pièces + un petit bonus lors de la première réussite aujourd'hui
La part locale reste à 50%; la part nationale non locale passe de 30 à 35 et l'étrangère diminue de 20 à 15. Les totaux étant absents, une part locale stable n'implique pas un nombre stable. L'étranger est bien inférieur à la moitié.
Données d'enseignement originales — catégories de recyclage distinctes :
| Matériau | Collecté (tonnes) |
|---|---|
| Papier | 40 |
| Verre | 30 |
| Métal | 20 |
Décision : La note précise que d'autres matériaux sont omis. Quelle affirmation est sûre ?
Choisissez UNE réponse.
Difficulté 1/5 · 100 pièces + un petit bonus lors de la première réussite aujourd'hui
Le papier domine les catégories affichées. Leur somme est de 90 tonnes, mais les catégories omises rendent le total global inconnu. Ni un pourcentage de tous les matériaux ni l'absence de plastique ne découlent de ce tableau sélectionné.
Données d'enseignement originales — catégories de possession de vélos :
| Ménages | 2015 (%) | 2025 (%) |
|---|---|---|
| Aucun vélo | 40 | 20 |
| Un vélo | 40 | 40 |
| Deux ou plus | 20 | 40 |
Décision : Quel aperçu distingue les catégories de ménages des comptes de vélos ?
Choisissez UNE réponse.
Difficulté 1/5 · 100 pièces + un petit bonus lors de la première réussite aujourd'hui
La part sans vélo diminue de moitié de 40 à 20 ; celle de deux vélos ou plus double de 20 à 40. La catégorie ouverte et les totaux de foyers inconnus empêchent un décompte exact des vélos. La part avec un seul vélo reste à 40%.
Données pédagogiques originales — observations sur la profondeur d'étang :
| Mois | Profondeur (mètres) |
|---|---|
| Janvier | 2 |
| Avril | 3 |
| Juillet | 2.5 |
| Octobre | 2 |
Décision : Quelle vue d'ensemble est exacte ?
Choisissez UNE seule réponse.
Difficulté 1/5 · 100 pièces + un petit bonus lors de la première réussite aujourd'hui
Des extrémités égales n'annulent pas la hausse jusqu'à 3 suivie des baisses ultérieures. De janvier à avril, l'augmentation représente 50 %, et non un doublement. Il faut rendre compte du motif intermédiaire ainsi que de l'extrémité inchangée.
Données pédagogiques originales — ventes d'une entreprise en prix courants :
| Année | Ventes nominales (£ milliers) |
|---|---|
| 2020 | 200 |
| 2025 | 240 |
Décision : Quelle affirmation respecte la mesure fournie ?
Choisissez UNE seule réponse.
Difficulté 1/5 · 100 pièces + un petit bonus lors de la première réussite aujourd'hui
40/200 = 20 % de croissance nominale. Sans information sur les prix ou les volumes, il est impossible de dissocier la croissance réelle, le nombre d'articles et la variation de prix. Conservez la qualification « en prix courants » plutôt que de rapporter silencieusement une augmentation réelle.
Données pédagogiques originales — deux lignes de production :
| Ligne | Unités par heure | Heures d'exploitation |
|---|---|---|
| A | 30 | 4 |
| B | 20 | 8 |
Décision : Quelle comparaison distingue correctement le taux de la quantité produite ?
Choisissez UNE seule réponse.
Difficulté 1/5 · 100 pièces + un petit bonus lors de la première réussite aujourd'hui
La ligne A produit 30 × 4 = 120 unités ; la ligne B produit 20 × 8 = 160. La ligne A est plus rapide par heure, tandis que la durée d'exploitation plus longue de la ligne B génère une production totale supérieure. N'ajoutez pas les taux pour obtenir un total.
Données pédagogiques originales — utilisation d'Internet par groupe d'âge en 2025 :
| Groupe d'âge | Part utilisant Internet (%) |
|---|---|
| 18–29 | 95 |
| 30–49 | 90 |
| 50–69 | 70 |
Décision : Quelle affirmation décrit correctement une coupe transversale ?
Choisissez UNE seule réponse.
Difficulté 1/5 · 100 pièces + un petit bonus lors de la première réussite aujourd'hui
Le tableau annuel compare des groupes, pas les mêmes personnes sur une période. Il fournit des pourcentages plutôt que des effectifs par groupe. Un modèle transversal par âge n'établit pas une évolution individuelle ni une augmentation annuelle.
Données d'enseignement originales — trajets annuels en bus et en train :
| Année | Bus (millions) | Train (millions) |
|---|---|---|
| 2015 | 30 | 20 |
| 2020 | 25 | 25 |
| 2025 | 20 | 30 |
Décision : Quelle vue d'ensemble reflète la relation changeante ?
Choisissez UNE seule réponse.
Difficulté 1/5 · 100 pièces + un petit bonus lors de la première réussite aujourd'hui
Le bus évolue de 30→25→20 tandis que le train évolue de 20→25→30. L'égalité se produit à l'observation montrée en 2020 et le classement final s'inverse. Le ratio final est 30/20 = 1.5, et non 2. N'inventez pas de date de croisement non observée.
One table, three decisions
- Three questions use one library-loans table: choose an overview, choose supporting details, and spot an unsupported addition. Reread the units and dates for each question.
- A good report doesn't calculate every possible ratio. Choose the comparisons that show the main pattern, keep the overview consistent with them, and leave out explanations the table doesn't give. Next, you write the report yourself.
Données d'enseignement originales — emprunts à la bibliothèque Marsh (source partagée) :
| Année | Emprunts numériques (milliers) | Emprunts imprimés (milliers) |
|---|---|---|
| 2016 | 20 | 80 |
| 2020 | 40 | 70 |
| 2024 | 60 | 60 |
Décision : Quelle vue d'ensemble couvre la relation principale ?
Choisissez UNE seule réponse.
Difficulté 1/5 · 100 pièces + un petit bonus lors de la première réussite aujourd'hui
Le numérique progresse 20→40→60 ; le papier diminue 80→70→60. Leurs totaux finaux sont égaux ; les totaux combinés sont 100, 110 et 120, donc non constants. Il s'agit d'une source commune utilisée pour trois décisions de planification.
Données d'enseignement originales — emprunts à la bibliothèque Marsh (source partagée) :
| Année | Emprunts numériques (milliers) | Emprunts imprimés (milliers) |
|---|---|---|
| 2016 | 20 | 80 |
| 2020 | 40 | 70 |
| 2024 | 60 | 60 |
Décision : Quel détail étaye cette vue d'ensemble ?
Choisissez UNE seule réponse.
Difficulté 1/5 · 100 pièces + un petit bonus lors de la première réussite aujourd'hui
80−20 = 60 milliers ; final 60−60 = 0. La part numérique passe de 20/100 = 20% à 60/120 = 50%, soit une variation de 30 points. Le nombre de prêts numériques augmente de 40/20 = 200%, tandis que les prêts imprimés diminuent. Conserver séparément les comptes et les parts.
Données d'enseignement originales — Prêts de la bibliothèque Marsh (source partagée) :
| Année | Prêts numériques (milliers) | Prêts imprimés (milliers) |
|---|---|---|
| 2016 | 20 | 80 |
| 2020 | 40 | 70 |
| 2024 | 60 | 60 |
Décision : Quelle phrase proposée doit être supprimée en raison d'un manque de preuves ?
Choisissez UNE seule réponse.
Difficulté 1/5 · 100 pièces + un petit bonus lors de la première réussite aujourd'hui
Aucune application ou cause n'est fournie. Tripler 20 donne 60 ; les prêts imprimés baissent de 80−60 = 20 ; le total augmente de 100→120. Les autres affirmations sont valides, bien qu'un rapport doive tout de même sélectionner et regrouper plutôt que lister tout.
Write a full report: the ferry table
- Write your own report on the ferry table before you look at the models. The real task asks for at least 150 words in about 20 minutes. Practise untimed first if you like, then try it timed. Plan in notes; write in paragraphs.
- Then compare the weaker and the improved model. Check what each paragraph does and whether every statement matches the table. Fix one selection, grouping or accuracy problem in your own report. Your draft stays only on this page, so copy it if you want to keep it.
Données d'enseignement originales pour la Tâche Académique 1 — Voyages annuels de passagers en millions, trois lignes de ferry, 2010–2025 :
| Année | Route Nord | Route Est | Route Sud |
|---|---|---|---|
| 2010 | 60 | 30 | 20 |
| 2015 | 55 | 40 | 20 |
| 2020 | 45 | 50 | 25 |
| 2025 | 40 | 60 | 30 |
Rédigez au moins 150 mots en prose continue. Résumez les caractéristiques principales et effectuez des comparaisons pertinentes. Rédigez un brouillon avant d'ouvrir les modèles, puis corrigez une faiblesse concernant une caractéristique principale, une preuve ou une organisation. Cette page locale ne note pas ni ne force automatiquement la longueur. Votre brouillon reste sur cette page ; copiez-le avant de partir.
Comparez les preuves et les rôles des paragraphes, pas les phrases correspondantes. Plusieurs rapports peuvent satisfaire la tâche. La liste de contrôle n'évalue pas automatiquement votre écriture, n'établit pas la compétence ni n'attribue de bande. Retournez à la source pour chaque nombre et qualification.
A second report: one year, several facilities
- The library-centres tables need a different report from the ferry trend. Keep the visit numbers separate from the facility counts, and plan your own overview — don't reuse a trend sentence that fitted the last task. Write at least 150 words before you look at the models.
- Use the notes on the models to improve your own report, not to replace it with memorised sentences. If your report leaves out an important measure, fix that before polishing vocabulary.
Données d'enseignement originales pour la Tâche Académique 1 — Centres de bibliothèque en 2025 :
| Centre | Visites annuelles (milliers) | Sièges de lecture |
|---|---|---|
| Harbour | 120 | 80 |
| Meadow | 90 | 60 |
| Quarry | 60 | 40 |
| Forêt | 30 | 20 |
| Centre | Ordinateurs |
|---|---|
| Harbour | 20 |
| Meadow | 30 |
| Quarry | 20 |
| Forêt | 10 |
Rédigez au moins 150 mots en prose continue. Résumez les caractéristiques principales et effectuez des comparaisons pertinentes. Rédigez un brouillon avant d'ouvrir les modèles, puis corrigez une faiblesse concernant une caractéristique principale, une preuve ou une organisation. Cette page locale ne note pas ni ne force automatiquement la longueur. Votre brouillon reste sur cette page ; copiez-le avant de partir.
Comparez les preuves et les rôles des paragraphes, pas les phrases correspondantes. Plusieurs rapports peuvent satisfaire la tâche. La liste de contrôle n'évalue pas automatiquement votre écriture, n'établit pas la compétence ni n'attribue de bande. Retournez à la source pour chaque nombre et qualification.
Review after a break: keep the measure and its base together
- After a day or two, try the park and music-class questions without rereading the examples. If you miss one, say exactly which column, quantity or base you confused, and rewrite that sentence correctly.
- Next: map reports, process reports, the language of change, or answering the Task 2 question. General Training learners need letters instead.
Données d'enseignement originales — trois parcs en 2025 :
| Parc | Superficie (hectares) | Visites annuelles (milliers) |
|---|---|---|
| Alder | 10 | 90 |
| Beech | 20 | 60 |
| Cypress | 30 | 30 |
Décision : Quelle comparaison est exacte ?
Choisissez UNE seule réponse.
Difficulté 1/5 · 100 pièces + un petit bonus lors de la première réussite aujourd'hui
Alder est le plus petit avec 10 hectares mais a 90 milliers de visites ; Cypress inverse ce classement. Cause et croissance sont absentes. Gardez la superficie et les visites comme des mesures séparées, même lorsque leur ordre contraste.
Données d'enseignement originales — participation hebdomadaire aux cours de musique :
| Année | Élèves inscrits | Part de présence hebdomadaire (%) |
|---|---|---|
| 2021 | 400 | 25 |
| 2025 | 200 | 50 |
Décision : Quelle affirmation respecte les deux dénominateurs ?
Choisissez UNE réponse.
Difficulté 1/5 · 100 pièces + un petit bonus lors de la première réussite aujourd'hui
400×25% = 100 et 200×50% = 100. La part double, soit une hausse de 25 points de pourcentage ; changer l'inscription empêche la même tendance de compte. Recalculez chaque année avant de rédiger.
An overview your details can prove
- Introduce the visual accurately, choose its main features, group meaningful comparisons and support them with correct numbers. Keep counts, shares, rates, dates and projections attached to their labels. No fixed paragraph count can make those decisions for you.
- Checked on 19 October 2026 against the IELTS Academic Writing format. All data and models in this lesson are our own teaching material; the models are not officially rated.

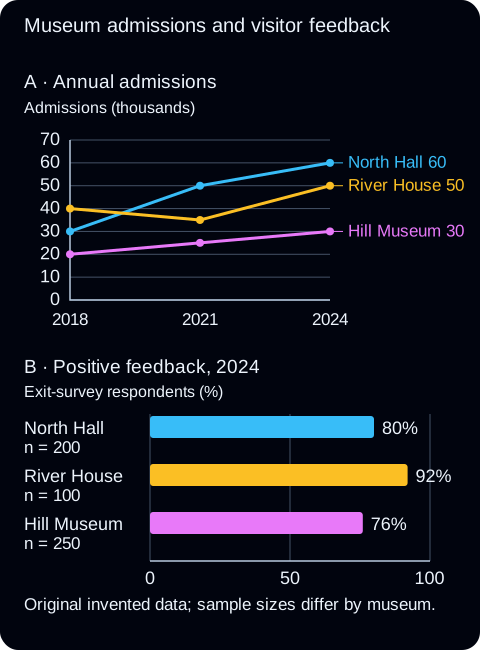
Voir les deux panneaux en taille complète
Affichez les étiquettes et données fournies
Panneau A — Admissions annuelles. Admissions (milliers).
| Musée | 2018 | 2021 | 2024 |
|---|---|---|---|
| North Hall | 30 | 50 | 60 |
| River House | 40 | 35 | 50 |
| Hill Museum | 20 | 25 | 30 |
Panneau B — Retours positifs, 2024. Répondants à l'enquête de sortie (%). Données inventées originales ; tailles d'échantillon différentes par musée.
| Musée | Valeur | Répondants |
|---|---|---|
| North Hall | 80 | 200 |
| River House | 92 | 100 |
| Hill Museum | 76 | 250 |
Décision initiale : Quelle paire d'unités décrit correctement les deux panneaux ?
Difficulté 1/5 · 100 pièces + un petit bonus lors de la première réussite aujourd'hui
Le panneau A compte les entrées en milliers, et non des résidents distincts. Le panneau B indique les réponses positives en pourcentage des répondants à l’enquête de chaque musée. Lisez l’unité et la base séparément avant de combiner les informations des deux panneaux.
Two panels: combine them without mixing units
- Worked mixed chart. North Hall's admissions rise from 30,000 to 60,000, making it the largest of the three museums in 2024. River House, however, has the highest share of positive feedback, at 92%. A good overview contrasts the two leaders; it doesn't force one panel's ranking onto the other.
- North Hall was the most successful museum in every respect ignores the feedback panel. Name the measures instead: the most admissions and the highest positive-feedback share belong to different museums. An enthusiastic therefore cannot invent a missing cause.
Show the supplied labels and data
Panel A — Annual admissions. Admissions (thousands).
| Museum | 2018 | 2021 | 2024 |
|---|---|---|---|
| North Hall | 30 | 50 | 60 |
| River House | 40 | 35 | 50 |
| Hill Museum | 20 | 25 | 30 |
Panel B — Positive feedback, 2024. Exit-survey respondents (%). Original invented data; sample sizes differ by museum.
| Museum | Value | Respondents |
|---|---|---|
| North Hall | 80 | 200 |
| River House | 92 | 100 |
| Hill Museum | 76 | 250 |
- The survey samples differ — 200, 100 and 250 respondents — so the percentages describe the people surveyed, not every visitor admitted.
Voir les deux panneaux en taille réelle
Afficher les étiquettes et les données fournies
Panneau A — Entrées annuelles. Entrées (milliers).
| Musée | 2018 | 2021 | 2024 |
|---|---|---|---|
| North Hall | 30 | 50 | 60 |
| River House | 40 | 35 | 50 |
| Hill Museum | 20 | 25 | 30 |
Panneau B — Avis positifs, 2024. Répondants à l’enquête de sortie (%). Données inventées originales ; tailles d’échantillon variables selon les musées.
| Musée | Valeur | Répondants |
|---|---|---|
| North Hall | 80 | 200 |
| River House | 92 | 100 |
| Hill Museum | 76 | 250 |
Décision guidée : Quelle vue d’ensemble croisée est soutenue ?
Difficulté 1/5 · 100 pièces + un petit bonus lors de la première réussite aujourd'hui
North Hall a enregistré 60 milliers d’entrées en 2024, contre 50 pour River House et 30 pour Hill Museum. River House se place en tête pour les parts de retours positifs avec 92%, contre 80% et 76%. Ces classements peuvent être comparés ; les panneaux n’établissent pas de lien de causalité ni ne garantissent que les échantillons de sondage représentent l’ensemble des entrées.
Check each panel's dates before describing a trend
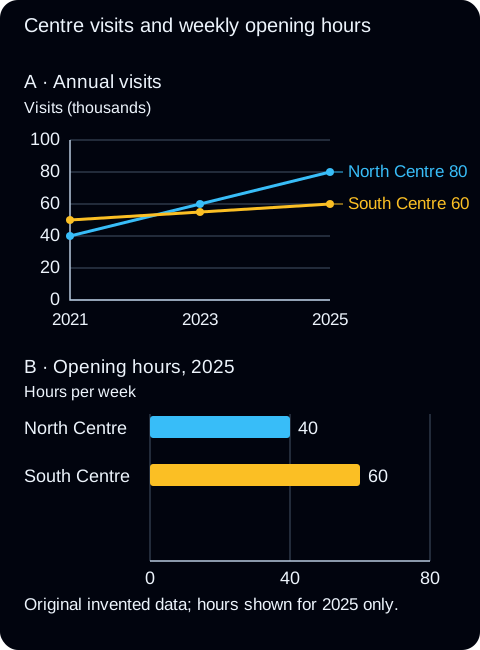
- In a new two-panel display, note each panel's dates and unit before writing. A visits line covering several years doesn't turn a one-year bar chart of opening hours into a trend.
- Try the centre question before reading its explanation, and check each claim against both panels.

Voir les deux panneaux en taille réelle
Afficher les étiquettes et les données fournies
Panneau A — Visites annuelles. Visites (milliers).
| Centre | 2021 | 2023 | 2025 |
|---|---|---|---|
| North Centre | 40 | 60 | 80 |
| South Centre | 50 | 55 | 60 |
Panneau B — Heures d’ouverture, 2025. Heures par semaine. Données inventées originales ; heures indiquées uniquement pour 2025.
| Centre | Valeur |
|---|---|
| North Centre | 40 |
| South Centre | 60 |
Décision indépendante fraîche : Quelle affirmation rapporte les deux panneaux sans étendre leur portée ?
Difficulté 1/5 · 100 pièces + un petit bonus lors de la première réussite aujourd'hui
North Centre affiche 80 milliers de visites contre 60 pour South en 2025, tandis que les heures d’ouverture hebdomadaires sont de 40 contre 60. La série temporelle montre les visites, et non les heures d’ouverture historiques, donc aucune tendance horaire n’est fournie. Les classements finaux différents ne prouvent pas que les heures d’ouverture ont causé le modèle des visites.
Write a full report on a mixed chart
- Write your own report on the ferry display below. Keep passenger journeys separate from percentages of departures: a journey and a departure are different things to count.
- Then open the weaker and improved comparison, find one inaccurate claim in your own report, and fix it. Other organisations can work; the model is an example, not a script to memorise.

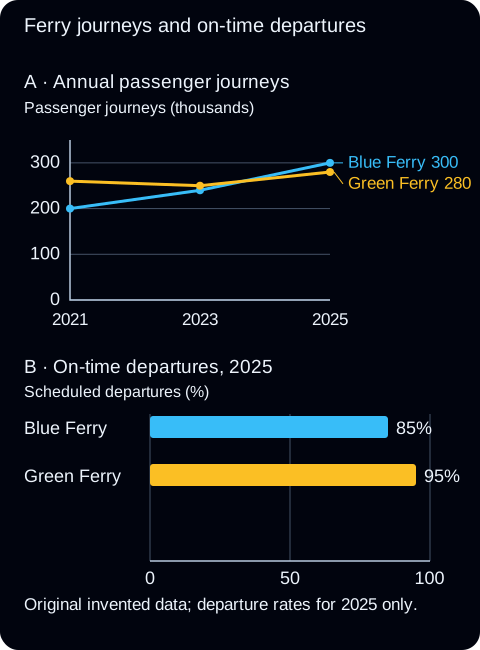
Show the supplied labels and data
Panel A — Annual passenger journeys. Passenger journeys (thousands).
| Opérateur | 2021 | 2023 | 2025 |
|---|---|---|---|
| Blue Ferry | 200 | 240 | 300 |
| Green Ferry | 260 | 250 | 280 |
Panel B — On-time departures, 2025. Scheduled departures (%). Original invented data; departure rates for 2025 only.
| Opérateur | Tonalité (Value) |
|---|---|
| Blue Ferry | 85 |
| Green Ferry | 95 |
New-context written transfer: Write an English Academic Task 1 practice report of at least 150 words in connected prose. Describe both displays, select a main picture and support relevant comparisons with supplied values. Try your own report before opening the comparison. Then revise one cross-panel claim after checking its date, unit and base. This local self-review does not produce a band estimate.
Utilisez le modèle et les critères pour comparer et réviser votre rapport ; plusieurs organisations sont valides. Ceci documente une auto-écriture, pas une évaluation indépendante ni un résultat IELTS.
Remember the method, then use it somewhere new
- Tomorrow, go back to one of the displays and write an overview without the model, checking which panel supports each part. A few days later, try another display and explain one cross-panel claim its data can't support.
- Next: the language of change, map reports or process reports. General Training uses letters.
- Checked on 20 October 2026 against the IELTS Academic Writing format. All displays and reports are our own practice material.