Higher Tier: environmental change shifts distributions
Introduit| English | Sens |
|---|---|
| distribution/ˌdɪstrɪˈbjuːʃn/ | distribution |
| range boundary/reɪndʒ ˈbaʊndəri/ | limite de répartition |
Butterflies moving north (Higher)
- Since the 1970s, the comma butterfly's range in Britain has moved about 200 km north as the climate warmed.
- When the environment changes, the distribution 分布 of a species (where it is found) changes too. In the exam you will be given data and asked to evaluate what it shows.
Three changes that move species
| Change | Example | Why the species moves |
|---|---|---|
| temperature | the comma butterfly spreads north in Britain | places that were too cold for it are now warm enough to breed |
| availability of water | wildebeest in East Africa follow the rains each year | they move to where there is water and fresh grass |
| atmospheric gases | many lichens are missing near city centres | sulfur dioxide from burning fuels damages them |
Which environmental changes can shift distributions?
Difficulté 2/5 · 140 pièces + un petit bonus lors de la première réussite aujourd'hui
The three factors in the specification.
Seasonal, geographic or human?
- Seasonal changes repeat every year: swallows leave Britain each autumn; wildebeest migrate with the rains.
- Geographic changes follow place: it is colder higher up a mountain, so species form bands by altitude. Human changes come from our activity: air pollution, draining wetlands, and climate change from burning fossil fuels.
Mean rate of a range-boundary shift
A boundary moving from 200 to 245 km over 15 years shifts 45 km, a mean of 45 ÷ 15 = 3 km per year. A mean rate does not mean every year moved equally.
Seasonal, geographic or caused by humans?
Difficulté 2/5 · 140 pièces + un petit bonus lors de la première réussite aujourd'hui
Seasonal repeats each year; geographic follows place; human comes from our activity.
Reading survey data
- Ecologists counted lichen species on trees at six sites along a line out of a city, and measured sulfur dioxide at each site.
- Read both scales: the bars use the left axis, the line uses the right axis.
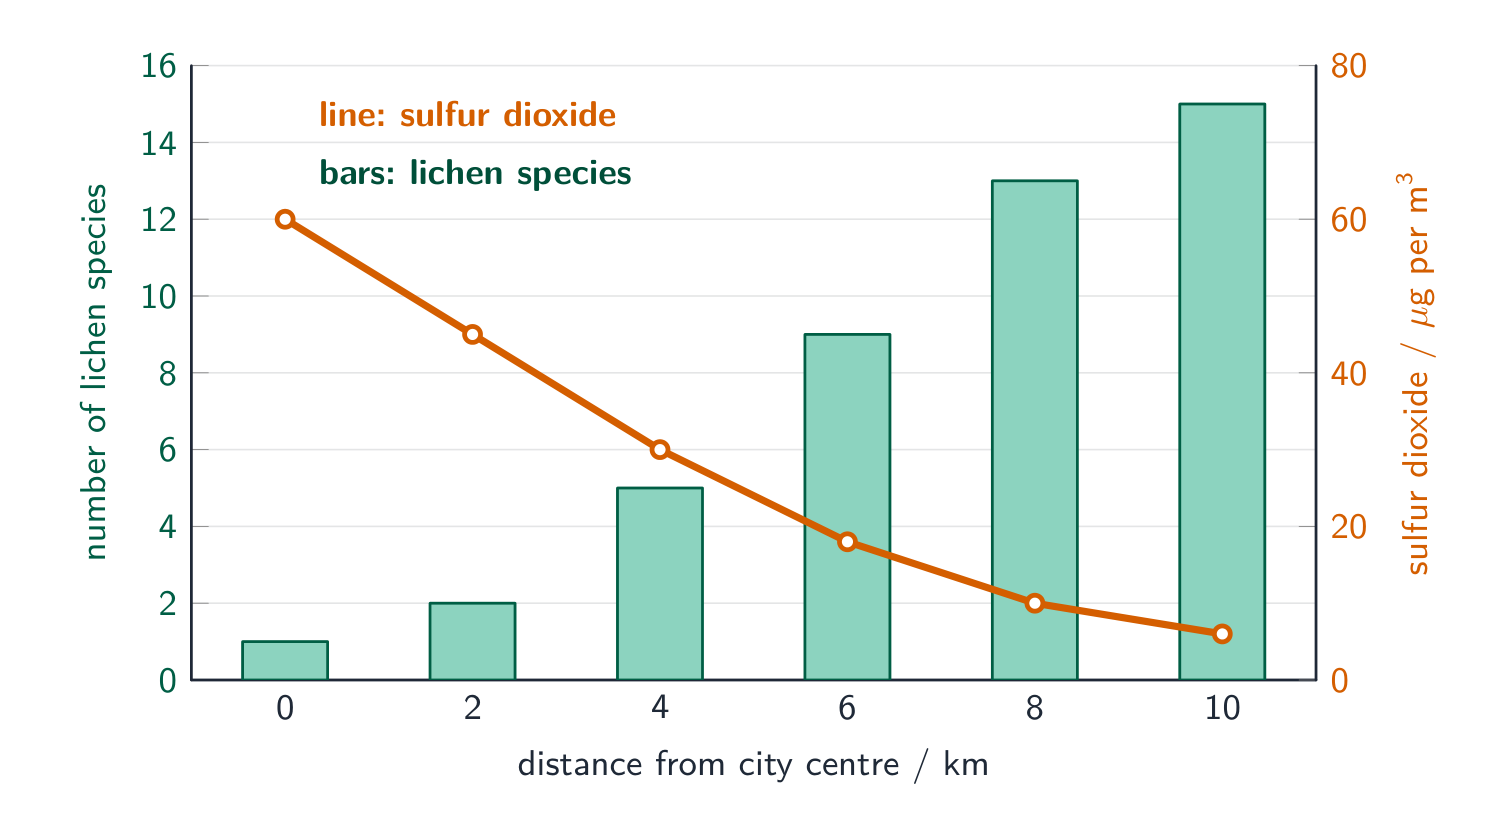
Use the survey graph. How many lichen species were found at 6 km from the city centre?
Difficulté 2/5 · 140 pièces + un petit bonus lors de la première réussite aujourd'hui
Read the bar at 6 km on the left axis.
Worked example: evaluate the data
Describe the pattern, with data: as distance from the centre increases from 0 to 10 km, the number of lichen species rises from 1 to 15, while sulfur dioxide falls from 60 to 6 µg per m³.
Explain: sulfur dioxide damages lichens, so fewer species can survive where there is more of it.
Evaluate (limits):
- This is a correlation: it does not prove sulfur dioxide is the cause. Other factors also change with distance, such as light, tree type and other pollutants.
- There is only one line of sites and one survey. Repeating along other lines, and in other years, would make the conclusion more reliable.
Why do the lichen data not prove that sulfur dioxide kills lichens?
Difficulté 1/5 · 100 pièces + un petit bonus lors de la première réussite aujourd'hui
Light, tree type and other pollutants change too; a correlation alone does not show the cause.
Worked example: a shifting boundary
A species' northern range boundary 分布边界 moves from 200 km to 245 km north of a reference line over 15 years.
- Shift $= 245 - 200 = 45$ km.
- Mean rate $= 45 \div 15 = 3$ km per year.
- Mean, not every year: in some years it may not move at all.
A boundary moves 60 km in 20 years. What is the mean rate in km per year?
Difficulté 2/5 · 140 pièces + un petit bonus lors de la première réussite aujourd'hui
60 ÷ 20 = 3.
Distribution is not abundance
- Distribution is where a species is found. Abundance is how many there are.
- A species can spread into new places while becoming rarer overall, so read which one a question asks about.
Distribution or abundance?
Difficulté 2/5 · 140 pièces + un petit bonus lors de la première réussite aujourd'hui
Two different measures.
Exam-style question
Question (4 marks): Scientists say the comma butterfly has moved north because of climate change. Evaluate this claim. Use the information in this lesson.
Model answer
- For: the range has moved about 200 km north since the 1970s, ✓ the same time that average temperatures in Britain rose. ✓
- Against: this is a correlation; other changes, such as more of its food plants in the north, could also explain it. ✓
- Better evidence: records from many years and many sites, using the same survey method each time. ✓
Where marks are lost: giving only reasons for the claim. "Evaluate" means giving both sides and a judgement.
One warm year does not prove a trend. Distributions vary from year to year. A real shift needs many years of matched data.
One unusually warm year proves a species' range is shifting.
Difficulté 1/5 · 100 pièces + un petit bonus lors de la première réussite aujourd'hui
A trend needs many years of matched data.
Changes in temperature, availability of water and atmospheric gases change the distribution of species; the changes may be seasonal, geographic or caused by humans. To evaluate data: describe the pattern with numbers, explain it, then give its limits (correlation is not cause; more sites and years make it more reliable). Distribution is where a species lives; abundance is how many.
A frog species is now found 150 m higher up a mountain than it was 30 years ago. Over the same time the average temperature there rose by 1 °C. Evaluate the idea that the rise in temperature caused the change in distribution. (4 marks)
Evaluate means both sides, then what would settle it.