Required practical 9: abundance and distribution
Introduit| English | Sens |
|---|---|
| Abundance/əˈbʌndəns/ | How many individuals of a species are in an area. |
| distribution/ˌdɪstrɪˈbjuːʃn/ | The pattern of values or outcomes and their frequencies or probabilities. |
| quadrat/ˈkwɒdræt/ | quadrat |
| transect/trænˈsekt/ | bande d'échantillonnage |
Bluebells under the trees
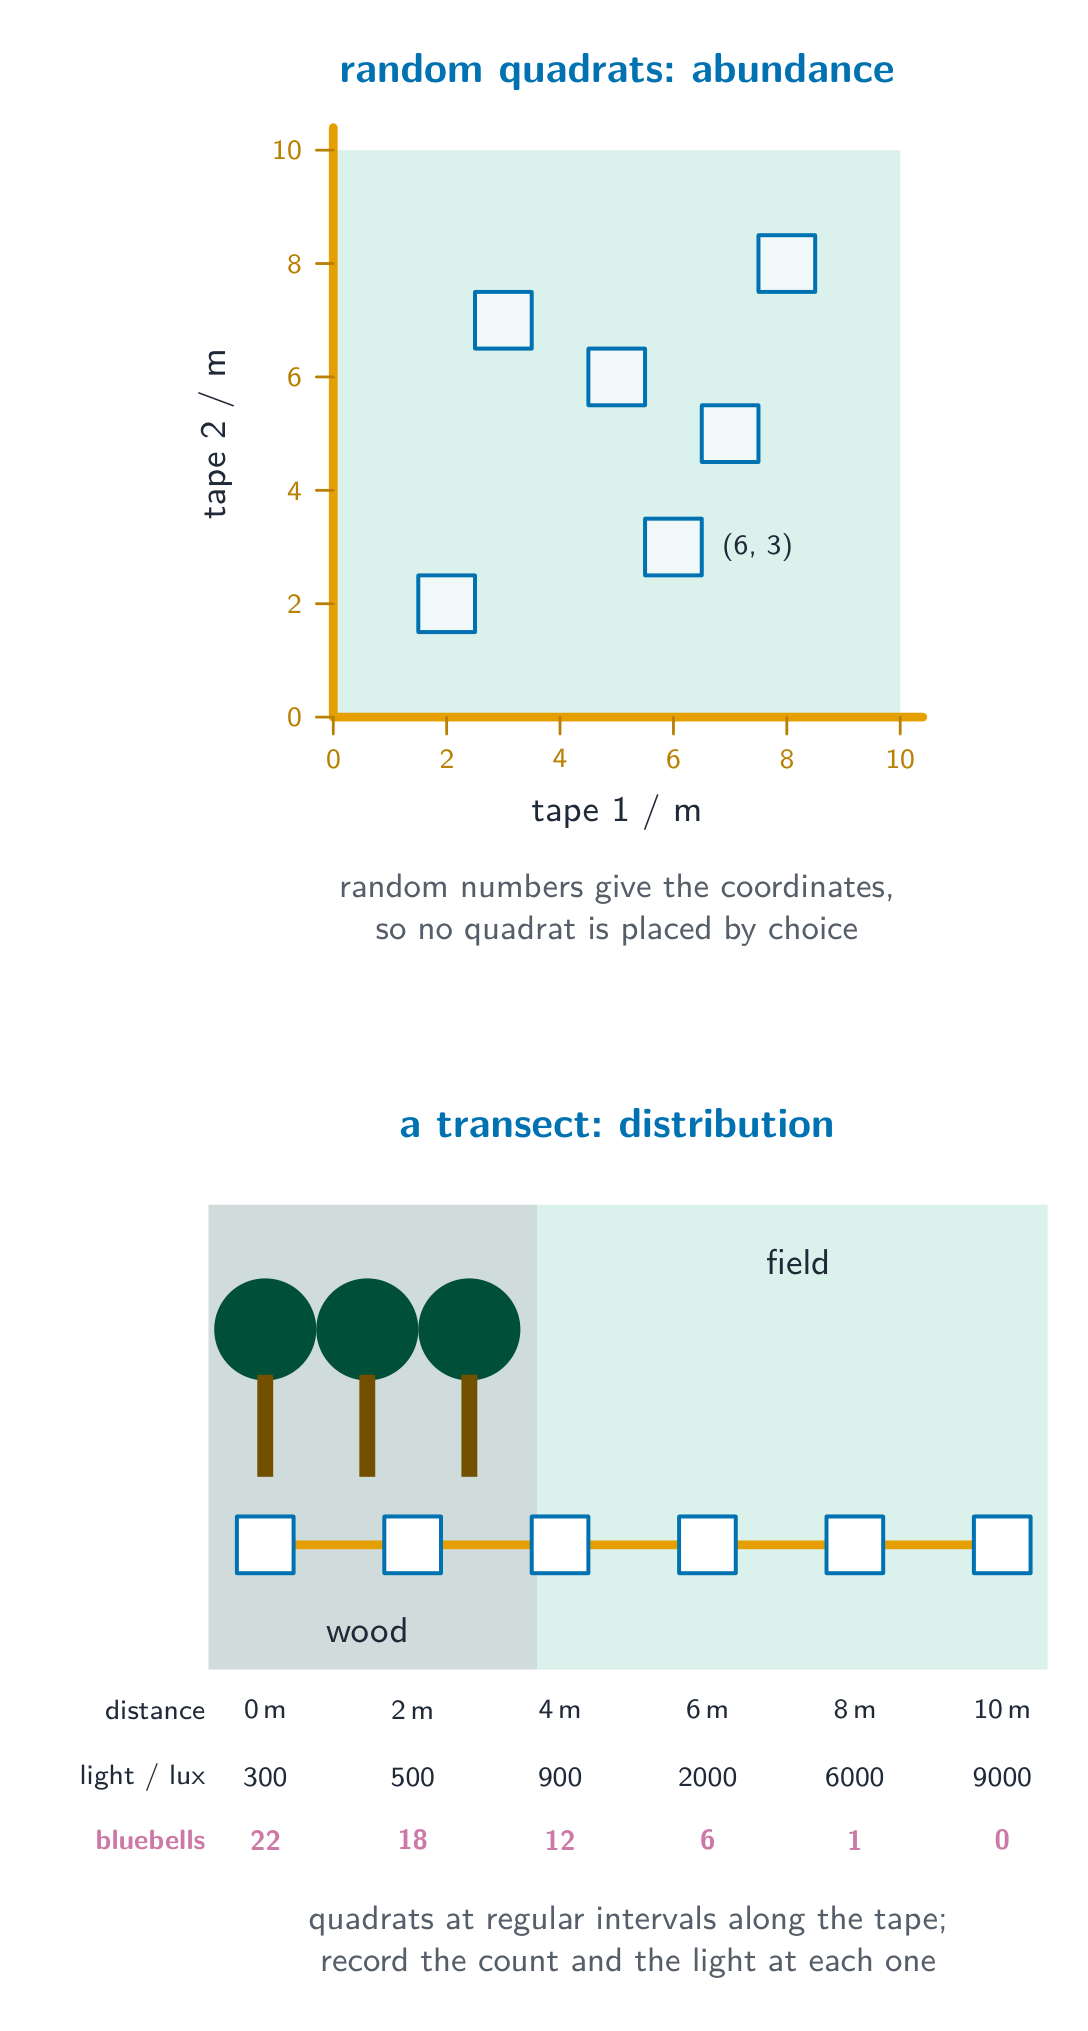
- In spring, bluebells carpet some woods but stop at the edge of the field. A survey can show where they grow and how many there are.
- Abundance 多度 means how many; distribution 分布 means where. Required practical 9 measures both.
Random quadrats for abundance
- Lay two tape measures at right angles along two edges of the area. Use a random number generator to pick two coordinates, and place a quadrat 样方 (for example 0.5 m × 0.5 m) there.
- Count the plants inside, and repeat for at least 10 quadrats. Random positions stop you choosing crowded or empty patches by eye, which would bias the result.
Why should quadrats be placed at random coordinates?
Difficulté 1/5 · 100 pièces + un petit bonus lors de la première réussite aujourd'hui
Choosing by eye tends to pick crowded or empty patches.
Counting rules
- Count a plant on the edge only if more than half of it is inside the quadrat (or count plants on two sides only). Use the same rule every time.
- When single plants are hard to count, such as grass, estimate percentage cover: in a quadrat split into 100 small squares, count the squares more than half covered.
In a quadrat with 100 small squares, grass covers more than half of 37 squares. What is the percentage cover?
Difficulté 2/5 · 140 pièces + un petit bonus lors de la première réussite aujourd'hui
Each square is 1% of the quadrat.
Worked example: from counts to a population
Ten 0.25 m² quadrats in a 100 m² wood gave these bluebell counts: 3, 5, 0, 4, 6, 2, 5, 4, 7, 4.
- Mean $= 40 \div 10 = 4$ per quadrat. In order: 0, 2, 3, 4, 4, 4, 5, 5, 6, 7, so the median is 4 and the mode is 4. The range is $7 - 0 = 7$.
- Density $= 4 \div 0.25 = 16$ per m².
- Population $= 16 \times 100 = 1600$ bluebells.
- Check: a crowded patch chosen by eye might give 8 per quadrat and a wrong estimate of 3200.
From five quadrats to the whole habitat
Mean count per quadrat ÷ quadrat area gives plants per m² (a mean of 4 in 0.25 m² quadrats is 16 per m²); multiply by the habitat area, here 100 m², to estimate the population. Compare with random and crowded samples.
Counts in seven quadrats: 2, 6, 3, 9, 3, 5, 7. What is the median?
Difficulté 2/5 · 140 pièces + un petit bonus lors de la première réussite aujourd'hui
In order 2, 3, 3, 5, 6, 7, 9; the middle value is 5.
Mean 5 plants per 0.25 m² quadrat; field area 400 m². Estimate the population.
Difficulté 2/5 · 140 pièces + un petit bonus lors de la première réussite aujourd'hui
5 ÷ 0.25 = 20 per m²; × 400 = 8000.
A transect for distribution
- Lay a tape, a transect 样带, across a change in the habitat, such as from the wood into the field. Place a quadrat at regular intervals along it, for example every 2 m.
- At each point, record the count and an abiotic factor at the same time, such as light intensity with a light meter. Then plot both against distance.
Which method answers each question?
Difficulté 2/5 · 140 pièces + un petit bonus lors de la première réussite aujourd'hui
Abundance needs random quadrats; distribution across a change needs a transect.
Making it valid
- Use enough quadrats (at least 10) and random positions; use the same quadrat size every time.
- For a transect, keep the interval the same, and take all readings on the same day, so the weather is the same. Repeat the transect in other places to check the pattern.
Which make a quadrat survey more valid?
Difficulté 2/5 · 140 pièces + un petit bonus lors de la première réussite aujourd'hui
Choosing by eye adds bias.
Exam-style question
Question (6 marks): Describe how students could estimate the number of daisies on a school field that is 50 m × 80 m.
A top-band answer includes:
- Lay two tape measures at right angles along two sides of the field.
- Use a random number generator to give coordinates, and place a quadrat (e.g. 1 m²) there.
- Count the daisies in the quadrat, with a clear rule for daisies on the edge.
- Repeat for at least 10 quadrats and find the mean number per quadrat.
- Work out the mean per m², then multiply by the field area, $50 \times 80 = 4000$ m².
How it is marked: 6-mark answers are marked by level. The top level needs a full, logical method that would work and ends with the calculation. Missing "random" or missing the scale-up to the whole field drops a level.
A transect shows a pattern, not a cause. Bluebells may fall where light rises, but soil moisture may also change. Recording one factor shows a correlation only.
A transect proves that light causes the change in plant numbers.
Difficulté 1/5 · 100 pièces + un petit bonus lors de la première réussite aujourd'hui
It shows a correlation; other factors such as soil moisture may also change.
Random quadrats estimate abundance: place them at random coordinates, count, find the mean per quadrat, convert to per m², and multiply by the area. A transect with quadrats at regular intervals shows how distribution changes across a habitat, along with an abiotic factor measured at each point.
Describe how to investigate how the distribution of a plant changes from a hedge into a field. (4 marks)
A clear method someone else could follow.