5
(a)
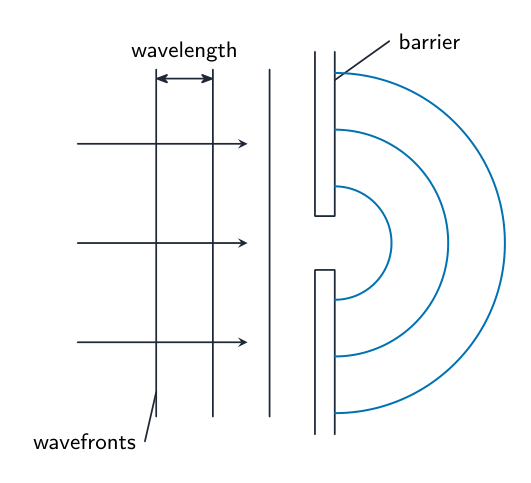
Fig. 5.1
Fig. 5.1 is a scale diagram of wavefronts of red light approaching a gap in a barrier.
On Fig. 5.1, draw three wavefronts after the wave has passed through the gap.[3]
(b)
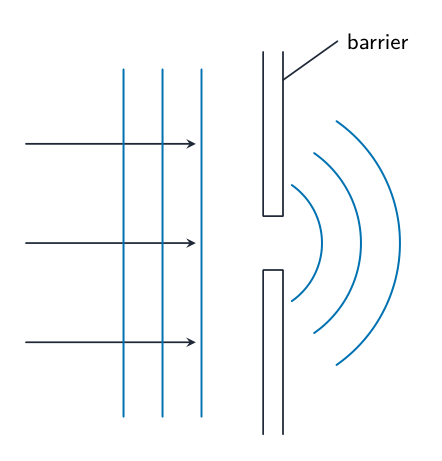
Fig. 5.2
Fig. 5.2 shows the same barrier and gap. A wave of blue light approaches this barrier.
On Fig. 5.2:
- draw three wavefronts of this wave before it reaches the barrier
- draw three wavefronts after the wave passes through the gap.
[3]
[Total: 6]