Skip to content

IGCSE Physics · June 2024 · Paper 53 · Difficulty 3 · Standard

Question 3

3

In this experiment, you will determine the focal length of a converging lens.

Refer to Fig. 3.1.

(a)

Set up the apparatus as shown in Fig. 3.1.

(i)

Measure the height $h_O$ of the illuminated object. Fig. 3.1 shows the height to measure on the illuminated object provided.

$h_O$ = cm[1]

(ii)

Place the lens a distance $u$ = 20.0 cm from the illuminated object. Place the screen near the lens. Switch on the lamp. Move the screen until a focused image of the illuminated object is seen on the screen.

Measure, and record in Table 3.1, the height $h_I$ of the image on the screen.

Repeat the procedure for $u$ = 25.0 cm, 30.0 cm, 35.0 cm and 40.0 cm.[1]

Switch off the lamp.

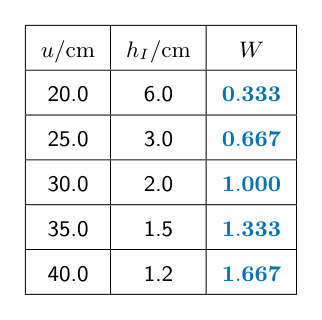
Table 3.1

$u$/cm$h_I$ / cm$W$
20.0
25.0
30.0
35.0
40.0
(iii)

Describe a technique for obtaining an image that is as sharp as possible.[1]

(b)

For each distance $u$, calculate, and record in Table 3.1, a value $W$. Use your results from (a) and the equation $W = \frac{h_O}{h_I}$.[1]

(c)

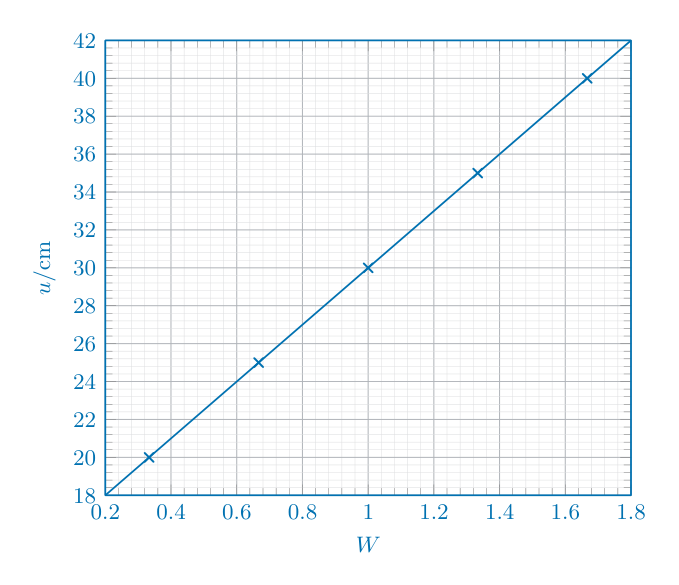
Plot a graph of $u$/cm (y-axis) against $W$ (x-axis). You do not need to start your axes at the origin (0,0). Draw the best-fit line.[4]

(d)
(i)

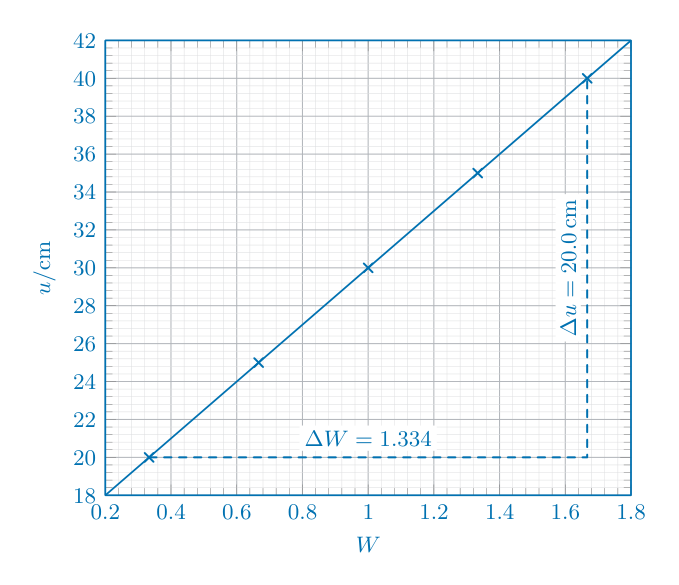
Determine the gradient $G$ of the line. Show clearly on the graph how you obtained the necessary information.

$G$ = [1]

(ii)

The focal length $f$ of the lens is numerically equal to the gradient $G$.

Record a value of $f$ for this experiment.

$f$ = cm[1]

(e)

A student decides to continue the experiment using larger values of $u$.

Explain why this produces less accurate values for $W$.[1]
Show the mark scheme

These are the official mark-scheme rows. Each point that matches your answer earns a mark.

Tap the mark scheme to open it full size.

Show a worked answer

How to reach each mark, step by step. Try the question yourself first.

3(a)(i)

  • Measure the height of the illuminated part of the actual object, as marked by $h_O$ in Fig. 3.1. The sketch does not give its actual height.
  • For example, the measurement could be $h_O = \mathbf{2.0}\,\mathrm{cm}$; use your own measurement.

3(a)(ii)

  • For each value of $u$, focus the image on the screen and measure its height. Record your own readings in the table.
  • The image heights should decrease as $u$ increases.

3(a)(iii)

  • Move the screen slowly back and forth until the image is as sharp as possible.

3(b)

  • Use $W=h_O/h_I$; $W$ has no unit. The example table uses $h_O=2.0\,\mathrm{cm}$ and example image heights; use your own readings.
  • For the first row, $W=2.0/6.0=\mathbf{0.333}$. The calculated values are shown in bold.
Worked answer drawing

3(c)

  • The graph below uses the example values in (b). Plot your own measured values, with $W$ on the horizontal axis and $u/\mathrm{cm}$ on the vertical axis.
  • Use even scales and precise crosses. Draw a thin best-fit line through the trend.
Worked answer drawing

3(d)(i)

  • The large triangle below uses the example graph. Use two well-separated points on your own best-fit line.
  • $G=\Delta u/\Delta W=(40.0-20.0)/(1.667-0.333)=\mathbf{15.0}\,\mathrm{cm}$.
Worked answer drawing

3(d)(ii)

  • Use $f = G$. The gradient gives the numerical value of the focal length in centimetres.
  • For example, if $G = 15.0\,\mathrm{cm}$, then $f = \mathbf{15.0}\,\mathrm{cm}$. Use your own gradient to two or three significant figures.

3(e)

  • At larger object distances, the image height is smaller. The same ruler uncertainty is a larger percentage of the height, so $W$ is less accurate.
Original question

Log in or create account

IGCSE, A-Level & AP