Skip to content

IGCSE Physics · November 2025 · Paper 53 · Difficulty 3 · Standard

Question 3

3

In this experiment, you will investigate the inverted image produced by a converging lens.

Refer to Fig. 3.1.

(a)
(i)

Measure the height $h_{\text{O}}$ of the triangular object provided.

$h_{\text{O}} =$ cm

  • Place the lens a distance $u = 20.0\text{ cm}$ from the illuminated triangular object.
  • Place the screen close to the lens.
  • Switch on the lamp.
  • Move the screen away from the lens until a clear focused image of the triangular object is seen on the screen.
  • Measure, and record in Table 3.1, the height $h_{\text{I}}$ of the image.

Describe one technique you used to produce an image on the screen which is as sharp as possible in this experiment.

[1]

(ii)

Repeat the procedure for $u = 25.0\text{ cm}$, $u = 30.0\text{ cm}$, $u = 35.0\text{ cm}$ and $u = 40.0\text{ cm}$.

Switch off the lamp.

Table 3.1

$u/\text{cm}$$h_{\text{I}}/\text{cm}$$D/\frac{1}{\text{cm}}$
20.0
25.0
30.0
35.0
40.0

[1]

(b)

For each distance $u$, calculate, and record in Table 3.1, a value $D$.

Use your values of $h_{\text{I}}$ from Table 3.1 and the equation:

$$D = \frac{1}{h_{\text{I}}}.$$

[1]

(c)

Plot a graph of $u/\text{cm}$ ($y$-axis) against $D/\frac{1}{\text{cm}}$ ($x$-axis). Start the axes at the origin $(0,0)$.

Draw a best-fit straight line.

[4]

(d)
(i)

From your graph, determine $u_0$, the value of $u$ when $D$ is zero.

$u_0 =$ cm[1]

(ii)

Determine the gradient $G$ of the graph.

Show clearly on the graph how you obtained the necessary information.

$G =$ [1]

(iii)

Calculate the focal length $f$ of the lens. Use your value of $h_{\text{O}}$ from (a) and the equation:

$$f = \frac{G}{h_{\text{O}}} \times k, \quad \text{where } k = 1.0\text{ cm}^2.$$

$f =$ cm[1]

(e)

Describe one difficulty that can be experienced when measuring the height of the image in this experiment.

Suggest an improvement to overcome this difficulty.

difficulty

improvement [1]

[Total: 11]
Show the mark scheme

These are the official mark-scheme rows. Each point that matches your answer earns a mark.

Tap the mark scheme to open it full size.

Show a worked answer

How to reach each mark, step by step. Try the question yourself first.

3(a)(i)

  • Measure the object itself. For example, $h_O = \mathbf{2.0}\,\mathrm{cm}$.
  • Move the screen slowly back and forth around the best position, then stop where the image looks sharpest.

3(a)(ii)

  • Measure the focused image height at each distance. For example, for $u = 20.0$, $25.0$, $30.0$, $35.0$ and $40.0\,\mathrm{cm}$, the heights could be $6.0$, $3.0$, $2.0$, $1.5$ and $1.2\,\mathrm{cm}$.
  • The image height decreases as the object distance increases. Record your own readings.

3(b)

  • Use $D = 1/h_I$ for each measured image height.
  • For example, when $h_I = 6.0\,\mathrm{cm}$, $D = 1/(6.0\,\mathrm{cm}) = \mathbf{0.17}\,\mathrm{cm^{-1}}$. Calculate each value to at least two significant figures.

3(c)

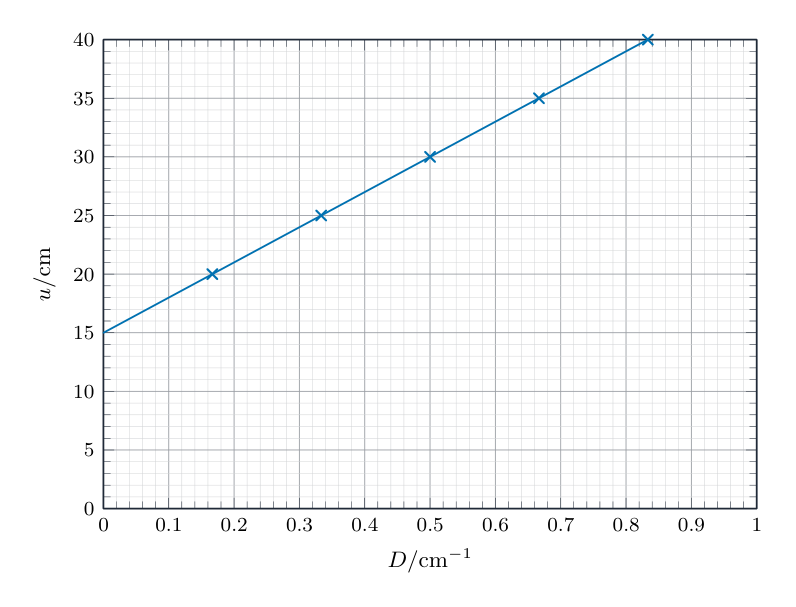
  • Use the example readings from (a)(ii): $D=1/6,\,1/3,\,1/2,\,2/3,\,5/6\,\mathrm{cm^{-1}}$ at $u=20,25,30,35,40\,\mathrm{cm}$. Your measured points may differ.
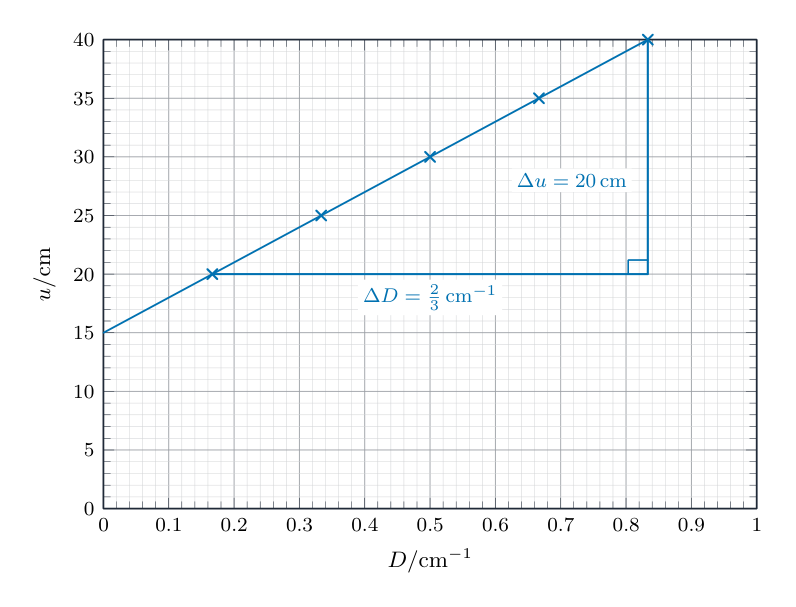
  • The example graph below has labelled axes starting at zero, precise crosses and a thin best-fit line: $\mathbf{u=30D+15}$ using numerical axis readings.
Worked answer drawing

3(d)(i)

  • Extend your best-fit line to $D = 0$ and read $u_0$ where it crosses the vertical axis.
  • For the example readings, the intercept is $u_0 = \mathbf{15}\,\mathrm{cm}$. Use the intercept from your own graph.

3(d)(ii)

  • Use $G=\Delta u/\Delta D$. The large triangle on the example graph shows $\Delta u=20\,\mathrm{cm}$ and $\Delta D=2/3\,\mathrm{cm^{-1}}$.
  • The example gives $G=20/(2/3)=\mathbf{30}\,\mathrm{cm^2}$. Use the gradient from your own graph.
Worked answer drawing

3(d)(iii)

  • Use $f = (G/h_O)k$.
  • For example, $f = (30/2.0\,\mathrm{cm})(1.0\,\mathrm{cm^2}) = \mathbf{15}\,\mathrm{cm}$. Use your own values of $G$ and $h_O$.

3(e)

  • A hand or ruler can cast a shadow over the image, making its edges hard to see.
  • Use a translucent screen and measure the image from behind it.
Original question

Log in or create account

IGCSE, A-Level & AP