Representations of Equilibrium
مُقدَّم 8:24
التوازن
مصنع كيميائي وقت الغروب. بداخله، يتحول النيتروجين من الهواء إلى الأمونيا — السماد الذي يُغذي حوالي نصف سكان العالم اليوم. لكن الـ…
سرد باللغة الإنجليزية · ترجمة نصية بالإنجليزية و中文 يمكنك التبديل بينهما
In this lesson
| English | المعنى |
|---|---|
| particle diagram/ˈpɑːtɪkl ˈdaɪəɡræm/ | A drawing that shows atoms or molecules as spheres, so you can count each species. |
Count the particles, find K
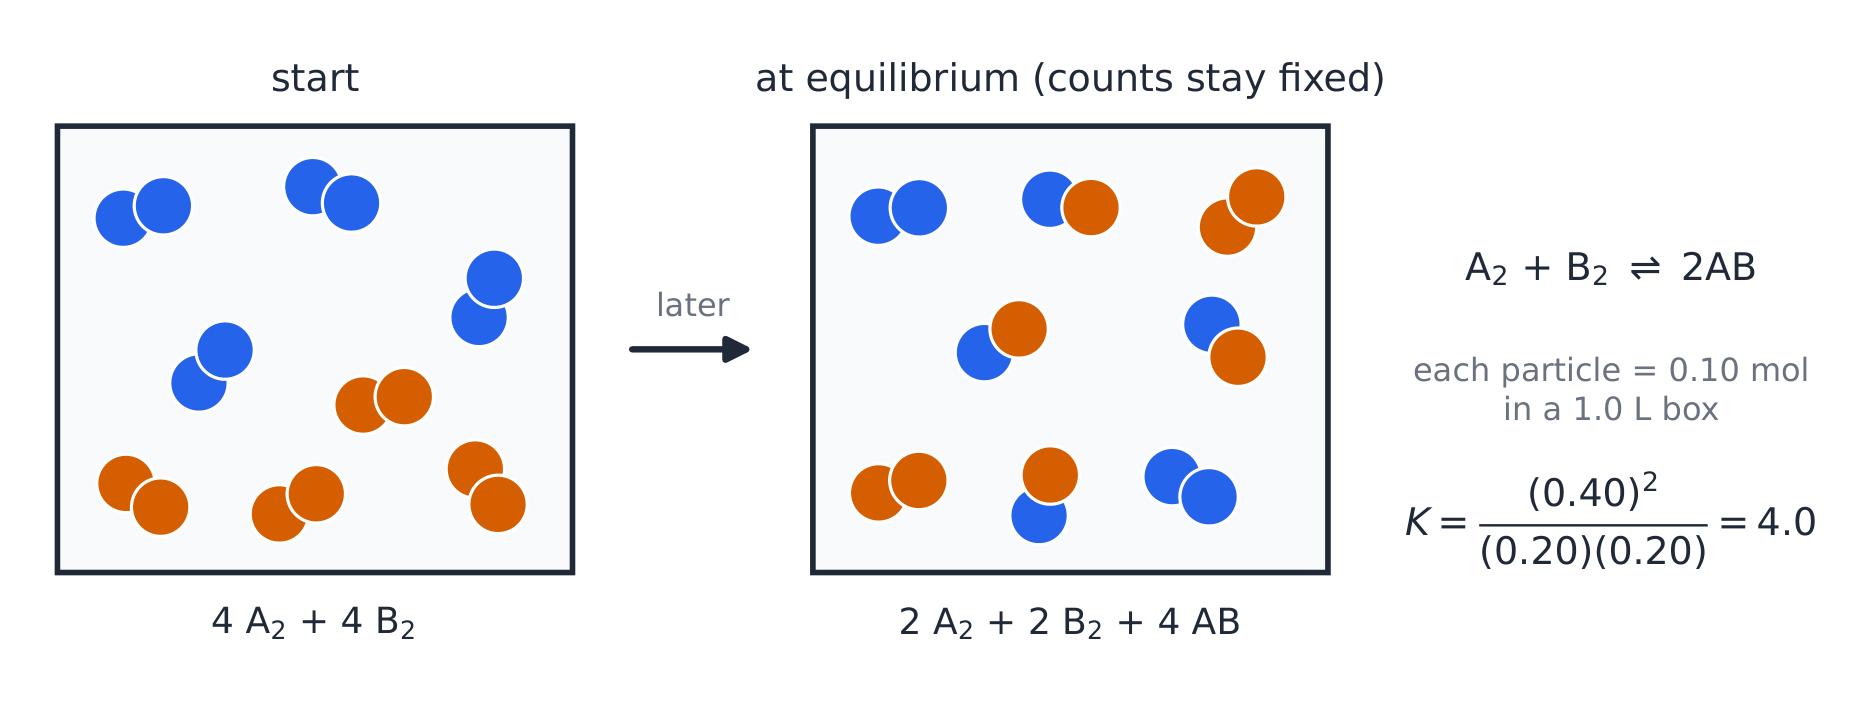
- AP questions often show equilibrium as a particle diagram 粒子图: a box with coloured spheres. If every sphere stands for the same amount and the box has a known volume, you can count your way to $K$.
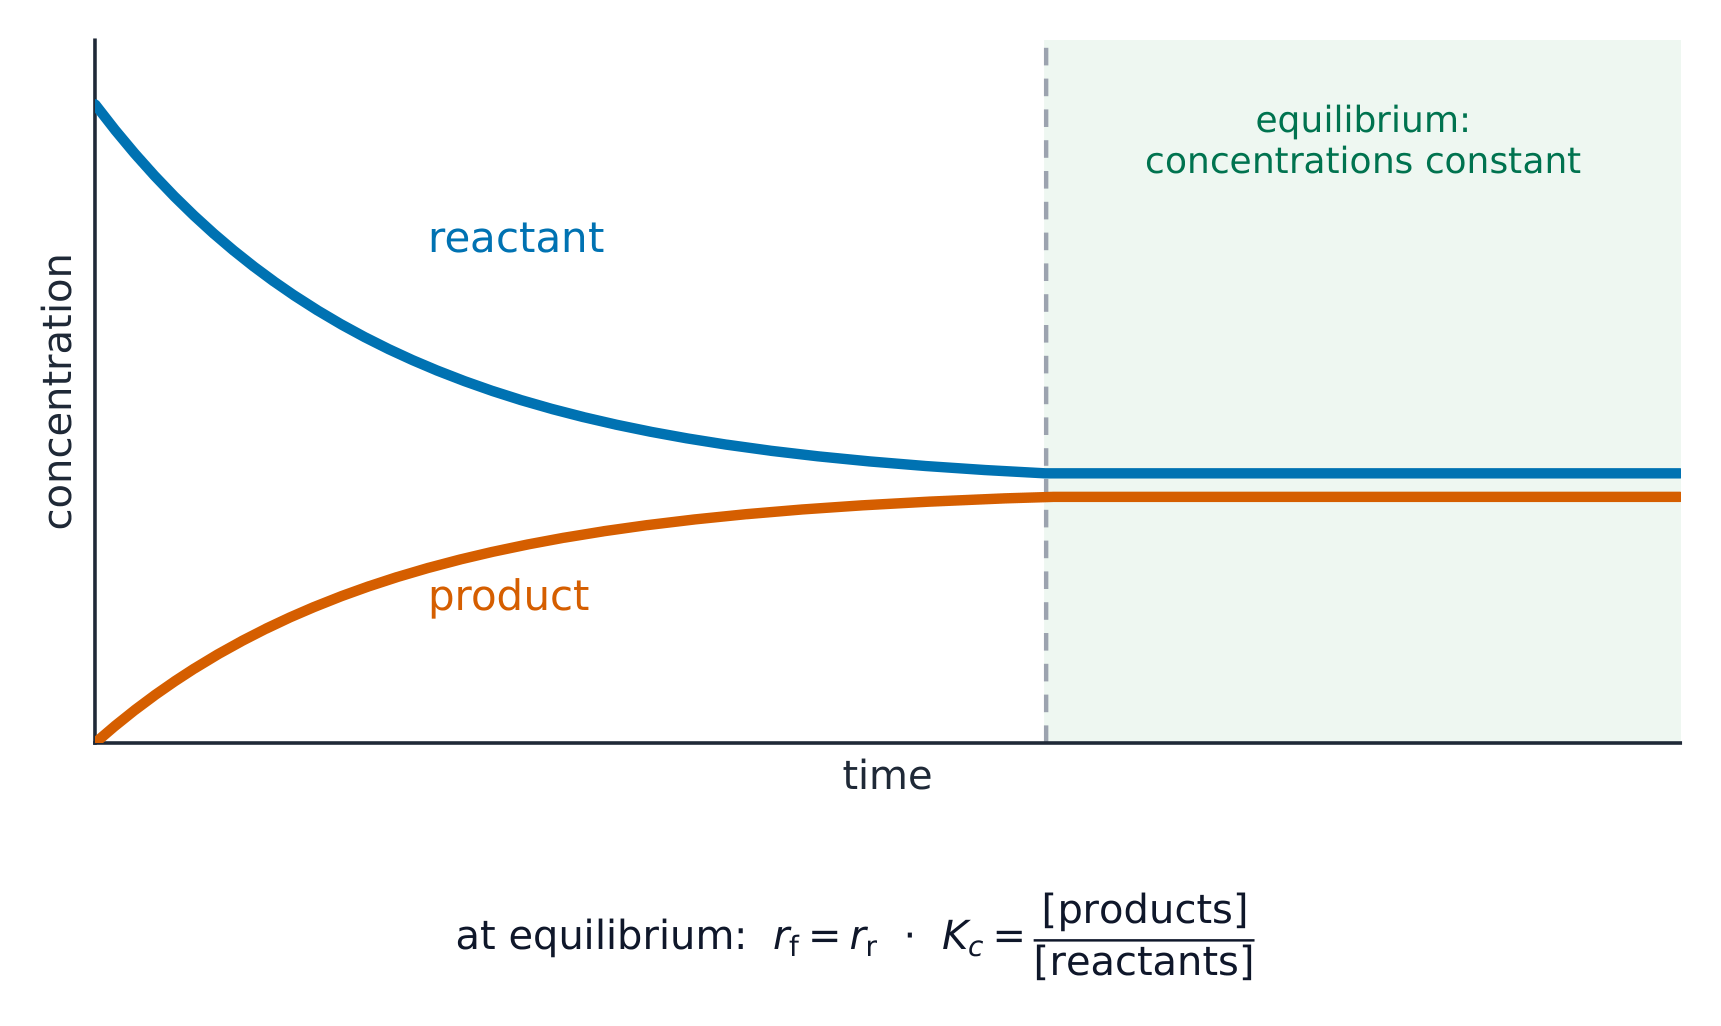
- Other questions show a concentration–time graph. Both pictures carry the same information as numbers in a table.
From counts to concentrations
- Convert each count to a concentration: count × (moles per particle) ÷ volume. Then put the concentrations into the $K$ expression.
- In the figure, each particle is $0.10\ \text{mol}$ in $1.0\ \text{L}$. At equilibrium: 2 $\text{A}_2$, 2 $\text{B}_2$, 4 AB, so $0.20$, $0.20$ and $0.40\ \text{M}$, and $K=\dfrac{(0.40)^2}{(0.20)(0.20)}=4.0$.
للدفاع $\text{X}_2+\text{Y}_2\rightleftharpoons2\text{XY}$, an equilibrium box holds 1 $\text{X}_2$, 4 $\text{Y}_2$ and 6 XY. Calculate $K$.
الصعوبة 2/5 · 140 عملة + مكافأة صغيرة عند الإنجاز الأول اليوم
The moles of gas are equal on both sides, so counts work: $K=\dfrac{6^2}{1\times4}=9.0$.
When can you use counts directly?
- If the total number of moles of gas is the same on both sides (like $\text{A}_2+\text{B}_2\rightleftharpoons2\text{AB}$), the volume cancels in $K$. Then the raw counts give the right $K$: $\dfrac{4^2}{2\times2}=4$.
- If the moles differ (like $\text{A}\rightleftharpoons2\text{B}$), the volume does not cancel. You must convert to concentrations first.
A mixture at equilibrium
Tap the particle box to see what stays constant at equilibrium.
للدفاع $\text{A}(g)\rightleftharpoons2\text{B}(g)$, a $2.0\ \text{L}$ box at equilibrium holds 4 A and 4 B particles, each $0.10\ \text{mol}$. Calculate $K_c$.
الصعوبة 2/5 · 140 عملة + مكافأة صغيرة عند الإنجاز الأول اليوم
$[\text{A}]=[\text{B}]=\dfrac{4\times0.10}{2.0}=0.20\ \text{M}$. $K_c=\dfrac{(0.20)^2}{0.20}=0.20$. Using raw counts would give $4$, which is wrong.
For which reaction can raw particle counts be put straight into $K$?
الصعوبة 1/5 · 100 عملة + مكافأة صغيرة عند الإنجاز الأول اليوم
Only $\text{H}_2+\text{Cl}_2\rightleftharpoons2\text{HCl}$ has the same moles of gas on both sides (2 and 2), so the volume cancels.
For $\text{A}_2+\text{B}_2\rightleftharpoons2\text{AB}$, $K=4.0$. A new box holds 3 $\text{A}_2$, 1 $\text{B}_2$ and 4 AB. Is it at equilibrium? If not, which way does it shift?
- Moles of gas are equal on both sides, so counts can be used: $Q=\dfrac{4^2}{3\times1}=\dfrac{16}{3}=5.3$
- $Q>K$: too much product. The net reaction goes in reverse: some AB breaks into $\text{A}_2$ and $\text{B}_2$.
للدفاع $\text{A}_2+\text{B}_2\rightleftharpoons2\text{AB}$, $K=4.0$. A box holds 2 $\text{A}_2$, 2 $\text{B}_2$ and 2 AB. What happens?
الصعوبة 1/5 · 100 عملة + مكافأة صغيرة عند الإنجاز الأول اليوم
$Q=\dfrac{2^2}{2\times2}=1.0<4.0$, so more AB forms.
Reading a concentration–time graph
- Equilibrium starts where every line becomes flat. Read the flat heights as the equilibrium concentrations and put them into $K$.
- The sizes of the changes before that point follow the coefficients. A line that drops by $0.30$ while another rises by $0.60$ means a $1:2$ ratio, which helps you identify each curve.
On a concentration–time graph, where is equilibrium first reached?
الصعوبة 1/5 · 100 عملة + مكافأة صغيرة عند الإنجاز الأول اليوم
Equilibrium means constant concentrations, so the lines are flat. A crossing only means equal concentrations at that moment.
A sudden jump on the graph
- A vertical jump in one line means someone added (or removed) that substance. The other lines do not jump; they bend smoothly afterwards.
- After the jump the system shifts to use up part of what was added, and the lines flatten again at new heights. The new heights still give the same $K$ (same temperature).
After a substance is added, the new flat heights on the graph give a larger value of $K$.
الصعوبة 1/5 · 100 عملة + مكافأة صغيرة عند الإنجاز الأول اليوم
At the same temperature $K$ is unchanged. The new concentrations are different, but they give the same $K$.
On a graph for $\text{H}_2+\text{I}_2\rightleftharpoons2\text{HI}$, the lines are flat at $[\text{H}_2]=[\text{I}_2]=0.020\ \text{M}$ and $[\text{HI}]=0.14\ \text{M}$. Then the $\text{H}_2$ line jumps to $0.050\ \text{M}$.
- First equilibrium: $K=\dfrac{(0.14)^2}{(0.020)(0.020)}=49$.
- After the jump, $Q=\dfrac{(0.14)^2}{(0.050)(0.020)}=19.6<K$, so the net reaction goes forward. $[\text{I}_2]$ falls, $[\text{HI}]$ rises, $[\text{H}_2]$ drops back part of the way.
At equilibrium $[\text{A}]=0.50$ و $[\text{B}]=0.25\ \text{M}$ for $\text{A}\rightleftharpoons\text{B}$. Then $[\text{B}]$ jumps to $0.75\ \text{M}$. Calculate $Q$ right after the jump.
الصعوبة 2/5 · 140 عملة + مكافأة صغيرة عند الإنجاز الأول اليوم
$K=0.25/0.50=0.50$. Right after the jump $Q=0.75/0.50=1.5>K$, so the net reaction goes in reverse.
Do not use raw particle counts when the moles of gas differ on the two sides: convert to concentrations. On a graph, the equilibrium values are the flat parts, not where two lines cross. Crossing lines only mean the two concentrations are equal at that moment.
Particle diagrams and graphs are just data. Counts → concentrations (count × mol per particle ÷ volume) → $K$ or $Q$. On graphs, equilibrium is where all lines are flat; changes before that follow the coefficients; a vertical jump is an addition, after which the system shifts and settles at the same $K$.