| English | 释义 | 拼音 |
|---|---|---|
| pro-natalist/prəʊ ˈneɪtəlɪst/ | 鼓励生育 | gǔ lì shēng yù |
| anti-natalist/ˈænti ˈneɪtəlɪst/ | 限制生育 | xiàn zhì shēng yù |
One child, then two, then three
- In 1980, China limited most urban couples to one child, to slow population growth. In 2016 it allowed two children, and in 2021 three, because the population was ageing fast and births kept falling. In 2022, China's population began to shrink.
- Governments use population policies to change birth rates or migration. Some want more births, some fewer, and the results are often different from what was planned.
Pro-natalist policies
- Pro-natalist 鼓励生育 policies encourage more births. They are used where fertility is far below the replacement level of 2.1 and the population is ageing.
- Tools: cash payments per child, long paid parental leave, cheap childcare, tax cuts and housing priority for larger families. France has long used generous family benefits and has one of Europe's highest fertility rates (about 1.7–1.8); Hungary exempts mothers of four or more children from income tax for life.
In which country is a pro-natalist policy most likely?
难度 1/5 · 今日首次完成可获 100 金币及少量额外奖励
Fertility far below 2.1 means the population will age and shrink.
Anti-natalist policies
- Anti-natalist 限制生育 policies discourage births. They are used where rapid growth is seen to threaten jobs, food supply or development.
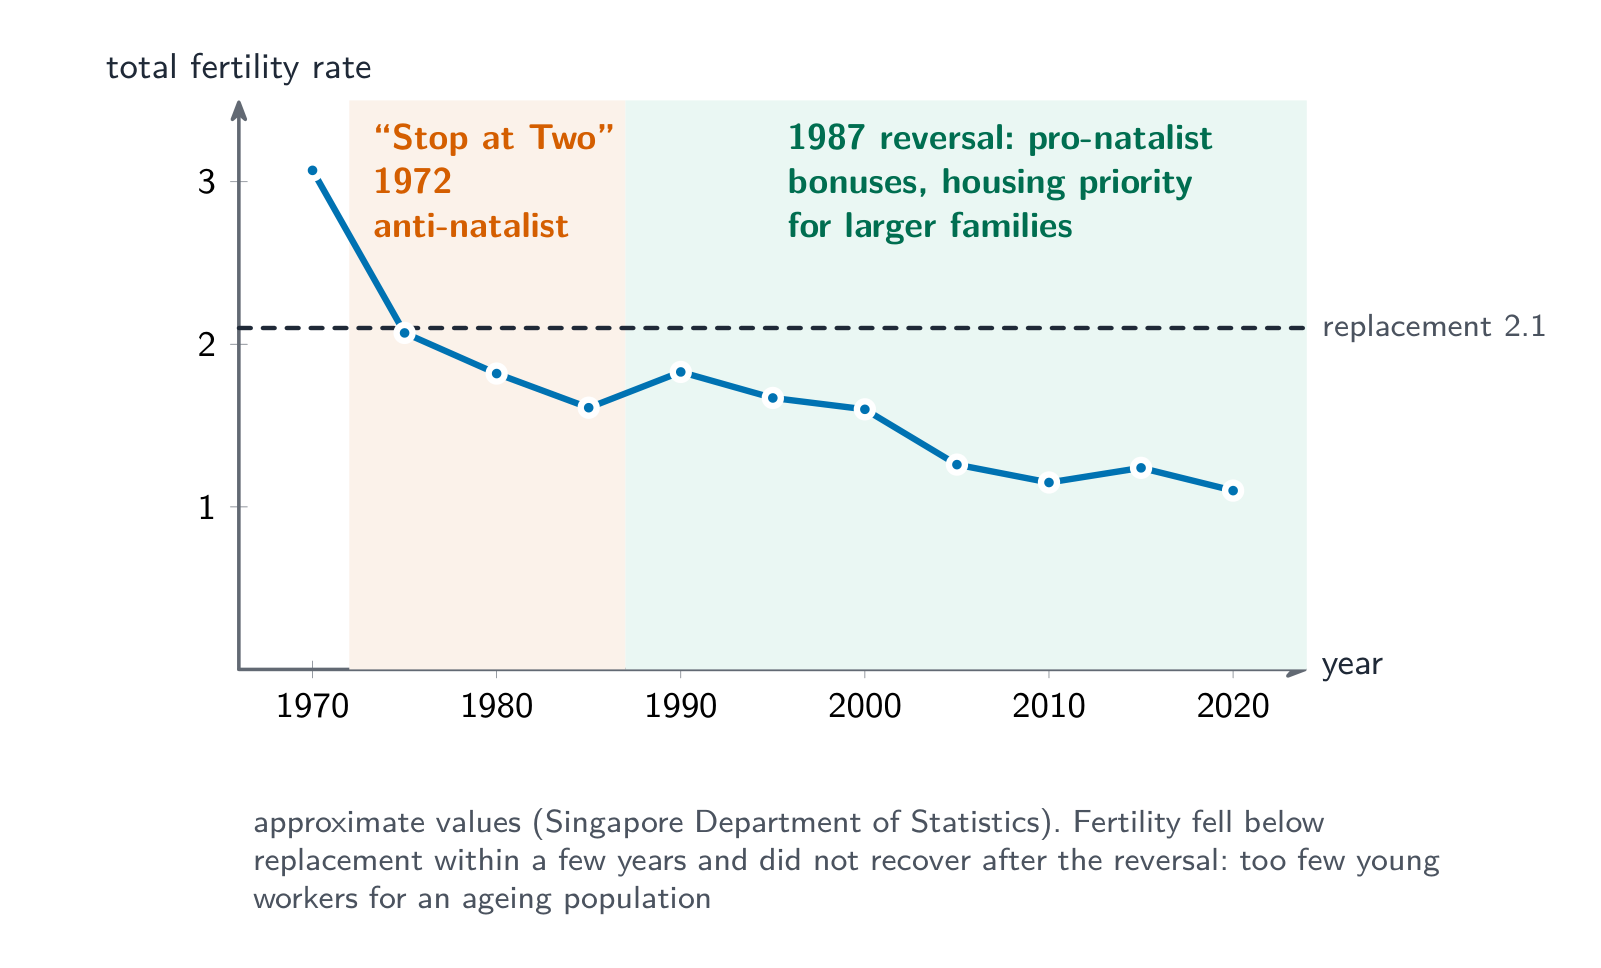
- Tools: family-planning education, free contraception, rewards for small families, and in some cases legal limits. Examples: China's one-child policy (1980–2015), Singapore's "Stop at Two" (1972), and India's family-planning campaigns, including forced sterilisations during the 1975–77 Emergency.
鼓励生育还是限制生育?
Sort each policy as pro-natalist (more births) or anti-natalist (fewer births).
Match each policy to its type.
难度 2/5 · 今日首次完成可获 140 金币及少量额外奖励
More births or fewer births.
Immigration policy
- Governments also change population through immigration policy. Canada admits about 400,000 or more permanent residents a year, partly to supply workers for an ageing population.
- Others restrict immigration: Japan has long admitted few migrants, so its working-age population shrinks faster.
Immigration policy can be used to slow the ageing of a population.
难度 1/5 · 今日首次完成可获 100 金币及少量额外奖励
Migrants are often young adults of working age.
Unintended consequences
| Policy | Intended | Unintended |
|---|---|---|
| China's one-child policy | slower growth | a male-heavy sex ratio (about 118 boys per 100 girls at birth around 2005) and rapid ageing |
| Singapore's "Stop at Two" | slower growth | fertility fell too far; reversed in 1987, but it kept falling |
| Pro-natalist cash payments | many more births | often only a small, short rise, because the cost of housing and education matters more |
Why did China's one-child policy lead to more boys than girls?
难度 1/5 · 今日首次完成可获 100 金币及少量额外奖励
With only one child allowed, son preference distorted the sex ratio.
Worked FRQ answer
(A) Describe ONE pro-natalist policy. A government pays parents a cash bonus for each child born, to encourage larger families.
(B) Explain why a country might adopt a pro-natalist policy. If fertility is well below 2.1, the population will age and shrink, so there will be too few young workers to fill jobs and pay taxes for pensions and health care.
(C) Explain ONE unintended consequence of China's one-child policy. Many families preferred sons, so sex-selective abortion led to far more boys than girls; millions of men now cannot find wives.
- Why it scores: (B) links low fertility to its economic effect; (C) explains the mechanism (son preference) behind the consequence.
Policies work slowly and through culture. Cash alone rarely raises fertility much, and strict limits can distort sex ratios. Explain why a policy did or did not work.
Pro-natalist policies encourage births in ageing countries (France, Hungary); anti-natalist policies discourage births where growth is fast (China 1980–2015, Singapore 1972, India). Immigration policy also shapes population. Policies often have unintended consequences: skewed sex ratios, overshooting and reversals.
Use the Singapore graph. (A) Describe the change in fertility after 1972. (B) Explain why the government reversed its policy in 1987. (C) Explain why fertility kept falling after the reversal.
Use the graph's numbers and explain the mechanism.