Representation of data
Đã giới thiệu| English | Ý nghĩa |
|---|---|
| stem-and-leaf/stem ænd liːf/ | biểu đồ thân lá |
| box-and-whisker/bɒks ænd ˈwɪskə/ | hộp và râu |
| quartile/ˈkwɔːtaɪl/ | tỷ lệ thức |
| histogram/ˈhɪstəɡræm/ | biểu đồ tần suất |
| cumulative frequency/ˈkjuːmjʊlətɪv ˈfriːkwənsi/ | tần số tích lũy |
| median/ˈmiːdiːən/ | trung vị |
| interquartile range/ˌɪntəˈkwɔːtaɪl reɪndʒ/ | phạm vi tứ phân vị |
| frequency density/ˈfriːkwənsi ˈdensɪti/ | mật độ tần suất |
| mean/miːn/ | trung bình cộng |
| mode/məʊd/ | mốt |
| standard deviation/ˈstændəd ˌdiːvɪˈeɪʃn/ | độ lệch chuẩn |
| variance/ˈveərɪəns/ | phương sai |
| outlier/ˈaʊtlaɪə/ | giá trị ngoại lai |
The diagram that changed history
- In 1854, John Snow mapped cholera deaths in London and spotted a cluster around one water pump. That diagram saved lives.
- Choosing the right statistical diagram is a skill — it reveals patterns that raw numbers hide.
Statistical diagrams
- Choose a diagram to suit the data:
- Stem-and-leaf 茎叶图 (keeps the values, shows shape),
- Box-and-whisker 箱线图 (lowest, three quartiles 四分位数, highest),
- Histogram 直方图 (grouped data — bar area = frequency),
- Cumulative frequency 累积频数 (running totals → median 中位数 and quartiles).

A cumulative frequency curve: read the median across from half the total, and the quartiles from a quarter and three-quarters
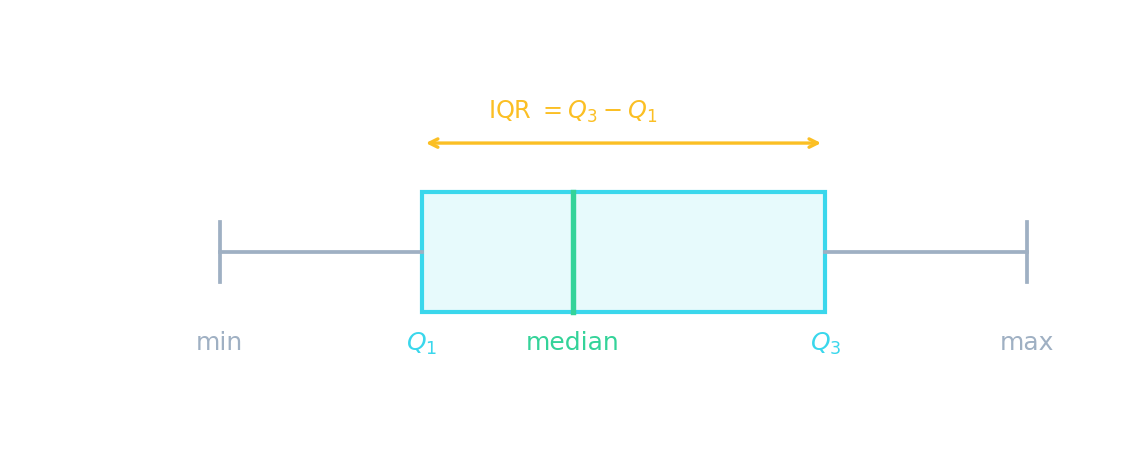
A box plot shows the five-number summary; the box spans the interquartile range 四分位距, IQR = Q₃ − Q₁.
Histogram vs bar chart. In a histogram, bars can have different widths and the area (not height) represents frequency. Frequency density 频率密度 $= \dfrac{\text{frequency}}{\text{class width}}$.
Histogram area = frequency, not height. When class widths are unequal, the vertical axis shows frequency density, not frequency. A tall narrow bar may represent fewer data points than a short wide one.
Spread and the bell
P(−k < Z < k)
Spread is measured in standard deviations — about 68% of data lies within 1 sd, 95% within 2.
In a histogram of grouped data, the frequency is shown by each bar's:
Độ khó 1/5 · 100 xu + một phần thưởng nhỏ cho lần hoàn thành đầu tiên trong ngày
In a histogram, the area of each bar represents the frequency.
In a histogram with unequal class widths, the height of each bar equals the frequency.
Độ khó 1/5 · 100 xu + một phần thưởng nhỏ cho lần hoàn thành đầu tiên trong ngày
With unequal widths, the height shows frequency density (frequency/width), not frequency. The area represents frequency.
Match each statistical diagram to what it best shows.
Độ khó 2/5 · 140 xu + một phần thưởng nhỏ cho lần hoàn thành đầu tiên trong ngày
A box plot shows quartiles and spread; a histogram uses bar area for frequency; cumulative frequency gives the median/quartiles; stem-and-leaf keeps the data values.
Averages and spread
- Central tendency: mean 平均数 $\bar{x} = \dfrac{\sum x}{n}$, median (middle), mode 众数 (most common).
- Spread: range, interquartile range, and standard deviation 标准差 $\sigma = \sqrt{\dfrac{\sum x^2}{n} - \bar{x}^2}$.
- Variance 方差 = $\sigma^2$.

A Venn diagram: the overlap is the intersection of two events
For 10 values with Σx = 50, what is the mean?
Độ khó 2/5 · 140 xu + một phần thưởng nhỏ cho lần hoàn thành đầu tiên trong ngày
Mean = Σx / n = 50 / 10 = 5.
For 10 values, Σx = 50 and Σx² = 300. What is the standard deviation? (√(Σx²/n − x̄²))
Độ khó 2/5 · 140 xu + một phần thưởng nhỏ cho lần hoàn thành đầu tiên trong ngày
σ = √(300/10 − 5²) = √(30 − 25) = √5 ≈ 2.24.
For the data 2, 4, 4, 4, 5, 5, 7, 9, what is the median?
Độ khó 2/5 · 140 xu + một phần thưởng nhỏ cho lần hoàn thành đầu tiên trong ngày
With 8 values, the median is the average of the 4th and 5th: (4 + 5)/2 = 4.5.
If the standard deviation is 3, what is the variance?
Độ khó 2/5 · 140 xu + một phần thưởng nhỏ cho lần hoàn thành đầu tiên trong ngày
Variance = σ² = 3² = 9.
Worked example — standard deviation
- Data: 2, 4, 4, 4, 5, 5, 7, 9. $n = 8$, $\sum x = 40$, $\sum x^2 = 232$.
- Mean $\bar{x} = \dfrac{40}{8} = 5$.
- Variance $= \dfrac{232}{8} - 5^2 = 29 - 25 = 4$.
- Standard deviation $\sigma = \sqrt{4} = 2$.
Choosing the right average
- Mean: uses all data, but affected by outliers 离群值.
- Median: not affected by outliers — good for skewed data (like salaries).
- Mode: useful for categorical data (most popular colour, most common shoe size).
- Display data with stem-and-leaf diagrams, box-and-whisker plots and cumulative frequency graphs, and measure its variation (spread).
You've got it
- diagrams: stem-and-leaf, box plot, histogram (area = frequency), cumulative frequency
- averages: mean, median, mode; spread: range, IQR, standard deviation
- $\sigma = \sqrt{\dfrac{\sum x^2}{n} - \bar{x}^2}$, and variance $= \sigma^2$
Write from a mean of 7
- The values are 4, 4, 8 and 12. A class of width 4 has frequency 12.
- Find the mean, the median and the frequency density.
For 4, 4, 8 and 12, what are the mean and the median? What is the frequency density of a class of width 4 with frequency 12?
28 divided by 4 is 7. The two middle values average to 6.
What is the mean?
Độ khó 1/5 · 100 xu + một phần thưởng nhỏ cho lần hoàn thành đầu tiên trong ngày
28 divided by 4 is 7. Other options — 5 (the lesson mean); 3 (the frequency density).