สไลด์ที่รองรับผู้บรรยาย
แนะนำใหม่| English | ความหมาย |
|---|---|
| bullet points/ˈbʊlɪt pɔɪnts/ | ข้อสังเกตหลัก |
| contrast/ˈkɒntræst/ | ความแตกต่างของสี |
| sans-serif/sænz ˈserɪf/ | แบบตัวอักษรไม่มีหัว |
| reference list/ˈrefrəns lɪst/ | รายการอ้างอิง |
Can the back row explain your chart?
- Your slide has correct numbers, but the audience cannot read the labels. Correct content still needs a usable presentation.
- Choose one main message and the evidence needed to understand it. Put detailed explanations in notes or a handout.
Let the title state a supported message
- Bullet points 要点 can cue the speaker; they do not need to reproduce the whole script. Keep connected information together when it supports one main idea.
- “18 of 30 respondents used the bus” states the finding. “Everyone prefers buses” goes beyond the data and changes a travel method into a preference.
สไลด์ของคุณรวมแผนภูมิการเดินทางของชั้นเรียนเข้ากับเมนูอาหารกลางวันโรงเรียนที่ไม่เกี่ยวข้องกัน การแก้ไขที่ดีที่สุดคืออะไร?
ความยาก 1/5 · 100 เหรียญ + บอนัสน้อยๆ เมื่อทำสำเร็จครั้งแรกในวันนี้
ข้อความหลักหนึ่งข้อช่วยให้ผู้ฟังติดตามหลักฐานได้ง่าย รายละเอียดสนับสนุนที่เกี่ยวข้องสามารถรวมอยู่ด้วยกันได้
สำหรับกลุ่มตัวอย่างในชั้นเรียนจำนวน 30 คน มี 18 คนที่ใช้รถบัส เปลี่ยนหัวข้อ “เส้นทางรถบัส” ด้วยข้อค้นพบที่ได้รับการสนับสนุน
ความยาก 3/5 · 200 เหรียญ + บอนัสน้อยๆ เมื่อทำสำเร็จครั้งแรกในวันนี้
ตัวอย่าง: “การเดินทางด้วยรถบัสเป็นวิธีที่พบบ่อยที่สุดในกลุ่มตัวอย่างของเรา” การระบุวิธีการเดินทางไม่ได้บ่งบอกถึงความชอบโดยตัวมันเอง
Choose the display for the question
- A table helps readers look up exact values; a chart helps compare values or see a pattern. Label the measure, units and source.
- For 30 fictional respondents: bus 18, walking 8, cycling 4. Start a bar chart at zero so bar lengths show the counts fairly.
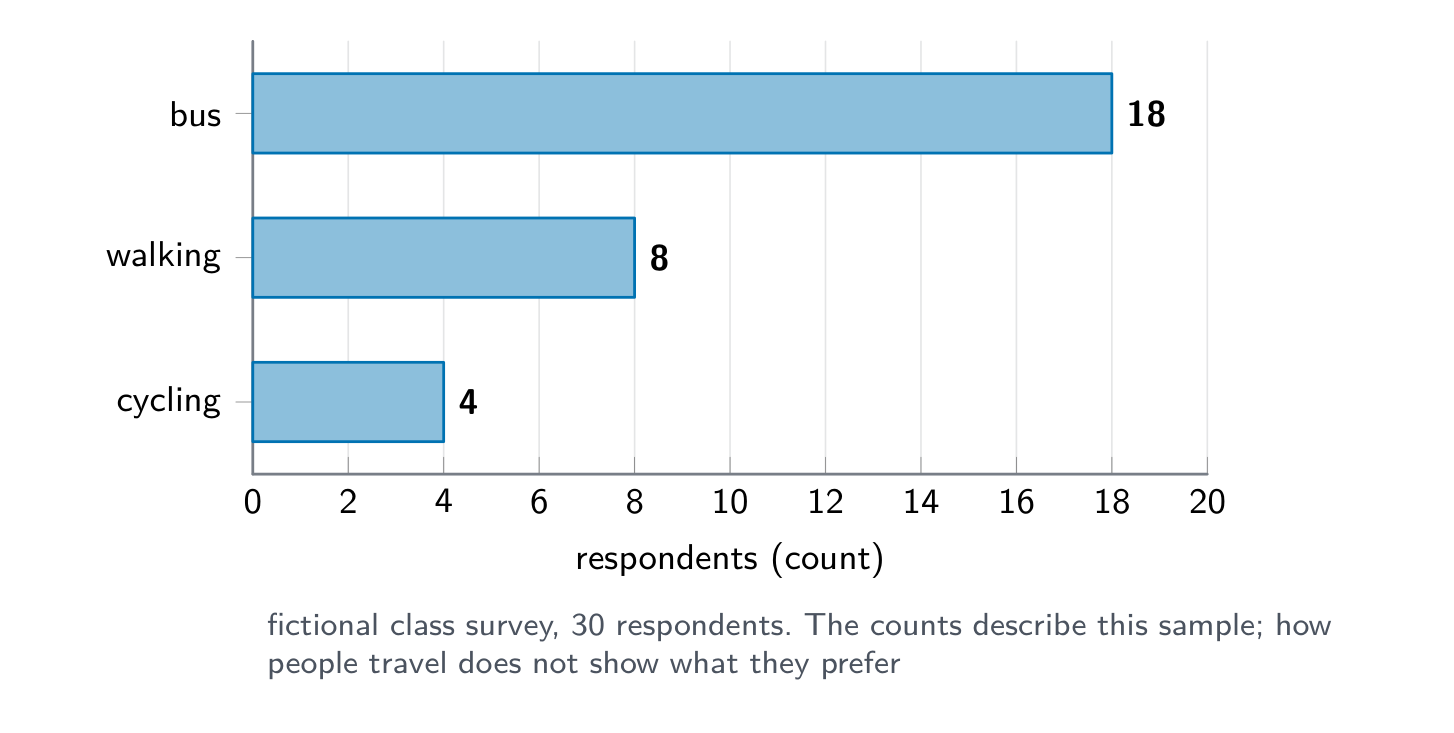
Useful title: “Bus travel was most common in our sample”. Say aloud: “18 of our 30 respondents used the bus. This is a class sample, not a city-wide result.” Keep the sample size visible.
คุณต้องการให้เพื่อนร่วมชั้นเปรียบเทียบจำนวนวิธีการเดินทางสามแบบได้อย่างรวดเร็ว Which display fits? (Which display fits?)
ความยาก 1/5 · 100 เหรียญ + บอนัสน้อยๆ เมื่อทำสำเร็จครั้งแรกในวันนี้
ความยาวของแท่งช่วยในการเปรียบเทียบจำนวนเมื่อมีฉลากและแกนฐานที่ชัดเจน
กราฟที่นำเสนอด้วยเสียงยังคงต้องการฉลากและหน่วยที่มองเห็นได้
ความยาก 1/5 · 100 เหรียญ + บอนัสน้อยๆ เมื่อทำสำเร็จครั้งแรกในวันนี้
ถูกต้อง ผู้ฟังแต่ละกลุ่มต้องการการเข้าถึงที่แตกต่างกัน; ฉลากที่อ่านได้และหน่วยช่วยสนับสนุนผู้ที่ไม่สามารถติดตามคำอธิบายด้วยเสียงได้
ผู้ตอบคำถามจำนวนเท่าใดใน总数 30 คน ที่เดินหรือขี่จักรยาน?
ความยาก 2/5 · 140 เหรียญ + บอนัสน้อยๆ เมื่อทำสำเร็จครั้งแรกในวันนี้
เดิน 8 คน บวกกับ ขี่จักรยาน 4 คน ได้ผู้ตอบทั้งหมด 12 คน
Test readability in the actual room
- Contrast 对比度 means enough difference between foreground and background. Both dark text on light and light text on dark can work; avoid using colour alone to distinguish groups.
- Try a simple sans-serif 无衬线 font and large text as a starting point. Test labels and source notes from the back row on the real projector; no single font size guarantees readability.
ข้อตรวจสอบใดบ้างที่มีประโยชน์ต่อสไลด์คาดการณ์ของคุณ? เลือกทุกข้อที่เกี่ยวข้อง
ความยาก 2/5 · 140 เหรียญ + บอนัสน้อยๆ เมื่อทำสำเร็จครั้งแรกในวันนี้
ขนาด ความคมชัด และสภาพแวดล้อมในการฉายมีผลต่อการอ่านข้อความ ป้ายหรือรูปทรงต้องสื่อถึงความแตกต่างได้ชัดเจนด้วย
Credit evidence without hiding it
- Put a short source beside the borrowed chart or image and full details in a reference list 参考文献列表. Check reuse permission separately; a citation does not grant it.
- Label your own data as your own, with sample size and collection context. Describe important visual information aloud for people who cannot see it clearly.
Selecting only the largest categories may hide part of the picture. If you combine small categories, label “other” and explain what it includes. Never omit values just to strengthen your message.
จับคู่ความต้องการของผู้ฟังแต่ละประเภทกับคำตอบที่เหมาะสม
ความยาก 2/5 · 140 เหรียญ + บอนัสน้อยๆ เมื่อทำสำเร็จครั้งแรกในวันนี้
การเลือกแสดงข้อมูล คำอธิบายผ่านเสียง และรายละเอียดแหล่งที่มา แก้ไขปัญหาที่แตกต่างกัน
Review the message, evidence and access
- Ask a partner to state the finding after viewing the slide. If they cannot, revise the title, labels or layout rather than shrinking the text.
- Make one slide from the sample data. Check its claim, all three categories, baseline, source note and readability before rehearsing.
Use a supported message, a suitable display and readable evidence. Explain the visual aloud and supply accessible materials where needed.
Further guidance: W3C accessible presentations.
สไลด์นี้ตัดข้อมูลการขี่จักรยาน (4) ออกไป ทำให้รถบัสดูเด่นเกินจริง คุณควรแก้ไขอย่างไร?
ความยาก 1/5 · 100 เหรียญ + บอนัสน้อยๆ เมื่อทำสำเร็จครั้งแรกในวันนี้
การตัดข้อมูลอาจทำให้ภาพรวมคลาดเคลื่อน ควรเก็บการเปรียบเทียบที่ครบถ้วนและอธิบายการจัดกลุ่มใดๆ ให้ชัดเจน