Elasticity: the pricing dial
Введено| English | Значение |
|---|---|
| price elasticity of demand/praɪs ɪlæˈstɪsɪti ɒv dɪˈmænd/ | The percentage change in quantity demanded divided by the percentage change in price. |
| income elasticity/ˈɪŋkʌm ɪlæˈstɪsɪti/ | The percentage change in quantity demanded divided by the percentage change in income, other factors unchanged. |
| cross elasticity/krɒs ɪlæˈstɪsɪti/ | cross elasticity |
Direction is not enough
- When the festival pushed the loaf from £4 to £5, Nimbus's takings ROSE. A taxi firm raising fares 25% the same week might see takings fall.
- Same size of price rise, opposite revenue outcome. Elasticity is the number that says which world you are in — and this lesson makes it the bakery's pricing dial.
The percentage ruler
- The price elasticity of demand 需求价格弹性 is $\varepsilon = \dfrac{\%\Delta Q}{\%\Delta P}$: how many percent quantity responds for each percent of price.
- Because it is a ratio of percentages it has no units, so bread and taxi rides and surgery can be compared on one ruler. On a demand curve it is negative; the minus sign is information, not decoration.
Read it off the bakery's demand
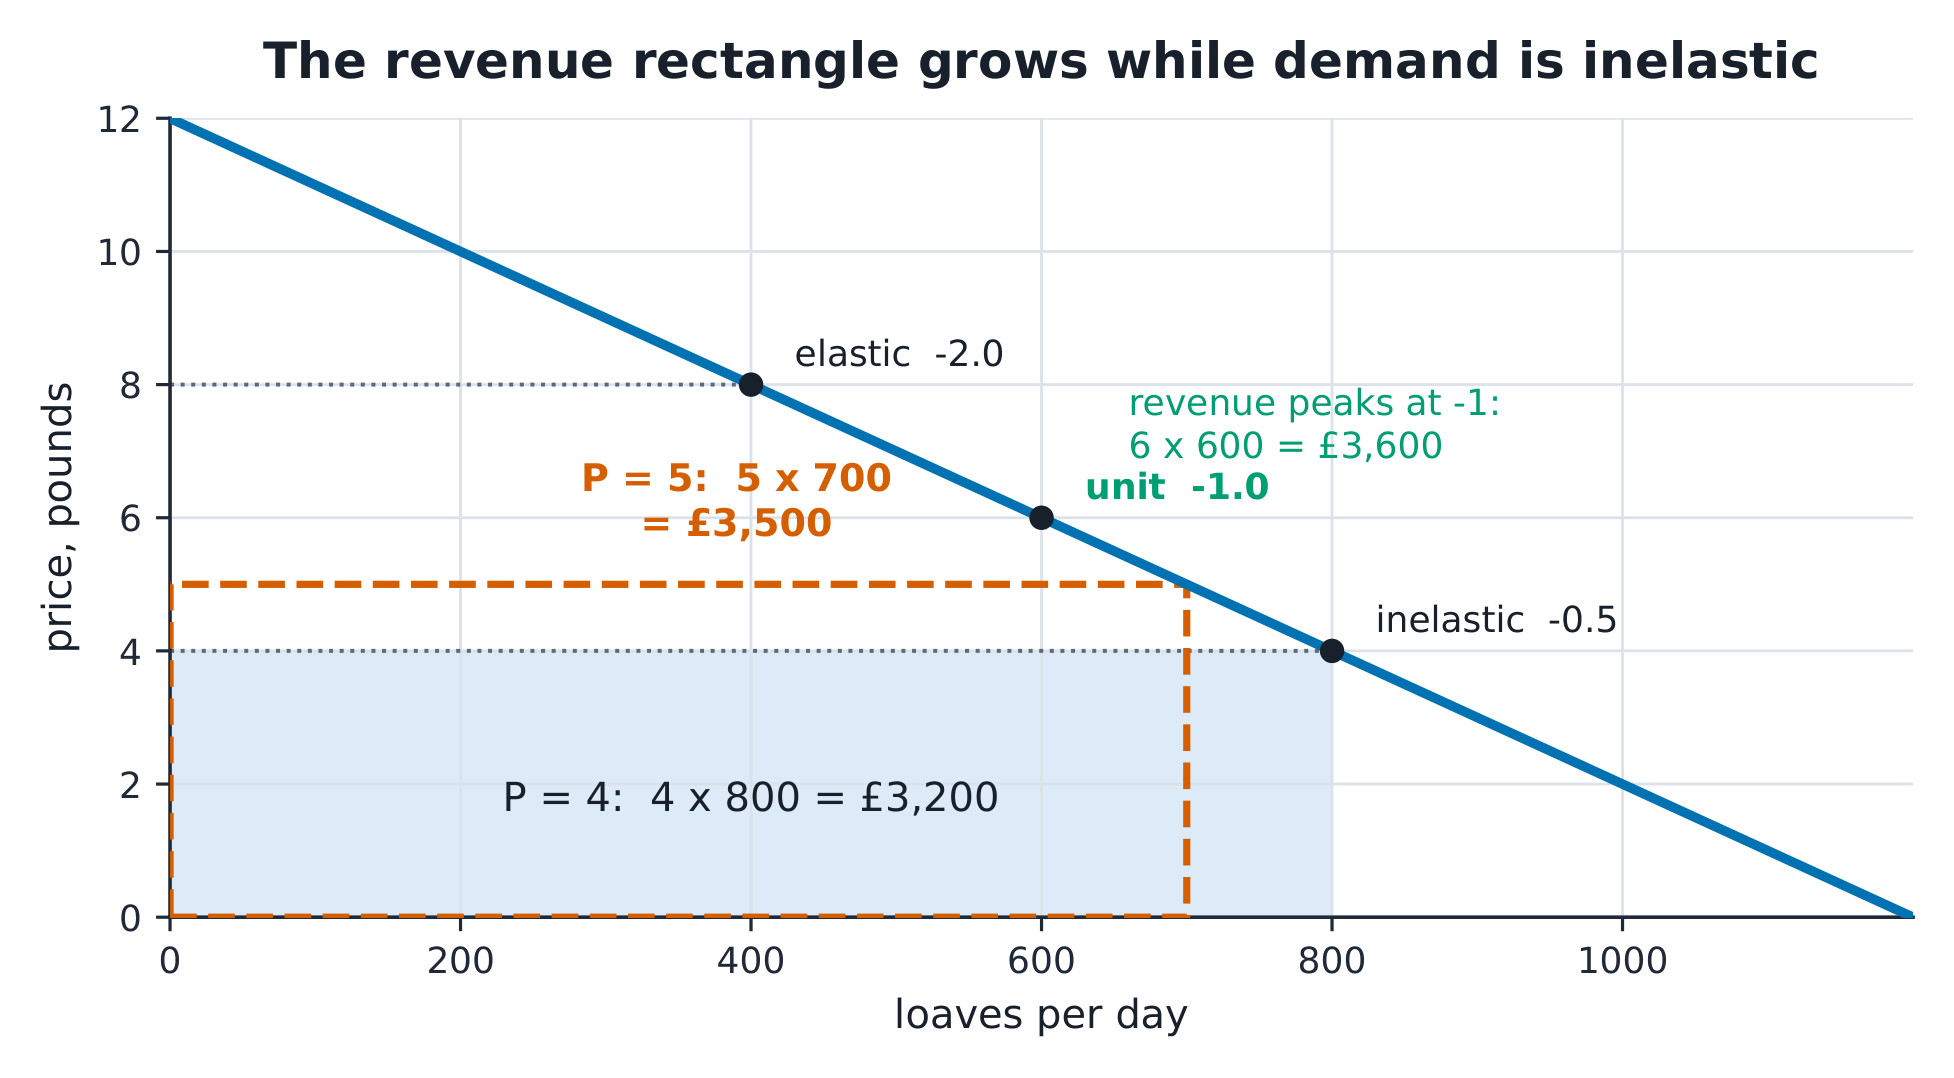
- On $Q_d = 1200 - 100P$ the point elasticity is $\varepsilon = -100 \cdot P/Q$: at £4 it is $-100 \times \tfrac{4}{800} = -0.5$.
- Walk up the curve: at £6, $\varepsilon = -1$; at £8, $\varepsilon = -2$; at £2, only $-0.2$. Elasticity is a property of POINTS, not of the whole curve.
Elastic, unit or inelastic at this price?
On Q = 1200 − 100P, the point elasticity is −100·P/Q. Classify each price point before predicting what a price change does to revenue.
On $Q_d = 1200 - 100P$ at the price £4 (Q = 800), what is the point elasticity? Give the value with its sign, to one decimal.
Сложность 2/5 · 140 монет + небольшой бонус за первое завершение сегодня
$\varepsilon = -100 \times \frac{4}{800} = -0.5$: quantity moves half as fast as price, in percentage terms.
The revenue rectangle
- Revenue is $P \times Q$ — a rectangle under the demand point. At £4: $4 \times 800 = £3{,}200$. At £5: $5 \times 700 = £3{,}500$. The rectangle GREW because quantity fell only 12.5% against a 25% price rise.
- That is the whole test: $|\varepsilon| < 1$ (inelastic) and the rectangle grows with price; $|\varepsilon| > 1$ (elastic) and it shrinks; $|\varepsilon| = 1$ (unit) and it is at its largest.
The loaf moves from £4 to £5 and quantity falls 800 → 700. What happened to revenue, and why?
Сложность 1/5 · 100 монет + небольшой бонус за первое завершение сегодня
Price rose 25% while quantity fell only 12.5% — the rectangle grew from 3,200 to 3,500. Costs are irrelevant to the revenue test.
The biggest rectangle sits at −1
- Push to £8 and revenue falls back to $8 \times 400 = £3{,}200$ — elastic territory. The maximum is where $\varepsilon = -1$: $-100P/(1200-100P) = -1$ gives $P = £6$, $Q = 600$, revenue $£3{,}600$.
- No business wants the unit point for its whole life — but every business should know which side of it, at today's price, it is standing on.
At which price is revenue at its maximum on this demand curve, in £?
Сложность 2/5 · 140 монет + небольшой бонус за первое завершение сегодня
Revenue peaks where $\varepsilon = -1$: $-100P/(1200-100P) = -1$ gives P = £6, Q = 600, revenue £3,600.
Two more elasticities, two more classifications
- Income elasticity 收入弹性: incomes rise 10% (from £4,000 to £4,400 a month) and quantity rises 15% (800 → 920): $1.5$ — positive and above 1, a normal good that is a luxury by budget share.
- Cross elasticity 交叉弹性: bread £4 → £5 and croissants fall 200 → 160; at midpoints that is $(-40/180)/(1/4.5) = -1.0$ — negative means complements, and strongly.
Incomes rise 10% and quantity rises 15%. What is the income elasticity?
Сложность 2/5 · 140 монет + небольшой бонус за первое завершение сегодня
$0.15/0.10 = 1.5$ — positive (a normal good) and above 1 (a luxury by budget share).
Bread £4 → £5 and croissant sales fall 200 → 160 (midpoint formula). The cross elasticity is −1. What does that make croissants?
Сложность 1/5 · 100 монет + небольшой бонус за первое завершение сегодня
Negative cross elasticity: when bread gets dearer, people buy less of the other good too — they go together. Substitutes would show a positive sign.
Match each elasticity to what it classifies.
Сложность 2/5 · 140 монет + небольшой бонус за первое завершение сегодня
Each elasticity has one classification job; the sign and size carry the verdict.
Three elasticity slips
- Using the slope. Slope depends on units (£ per loaf versus pence per loaf); elasticity does not.
- Quoting one elasticity for a whole linear curve. It runs from infinite at the top to zero at the bottom; always name the point.
- Dropping the minus sign and then mis-predicting. "Elasticity 0.5, so raise the price" happens to be right — by accident. Write −0.5, know demand falls, then conclude.
A firm facing inelastic demand at its current price should expect revenue to fall if it raises the price.
Сложность 1/5 · 100 монет + небольшой бонус за первое завершение сегодня
Inelastic means quantity falls proportionally less than price rises, so revenue RISES with price — the inelastic side is the safe side for a price increase.
Why quote elasticity instead of the demand curve's slope?
Сложность 1/5 · 100 монет + небольшой бонус за первое завершение сегодня
Slope depends on the units of both axes (pence versus pounds change it); the percentage ratio does not, which is the point of the concept.
Recap
- $\varepsilon = -bP/Q$ on $Q = a - bP$; it steepens as you climb the curve.
- Revenue grows with price while inelastic, peaks at −1, shrinks when elastic.
- Income elasticity classifies normal/luxury; cross elasticity classifies substitute/complement.