Carrying Out a Goodness-of-Fit Test (Extension)
Введено 7:48
Статистический вывод для категориальных данных: критерий хи-квадрат
Бросьте честную игральную кость шестьдесят раз. Каждая грань должна выпасть десять раз. Но этого никогда не происходит — здесь восемь, там тринадцать. Разрывы всегда присутствуют. Поэтому бросьте еще…
Озвучивание на английском · переключаемые субтитры на английском и китайском языках
In this lesson
| English | Значение |
|---|---|
| chi-square goodness-of-fit test | |
| chi-square statistic/kaɪ skweə stəˈtɪstɪk/ | статистика хи-квадрат |
Does the bag match the label?
- A garden centre sells a tulip mix labelled 40% red, 35% yellow, 25% white. A customer plants a random sample of 200 bulbs: 68 red, 82 yellow, 50 white. Is the label wrong, or is this just chance variation?
- A chi-square goodness-of-fit test 卡方拟合优度检验 answers this. (Goodness-of-fit is an extension beyond the revised AP exam; the same method is used in the two-way tests of 8.6, which are on the exam.)
The chi-square statistic
- For each category, compare the observed count with the expected count (what the claim predicts), then add up:
- Squaring makes every gap positive; dividing by the expected count scales it. So $\chi^2\ge0$, and a large $\chi^2$ means the data are far from the claim.
One category has observed 8, expected 10. Compute (observed − expected)²/expected.
Сложность 2/5 · 140 монет + небольшой бонус за первое завершение сегодня
(8−10)²/10 = 4/10 = 0.4.
A large chi-square statistic is evidence against the claimed distribution.
Сложность 1/5 · 100 монет + небольшой бонус за первое завершение сегодня
Big gaps → big χ² → evidence against H0.
In the chi-square formula, each denominator is the ___ count.
Сложность 1/5 · 100 монет + небольшой бонус за первое завершение сегодня
Divide the squared gap by the expected count.
The chi-square statistic can be negative.
Сложность 1/5 · 100 монет + небольшой бонус за первое завершение сегодня
It's a sum of squares over positive expecteds — always ≥ 0.
The p-value is a right-tail area
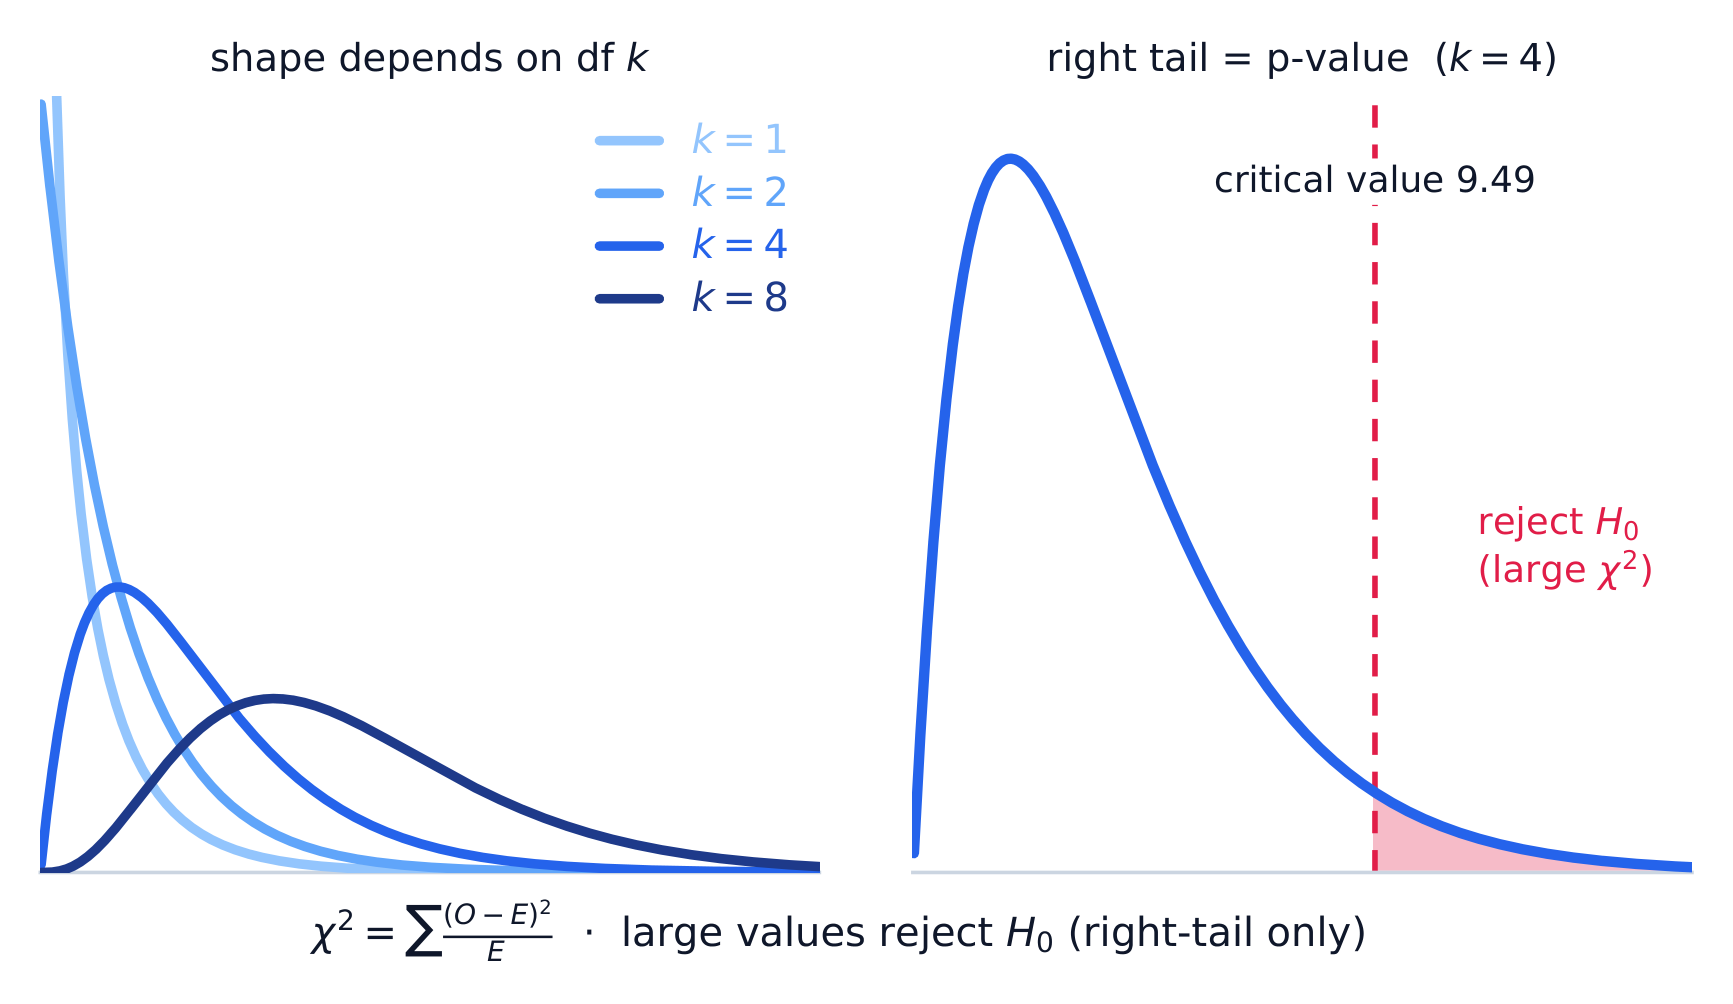
- If the claim is true, $\chi^2$ follows a chi-square distribution with $df=\text{number of categories}-1$. It is skewed right; its shape depends on df.
- The p-value is the area to the right of the observed $\chi^2$. Only large values are surprising, so the test is always right-tailed.
A chi-square test is...
Сложность 1/5 · 100 монет + небольшой бонус за первое завершение сегодня
Only large χ² is extreme → right tail only.
A goodness-of-fit test compares the colours of 300 candies with a claimed distribution over 6 colours. What are the degrees of freedom?
Сложность 2/5 · 140 монет + небольшой бонус за первое завершение сегодня
df = number of categories − 1 = 6 − 1 = 5. The sample size does not affect df.
Worked test: State and Plan
State. $H_0$: the colour distribution of the tulip mix is as labelled ($p_{\text{red}}=0.40$, $p_{\text{yellow}}=0.35$, $p_{\text{white}}=0.25$). $H_a$: at least one of these proportions is different. Use $\alpha=0.05$.
Plan. Chi-square test for goodness of fit.
- Random: the 200 bulbs are a random sample.
- 10%: 200 is less than 10% of all bulbs of this mix.
- Large counts: expected counts are $200(0.40)=80$, $200(0.35)=70$, $200(0.25)=50$, all at least 5.
A claim gives a category probability of 0.02. What is the smallest sample size that gives this category an ожидаемому count of at least 5?
Сложность 1/5 · 100 монет + небольшой бонус за первое завершение сегодня
Expected count = $n(0.02)\ge5$, so $n\ge250$.
Worked test: Do and Conclude
Do.
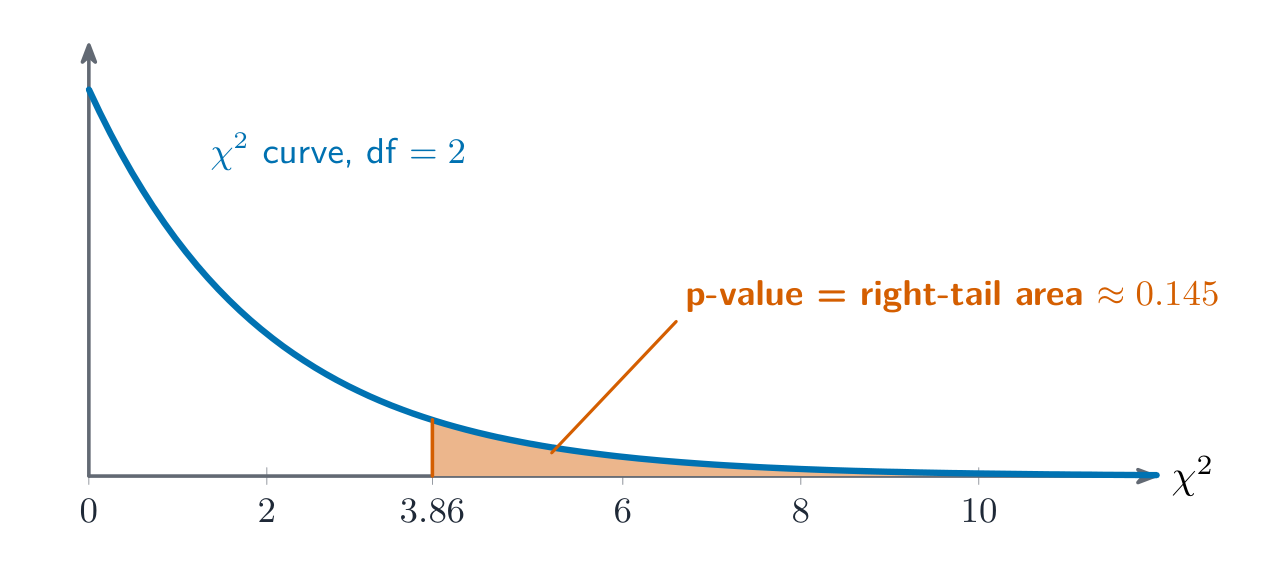
$df=3-1=2$, so p-value $=P(\chi^2_{2}\ge3.86)\approx0.145$.
Conclude. Because $0.145>0.05$, we fail to reject $H_0$. We do not have convincing evidence that the colour distribution of this tulip mix differs from the label.
The claimed distribution
Expected counts come from the null distribution's proportions.
A spinner should land on A, B and C equally often. In 90 spins: A 40, B 25, C 25. Calculate $\chi^2$.
Сложность 2/5 · 140 монет + небольшой бонус за первое завершение сегодня
Expected 30 each. $\frac{(40-30)^2}{30}+\frac{(25-30)^2}{30}+\frac{(25-30)^2}{30}=\frac{100+25+25}{30}=5$.
Follow-up: which category contributed most?
- Compare the terms: red 1.80, yellow 2.06, white 0. Yellow contributed most: the customer got 82 yellow bulbs when 70 were expected.
- Exam questions often ask this after a significant result, to say where the data differ from the claim.
Interpreting the p-value
- "Assuming the label is correct, there is about a 0.145 probability of getting a chi-square statistic of 3.86 or larger by chance in a random sample of 200 bulbs."
- The p-value is not the probability that the label is correct. It assumes $H_0$ is true.
A goodness-of-fit test gives p-value = 0.03. Which interpretation is correct?
Сложность 1/5 · 100 монет + небольшой бонус за первое завершение сегодня
A p-value is computed assuming $H_0$ is true. It is never the probability that $H_0$ is true.
How an FRQ is scored
- Hypotheses in context, with the claimed proportions.
- Test named and all three conditions checked: random, 10%, expected counts at least 5 (show the numbers).
- Mechanics: $\chi^2$, df and p-value all correct.
- Conclusion linked to the p-value and $\alpha$, in context, with no claim that $H_0$ is proved.
- Use counts, not percentages, in the formula, and the expected count in each denominator.
- Check expected counts, not observed counts, for the large-counts condition.
- Never double the tail. Chi-square p-values are right-tail areas only.
- "Fail to reject" is not "the label is correct"; it means the evidence is not strong enough to say it is wrong.
A chi-square goodness-of-fit test checks one categorical variable against a claimed distribution. $H_0$: the claimed proportions are correct. Conditions: random, 10%, all expected counts $\ge5$. $\chi^2=\sum\frac{(\text{O}-\text{E})^2}{\text{E}}$ with $df=\text{categories}-1$; the p-value is the right-tail area. Conclude in context, and look at the largest term to see where the data differ most.