Motion — speed, acceleration and graphs
Introduced| English | Meaning |
|---|---|
| speed/spiːd/ | The distance travelled per unit time. |
| velocity/vəˈlɒsɪti/ | The rate of change of displacement. |
| acceleration/əkˌseləˈreɪʃn/ | The rate of change of velocity. |
| deceleration/dɪˌseləˈreɪʃn/ | A decrease in speed over time. |
| gradient/ˈɡreɪdɪənt/ | The change in the vertical coordinate divided by the change in the horizontal coordinate. |
| free fall/friː fɔːl/ | Motion under gravity alone, with other forces neglected. |
| air resistance/eə rɪˈzɪstəns/ | A drag force opposing motion through air. |
| terminal velocity/ˈtɜːmɪnl vəˈlɒsɪti/ | A constant falling velocity reached when weight is balanced by resistance. |
How fast, and speeding 速率 up?
- A cheetah sprints at about $30\ \text{m/s}$; a passenger jet cruises near $250\ \text{m/s}$.
- Motion is about two ideas: how fast something goes, and how its speed changes.
- We describe both with simple formulas — and read them straight off graphs.
Speed and velocity 速度
- Speed is the distance travelled each second:
- Average speed uses the whole journey: $\dfrac{\text{total distance}}{\text{total time}}$.
- Velocity is speed in a stated direction — so velocity is a vector, speed is a scalar.
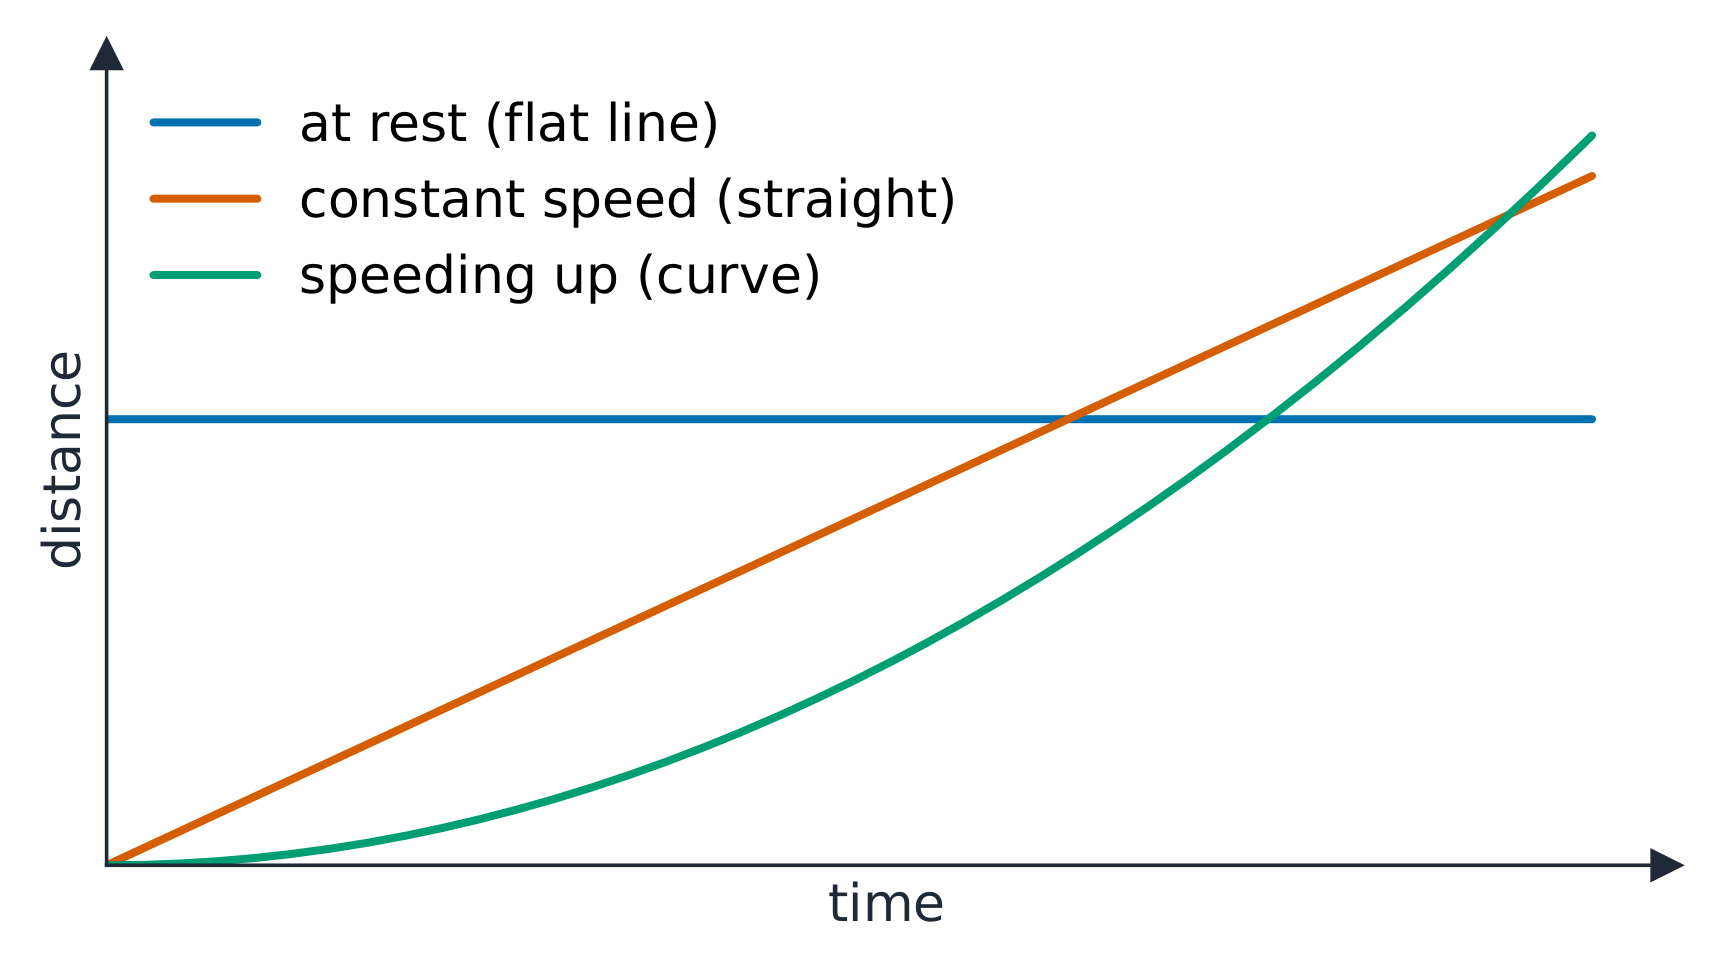
The shape of a distance-time line: flat = at rest, straight = constant speed, curve = speeding up
Speed, acceleration & graphs
v = u + at
On a speed–time graph the gradient is the acceleration and the area underneath is the distance travelled.
A runner covers $100\ \text{m}$ in $8.0\ \text{s}$. What is the average speed, in m/s?
Difficulty 2/5 · 140 coins + a small bonus on first completion today
$v = \dfrac{s}{t} = \dfrac{100}{8.0} = 12.5\ \text{m/s}$.
Acceleration 加速度
- Acceleration is how much the velocity changes each second:
- $\Delta v$ means "the change in velocity".
- Slowing down is a deceleration 减速 — a negative acceleration.
A car speeds up from rest to $20\ \text{m/s}$ in $4.0\ \text{s}$. What is its acceleration, in m/s²?
Difficulty 2/5 · 140 coins + a small bonus on first completion today
$a = \dfrac{\Delta v}{\Delta t} = \dfrac{20 - 0}{4.0} = 5.0\ \text{m/s}^2$.
Distance–time graphs
- A distance–time graph shows how far an object has gone.
- Flat line → the object is at rest.
- Straight slope → steady speed. The steeper the line, the faster it goes (the gradient 斜率 is the speed).
- Curve getting steeper → it is speeding up.
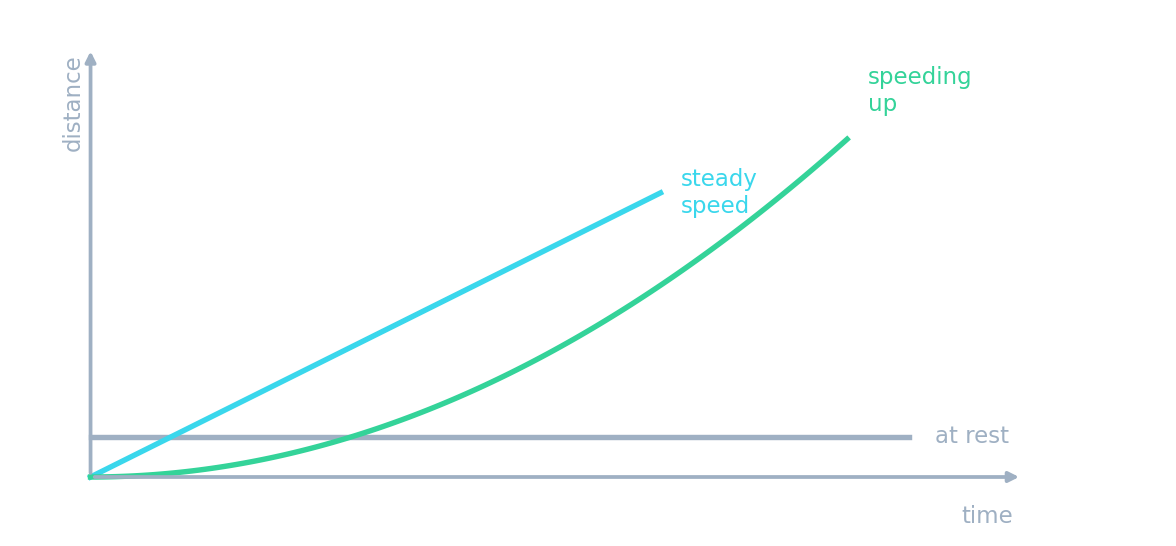
On a distance–time graph, a flat (horizontal) line means the object is:
Difficulty 1/5 · 100 coins + a small bonus on first completion today
A flat distance–time line means the distance is not changing — the object is at rest.
Speed–time graphs
- A speed–time graph shows how fast an object is going.
- Flat line → constant speed.
- Straight slope → constant acceleration (the gradient is the acceleration).
- Area under the line → the distance travelled.
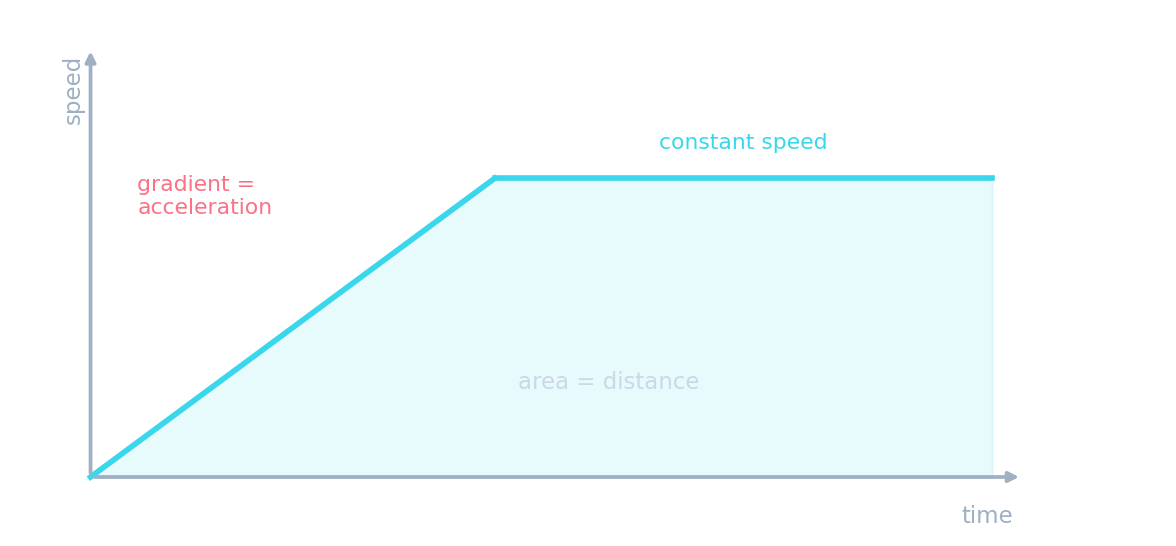
On a speed–time graph, the area under the line is the distance travelled.
Difficulty 1/5 · 100 coins + a small bonus on first completion today
Speed × time = distance, and that is exactly the area under a speed–time line.
A car travels at a constant $10\ \text{m/s}$ for $6.0\ \text{s}$. From the speed–time graph (area), how far does it go, in m?
Difficulty 2/5 · 140 coins + a small bonus on first completion today
The area is a rectangle: $10 \times 6.0 = 60\ \text{m}$.
Falling objects
- Near the Earth, all objects speed up as they fall at the same rate: the acceleration of free fall 自由落体, $g \approx 9.8\ \text{m/s}^2$.
- Falling through air, air resistance 空气阻力 pushes up and grows as the object speeds up.
- When air resistance equals the weight, the resultant force is zero — the object stops speeding up and falls at a steady terminal velocity 收尾速度.
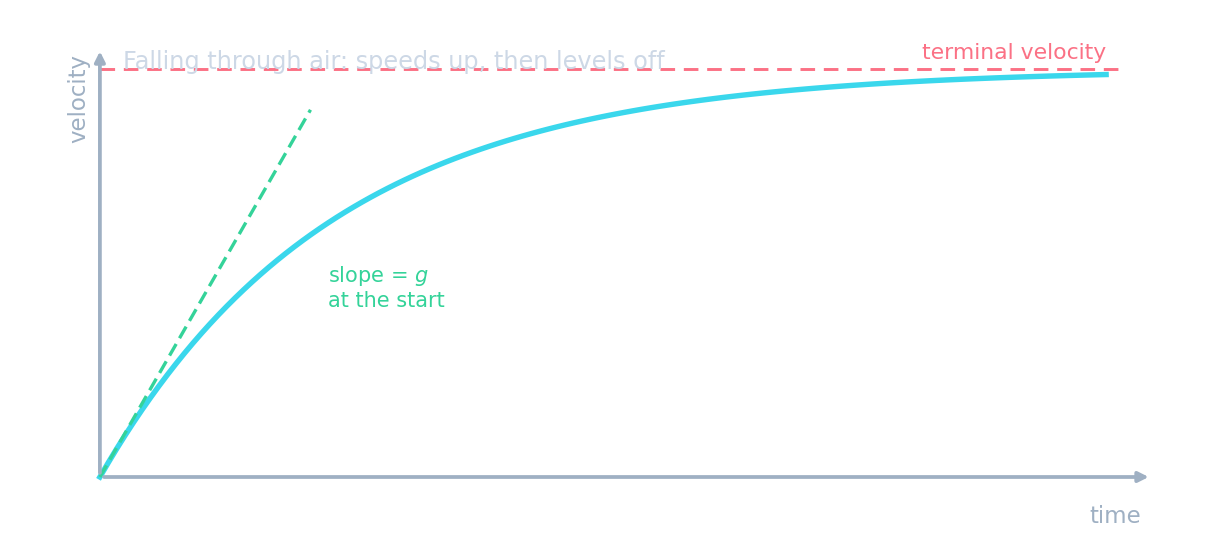
A skydiver reaches terminal velocity. This happens because:
Difficulty 1/5 · 100 coins + a small bonus on first completion today
As speed rises, air resistance grows until it balances the weight. The resultant force is then zero, so the speed stays steady.
You've got it
- speed $v = \dfrac{s}{t}$; velocity is speed with a direction
- acceleration $a = \dfrac{\Delta v}{\Delta t}$; slowing down is negative
- distance–time: gradient = speed · speed–time: gradient = acceleration, area = distance
- free fall: $g \approx 9.8\ \text{m/s}^2$; terminal velocity when air resistance = weight