Land, food and resource decisions
Introduced| English | Meaning |
|---|---|
| erosion/ɪˈrəʊʒn/ | The removal and transport of soil or rock material by agents such as flowing water, wind, ice or gravity. |
| resource/rɪˈzɔːs/ | An input, asset or source of support that can be used to meet needs or achieve an objective. |
| food security/fuːd sɪˈkjʊərɪti/ | Reliable access to enough safe, nutritious food for an active and healthy life. |
| leaching | The washing of dissolved nutrients or minerals down through soil by water. |
| biomass/ˌbaɪəʊˈmæs/ | Organic material of living or recently living organisms, measured as mass in an ecological system and also usable as a fuel. |
| horizon | A distinct horizontal layer in a soil profile. |
| loam/ləʊm/ | A fertile soil with a balanced mixture of sand, silt and clay. |
| weathering/ˈweðərɪŋ/ | The physical breakdown or chemical alteration of rock at or near the Earth's surface, without transport being required. |
| salinisation | The build-up of salts in soil, often caused by irrigation in dry climates. |
| desertification/dɪˌzɜːtɪfɪˈkeɪʃn/ | The degradation of dryland environments that reduces their productivity and vegetation cover. |
| wind/wɪnd/ | wind |
| cover crop | A crop grown between main crops to protect soil, reduce erosion and add nutrients or organic matter. |
| solar/ˈsəʊlə/ | Using energy from the Sun, as in photovoltaic panels and solar heating. |
| Green Revolution/ɡriːn ˌrevəˈluːʃn/ | The twentieth-century expansion of crop yields through high-yielding varieties supported by irrigation, fertilisers, pest control and changed farming practices. |
| integrated pest management/ˈɪntɪɡreɪtɪd pest ˈmænɪdʒmənt/ | Controlling pests by combining biological, cultural and physical methods, with chemicals used only as needed. |
| agroforestry | Growing trees together with crops or livestock on the same land. |
| sustainable intensification | Raising yields from existing farmland while reducing environmental harm. |
| natural resource | Any material or energy source from nature that people use. |
| natural capital | The stock of natural resources and ecosystems that yields goods and services. |
| natural income | The annual yield of goods and services that natural capital provides. |
| substitution/ˌsʌbstɪˈtjuːʃn/ | Replacing one good, input or activity with another to meet a need or perform a function. |
| recycling | Processing waste materials so they can be made into new products. |
| nuclear/ˈnjuːklɪə/ | Energy associated with the arrangement of particles in atomic nuclei. |
| microplastics/ˌmaɪkrəʊˈplæstɪks/ | Plastic pieces smaller than 5 mm that persist in the environment. |
| leachate/ˈliːtʃeɪt/ | The contaminated liquid that drains through waste in a landfill. |
| landfill/ˈlændfɪl/ | A site where waste is buried in the ground, usually in lined cells. |
| incineration/ɪnˌsɪnəˈreɪʃn/ | The burning of waste at high temperature, sometimes with energy recovery. |
| composting/ˈkɒmpɒstɪŋ/ | Controlled decomposition of organic waste by microorganisms to produce a soil improver. |
What would explain this observation?
- A farm can increase yield while increasing soil loss or water demand. Food-system evaluation requires more than tonnes harvested.
Build the model
- Soil supports nutrient cycling, water storage and organisms.
- Erosion 侵蚀 removes soil; nutrient depletion changes fertility.
- Resource 资源 use involves extraction, production, distribution and waste.
- erosion: Removal and transport of soil or rock.
- resource: A material or service used to meet needs.

Which comparison measures land productivity?
Difficulty 1/5 · 100 coins + a small bonus on first completion today
Productivity is output per unit of input, here harvest per hectare. A large total harvest can hide poor land productivity, and a price says nothing about how much the land produced.
Match each technical term to its precise meaning.
Difficulty 2/5 · 140 coins + a small bonus on first completion today
Use the definitions to distinguish related quantities and processes.
Choose evidence that can test it
- Distinguish total yield from yield per area and energy input.
- Sustainable management must consider regeneration rates and impacts beyond the farm boundary.
- Different stakeholders may rank food security, biodiversity and income differently.
In the lab: Compare management options using a stated functional unit and the same timescale. Use approved secondary datasets or non-destructive soil observations. Explain trade-offs instead of claiming a method has no disadvantages.
Which two habits make the investigation or model in this case more defensible?
Difficulty 2/5 · 140 coins + a small bonus on first completion today
Stating the conditions and assumptions lets others repeat the work exactly, and recording the supporting evidence lets them check the conclusion. Hiding disagreeing results removes the evidence that could challenge a wrong conclusion, and one measurement can never establish a wider claim.
Work from known quantities
- Known: farm A harvests 18 tonnes from 6 hectares.
- Yield per area = 18/6 = 3 tonnes per hectare.
- Farm B harvests 20 tonnes from 10 hectares, so its yield is 2 tonnes per hectare despite a larger total harvest.
Your turn: A farm harvests 28 tonnes from 7 hectares. Find yield per hectare.
A farm harvests 28 tonnes from 7 hectares. Find yield per hectare.
Difficulty 2/5 · 140 coins + a small bonus on first completion today
The result is 4 t/ha. Known: harvest 28 tonnes from 7 hectares. Use yield = harvest / area. Yield = 28/7 = 4 tonnes per hectare. Per-area yield, not total harvest, is the productivity measure.
Check the conclusion and its limits
- A high yield is not proof of long-term soil health.
- Renewable resources can be depleted when use exceeds regeneration.
Not true: A renewable resource cannot be depleted. Renewable means a resource can regenerate, not that regeneration exceeds every rate of use. Fish stocks can be depleted when harvest exceeds renewal. Soil formation can be so slow that soil is effectively non-renewable on human planning timescales.
- Soil supports nutrient cycling, water storage and organisms.
- Distinguish total yield from yield per area and energy input.
- Watch for: A high yield is not proof of long-term soil health.
Renewable means a resource can regenerate, not that regeneration exceeds every rate of use.
Difficulty 1/5 · 100 coins + a small bonus on first completion today
True. Renewable means a resource can regenerate, not that regeneration exceeds every rate of use. Fish stocks can be depleted when harvest exceeds renewal. Soil formation can be so slow that soil is effectively non-renewable on human planning timescales.
Removal and transport of soil or rock: write the technical term.
Difficulty 1/5 · 100 coins + a small bonus on first completion today
erosion means Removal and transport of soil or rock.
Write from a yield of 5 tonnes per hectare
- A farm harvests 40 tonnes from 8 hectares.
- Find the yield per hectare. A renewable resource can still be depleted.
A farm harvests 40 tonnes from 8 hectares. What is the yield per hectare, and why can a renewable resource still be depleted?
Yield per hectare is harvest divided by area. Renewable describes regeneration, not immunity to overuse.
A farm harvests 40 tonnes from 8 hectares in one season. What is its yield per hectare?
Difficulty 1/5 · 100 coins + a small bonus on first completion today
Yield per hectare = harvest/area = 40 tonnes/8 ha = 5 tonnes/ha. The 40 tonnes is total harvest and 8 ha is area; neither alone is yield per hectare.
Set the soil-system boundary
- Soil contains minerals, organic matter, organisms, water and air. Litter, rainfall, deposition and weathered material can enter; plant uptake, erosion 侵蚀, leaching 淋溶, evaporation and respiratory carbon dioxide can leave. Heat is an energy output, not a material nutrient.
- Classify a flow against the boundary: water moving between two soil layers is an internal transfer if both are inside. Decomposition transforms organic compounds and releases nutrients; fragmentation by animals is a different process. A flow diagram should distinguish stores from arrows and matter from energy.
Which is an energy output rather than a mineral nutrient?
Difficulty 1/5 · 100 coins + a small bonus on first completion today
Matter and energy have different roles in the soil-system diagram.
Connect soil life to nutrient supply
- Detritivores fragment litter, while bacteria and fungi chemically decompose organic material. Mineralisation makes inorganic nutrient forms available; organisms can also temporarily retain nutrients in their biomass 生物量. Uptake, leaching 淋溶 and gaseous losses mean this nutrient cycle is not perfectly closed.
- Soil supplies roots with water and mineral nutrients such as nitrogen, phosphorus and potassium. Most plant carbon comes from atmospheric carbon dioxide. Earthworms mix some soils, but are not present or beneficial in every ecosystem. More organisms alone does not identify every function or prove a particular crop yield.
Where do plants obtain most of their carbon?
Difficulty 1/5 · 100 coins + a small bonus on first completion today
Soil supplies water and many mineral nutrients; photosynthesis incorporates atmospheric carbon.
Read a simplified profile cautiously
- A profile can show surface organic material, an upper mixed mineral–organic layer, altered subsoil, parent material and underlying rock. The familiar O, A, B, C and R diagram is a model: horizons 土层 can be absent, additional layers can occur, and thickness and colour vary.
- A dark upper layer often supports many roots and organisms, while some subsoils accumulate clay or iron compounds. The B horizon 土层 need not always be lighter. Parent material can be transported sediment rather than rock weathered directly underneath. Do not identify a complete soil type from one colour alone.
Does every real profile contain every pictured horizon?
Difficulty 1/5 · 100 coins + a small bonus on first completion today
A simplified profile is not a universal field observation.
Compare texture with structure
- Texture describes proportions of mineral-size fractions. Under the USDA boundaries used here, sand is 0.05–2 mm, silt is 0.002–less-than-0.05 mm and clay is below 0.002 mm. Organic matter affects behaviour but is not a fourth mineral-size fraction.
- Structure describes aggregation and pores. Sand-rich soils often drain rapidly; clay-rich soils can retain much water but drain slowly. Loamy texture can balance properties, yet crop, climate, compaction, pH and organic matter affect suitability. “Loam 壤土 is always best” replaces evaluation with an unsupported rule.
What distinguishes texture from structure?
Difficulty 1/5 · 100 coins + a small bonus on first completion today
Organic matter can alter aggregation without being another mineral-size fraction.
Compare formation and loss rates
- Soil forms through weathering 风化, biological activity and accumulation over time. Rates vary with climate, material, landscape and organisms. Organic matter and surface structure can improve before a full lost soil depth is rebuilt; rapid visible greening is not proof of complete profile recovery.
- A resource can regenerate while use exceeds renewal. For soil, slow formation often makes it effectively non-renewable over human planning periods. State the timescale rather than claiming either that no soil ever forms or that the word renewable makes every loss sustainable.
Why can soil be treated as effectively non-renewable in planning?
Difficulty 1/5 · 100 coins + a small bonus on first completion today
State the formation/loss rates and planning timescale.
Distinguish a carbon store from a sink
- A carbon store is an amount held at a time. A net sink has inputs greater than outputs over a stated interval; a source has outputs greater than inputs. Soil may contain much carbon while losing some every year through respiration, erosion or drainage-related change.
- Temperature, moisture, oxygen supply and litter inputs affect the balance. Wet or cold conditions can slow decay; warming, drainage or disturbance can alter losses. Tundra cold and wetland oxygen limitation can slow decay; grassland roots add carbon. Warm, aerated tropical mineral soils can cycle carbon quickly, but tropical peat is a major exception. Specify depth and carbon form before comparing inventories. A larger measured stock does not alone identify the cause.
Can a large carbon store be a net source in a particular year?
Difficulty 1/5 · 100 coins + a small bonus on first completion today
Stock size and net flow are distinct quantities.
Why should a blanket claim that all tropical soils hold little carbon be avoided?
Difficulty 1/5 · 100 coins + a small bonus on first completion today
Climate, drainage, inputs, depth and soil type interact.
Trace different forms of degradation
- Erosion removes material; compaction alters pores; harvest without replacement depletes nutrients; pollution adds harmful substances. Salinisation 盐碱化 can follow salt inputs and evaporation where drainage is inadequate. High salt concentration lowers soil-water potential, making root water uptake harder, and some ions can be toxic.
- Desertification 荒漠化 concerns degradation in dryland regions; dunes need not appear. Loss of cover, heavy rainfall, wind 风, slopes, poor aggregation and management interact. Fertiliser can replace some nutrients without replacing lost depth, structure or habitat, so a yield recovery does not prove every soil function has recovered.
How can salinity reduce crop water uptake?
Difficulty 1/5 · 100 coins + a small bonus on first completion today
Osmotic effects and specific-ion toxicity are distinct pathways.
Match conservation to the mechanism
- Contour cultivation runs across a slope along equal-height contours; terraces shorten slopes and slow runoff. Cover crops 覆盖作物 and mulch protect the surface; windbreaks reduce wind exposure. Methods need suitable design, maintenance and local rainfall conditions rather than a promise that erosion becomes zero.
- Legume rotations can supply nitrogen through symbiotic bacteria; plants do not perform nitrogen fixation themselves. No-till reduces disturbance but can have weed-management trade-offs. Drip irrigation alone does not remove accumulated salts: water quality, appropriate leaching and drainage matter, with consequences for downstream nutrient losses.
Which describes contour cultivation?
Difficulty 1/5 · 100 coins + a small bonus on first completion today
Furrows can slow runoff; design and local conditions still matter.
Use restoration cases with limits
- The Loess Plateau projects combined terraces, vegetation restoration and changed grazing with livelihood measures in selected watersheds. Reduced erosion is a measurable outcome; it does not show that every site recovered equally. Soil depth, water balance, livelihoods and maintenance need longer-term assessment.
- In the 1930s US Dust Bowl, drought interacted with exposed cultivated soils and wind erosion. Windbreaks, contour practices and grass cover addressed pathways rather than controlling the weather itself. A case study should connect the original pressure, mechanism, intervention and evidence, not imply one measure solved every problem.
Does visible greening prove full lost soil depth has recovered?
Difficulty 1/5 · 100 coins + a small bonus on first completion today
Measure distinct outcomes rather than equating them.
Classify farming on independent dimensions
- Arable systems grow crops, pastoral systems raise animals and mixed systems do both. Intensive and extensive describe inputs per area; subsistence and commercial describe the main destination or purpose of output. Irrigated/rain-fed and organic/conventional are further dimensions, not synonyms for farm size.
- A commercial farm can be organic or small; a subsistence household can sell some surplus. Intensive need not mean large total area. Land capability constrains choices: some slopes or dry areas cannot support the same crops as deep, well-watered soils, but grazing there still has environmental limits.
Can a commercial farm be organic?
Difficulty 1/5 · 100 coins + a small bonus on first completion today
Purpose, area intensity and input standards are separate classifications.
Compare Honghe and Iowa systems
- Honghe Hani rice terraces in Yunnan integrate forests, villages, water management and terraced rice production. Fish and domestic animals can provide additional food and recycle nutrients. Skilled labour, shared water rules and maintenance matter; traditional practices still face market, livelihood and ecological pressures.
- Iowa maize–soybean systems illustrate commercial temperate row cropping. Machinery, nutrient inputs, drainage and markets can support output, while cover crops 覆盖作物 and altered tillage address losses. Compare terrain, climate, water, labour, outputs and pollution; neither case proves that every farm in its region works identically.
Which comparison is defensible?
Difficulty 1/5 · 100 coins + a small bonus on first completion today
Named contexts need mechanisms and comparable measures.
Keep harvest and area yield distinct
- Invented farm X harvests 35 tonnes from 7 ha: yield is 5 tonnes/ha. Farm Y harvests 48 tonnes from 16 ha: yield is 3 tonnes/ha. Y has greater total harvest, while X has greater area yield; both statements can be true.
- Specify crop, edible fraction, moisture basis and period. Per harvest and per year differ where multiple crops are grown. Tonnes, food energy, protein, revenue and profit answer different questions. A fair comparison uses the functional unit needed for the decision rather than whichever number favours one farm.
Farm X harvests 35 tonnes from 7 ha. Find area yield.
Difficulty 2/5 · 140 coins + a small bonus on first completion today
35/7=5; the total harvest is a different quantity.
Define the energy-accounting boundary
- An invented farm produces 45,000 MJ of food energy using 3000 MJ of counted inputs, with solar 太阳能 energy excluded: output/input ratio is 15. Another produces 50,000 MJ using 20,000 MJ: ratio is 2.5. These ratios do not directly compare nutritional balance or profitability.
- Solar energy is excluded from the denominator, so a ratio above one does not violate energy conservation. Count labour, fuel, fertiliser manufacture and machinery consistently in both systems. Calling this a complete thermodynamic conversion efficiency would hide the missing energy input.
Invented food-energy output is 45000 MJ and counted non-solar input is 3000 MJ. Find output/input ratio.
Difficulty 2/5 · 140 coins + a small bonus on first completion today
45000/3000=15. Solar input is excluded, so this is not a complete thermodynamic efficiency.
Match mobility and fallows to recovery
- Nomadic pastoralism can follow seasonal forage and water where routes remain accessible. Restrictions or permanent concentration can increase local pressure. Traditional use is not automatically sustainable: compare stocking, rainfall, access and recovery rather than judging only the cultural label.
- Shifting cultivation with long fallows can allow vegetation and soil recovery; shortened fallows under land pressure can prevent it. Burning, nutrient release, subsequent harvest and erosion follow different pathways. A system’s viability depends on extraction and renewal rates and land rights, not simply its age.
Why can shortening fallows reduce sustainability?
Difficulty 1/5 · 100 coins + a small bonus on first completion today
Assess recovery, land access and actual pressure rather than the label.
Evaluate the Green Revolution 绿色革命
- High-yielding varieties combined with irrigation, nutrients and pest control increased harvests in many settings. Response differed among regions and farmers. Better availability can support food security 粮食安全, but increased yield alone does not guarantee access for poorer households or prevent conversion of further land.
- Water demand, salinity, nutrient losses, pesticide impacts and crop diversity require evaluation. Access to seed, credit, irrigation and markets affects who benefits. Conventional synthetic nitrogen often relies on fossil energy; lower-carbon production can change that pathway without making all fertiliser impacts disappear.
Why is greater yield alone insufficient evidence of food security?
Difficulty 1/5 · 100 coins + a small bonus on first completion today
Evaluate the input package and distribution of benefits.
Include land rights in the decision
- Secure access to land and water affects food production and livelihoods. The Endorois case around Lake Bogoria, Kenya, illustrates pastoral access, cultural connections and displacement linked to reserve creation. The African Commission found rights violations and recommended remedies in the cited decision.
- A ruling is not proof that every recommendation was implemented immediately. Assess consent, participation, compensation and access as well as reserve area or commercial revenue. Communities contain different views; one spokesperson or survey should not automatically be treated as representing everyone.
What follows from a land-rights ruling alone?
Difficulty 1/5 · 100 coins + a small bonus on first completion today
Separate legal decisions from observed implementation and livelihoods.
Explain four dimensions of food security
- Availability concerns food supply; access concerns obtaining it; utilisation includes suitable nutrition, water and sanitation; stability concerns continuity through time. A large global harvest does not guarantee that a household can afford a varied diet during conflict, drought or a price shock.
- FAO’s 2025 report estimates about 673 million people experienced hunger in 2024. This is not the same indicator as every form of food insecurity or inability to afford a healthy diet. State year, population and definition; regional trends can diverge from the global average.
Which food-security dimension concerns continuity through shocks?
Difficulty 1/5 · 100 coins + a small bonus on first completion today
Availability, access, utilisation and stability are related but distinct.
Keep population categories separate
- WHO’s 2022 adult estimates include 2.5 billion people with overweight, including about 890 million living with obesity. The second group is inside the first, not an additional 890 million. These are dated population estimates, not an assessment of any individual student.
- Malnutrition includes deficiencies, imbalances and excesses; different forms can coexist in a household or society. Cheap calories do not automatically provide a varied nutritious diet. Food quality, affordability, storage, time and access all matter alongside the total quantity on shelves.
Are the stated adults with obesity added to the 2.5 billion with overweight?
Difficulty 1/5 · 100 coins + a small bonus on first completion today
Do not double-count a subgroup and its parent category.
Calculate sequential food losses
- UNEP’s 2024 report estimates that 19% of food available at retail, food-service and household stages was wasted in 2022. Earlier supply-chain losses use a different denominator. Household waste occurs across income groups, so it is not accurate to call it only a rich-country problem.
- Invented harvest is 100 tonnes. Losing 10% before retail leaves 90; wasting 20% of that leaves 72. Overall loss/waste is 28%, not 30%. SDG 12.3 aims to halve per-capita retail/consumer food waste by 2030 and reduce supply-chain losses; it does not assign the same halving rule to every quantity.
Invented 100-tonne harvest loses 10% before retail, then 20% of what remains. How many tonnes remain?
Difficulty 2/5 · 140 coins + a small bonus on first completion today
After the first loss, 100 × (1 − 0.10) = 90 tonnes remain. The second loss is 90 × 0.20 = 18 tonnes. Final amount = 90 − 18 = 72 tonnes; total loss is 100 − 72 = 28 tonnes, or 28%, not 30%.
Read land and nutrition shares
- The Oxford research group’s dated 2018 summary attributes about 83% of farmland to animal products, supplying about 18% of calories and 37% of protein. Farmland is not all Earth’s land; these quantities have different denominators. Do not relabel them as a current complete land census.
- Feed conversion and respiration help explain resource differences, but production methods, co-products and nutritional units matter. Some livestock uses non-arable land or feed not edible to people. Those considerations affect evaluation without proving that every grazing system is sustainable or that all proteins have identical nutritional value.
Does a share of farmland describe the same denominator as a share of all Earth’s land?
Difficulty 1/5 · 100 coins + a small bonus on first completion today
Keep land, calories and protein denominators distinct.
Use a matched emissions comparison
- Assigned teaching values per 100 g protein are peas 1, tofu 3 and beef 30 kg carbon-dioxide equivalent. Replacing 30 with 3 gives a 90% decrease within this model. These are invented values, not measured global medians or a prediction for every producer.
- State whether farming, processing, transport, refrigeration and waste are included. A per-kilogram food value cannot be compared directly with a per-100-g-protein value. Distance alone does not determine the whole footprint; the type of production and transport also matters.

Assigned emissions decrease from 30 to 3 per matched protein unit. Find percentage reduction.
Difficulty 2/5 · 140 coins + a small bonus on first completion today
(30−3)/30×100=90%, within the invented model.
Compare organic and other farming fairly
- Certified organic systems follow specified input rules; they can still lose nutrients or use permitted pest-control products. Conventional farms can use manure, rotations, cover crops and integrated pest management 病虫害综合治理 too. Organic and commercial describe different dimensions and are not opposites.
- Invented yield decreases from 5 to 4 tonnes/ha while required output remains 100 tonnes. Area rises from 20 to 25 ha: a 20% yield reduction requires 25% more area under these assumptions. The ecological consequence depends on the land source, management and changes in demand, not the label alone.
Invented output remains 100 tonnes; yield falls from 5 to 4 tonnes/ha. Find percentage increase in area.
Difficulty 2/5 · 140 coins + a small bonus on first completion today
Initial area = 100/5 = 20 ha. New area = 100/4 = 25 ha. Area increase = 25 − 20 = 5 ha; percentage increase = 5/20 × 100 = 25% under the fixed-output assumptions.
Judge a combination of strategies
- Integrated pest management 病虫害综合治理 combines monitoring, resistant varieties, rotations and biological controls with targeted interventions when justified. Agroforestry 农林复合, diverse crops and precision inputs can improve particular functions, while competition, equipment costs and maintenance can limit adoption. “Sustainable intensification 可持续集约化” is a goal to test, not proof that intensification always spares habitat.
- Reducing avoidable waste, improving storage, shifting demand and supporting suitable nutrient cycling can complement production changes. Compare food and income, biodiversity, water, emissions and rights over the same period. Stakeholders may rank them differently; justify the criteria and identify who gains or bears costs.
Which describes integrated pest management?
Difficulty 1/5 · 100 coins + a small bonus on first completion today
Test outcomes, costs and trade-offs rather than treating a name as proof.
Follow a resource from stock to service
- Natural resources 自然资源 supply materials, energy and services. Natural capital 自然资本 is the stock and ecological functions; natural income 自然收入 is a flow of goods or services, such as timber, fish, water replenishment and flood regulation.
- A forest, wetland and river offer different combinations. Nutrient-removing reed beds have finite capacity and changing conditions; a natural service cannot safely absorb unlimited waste.
Which is an ecosystem service rather than a harvested good?
Difficulty 1/5 · 100 coins + a small bonus on first completion today
Natural capital supports goods and services, with finite functional capacity.
Match renewal and use timescales
- Renewable stocks can be depleted when harvest exceeds regeneration; groundwater can be pumped faster than recharge. Fossil groundwater and full soil formation may be effectively non-renewable on human planning timescales.
- Solar and wind are recurring flows with finite available power and infrastructure limits. Metals can be reused or recycled, but collection, contamination, energy and process losses prevent perfect unlimited circulation.
Does a renewable label guarantee sustainable extraction?
Difficulty 1/5 · 100 coins + a small bonus on first completion today
Stocks, flows and planning timescales differ; some groundwater is effectively fossil.
Balance an invented resource stock
- Invented: initial stock 1000 units, regeneration 80 and harvest 100 in one period give $1000+80-100=980$ units. Stock declines by 20 even though the resource can regenerate.
- Harvest at estimated growth is not enough by itself: protect habitat, age structure, soils and services, and allow for uncertain renewal and bad years. Pollution must also avoid harmful accumulation.

Invented initial stock 1000, regeneration 80 and harvest 100 units. Find final stock.
Difficulty 2/5 · 140 coins + a small bonus on first completion today
1000+80−100=980; the stock falls 20 despite regeneration.
Compare values beyond market price
- Aesthetic beauty, cultural/spiritual connections, income, ecosystem functions, health, social use and technological properties give different values. Intrinsic worth is independent of usefulness to humans; a market price cannot capture every value.
- Calling nature capital is a useful stock/flow model but implies a perspective, not the only ethical view. Neutral voluntary school surveys should separate values from ability to pay and describe privacy, sampling and non-response.
What does intrinsic value mean?
Difficulty 1/5 · 100 coins + a small bonus on first completion today
Several human-use and non-use values can coexist; capital language is a perspective.
Explain changing resource value
- Lithium demand changed with rechargeable batteries; whale oil lost much of its lighting role as alternatives spread. Culture, substitutes, knowledge, scarcity, technology, policy and cost can increase or decrease value.
- Lithium is not a rare earth, and cobalt or rare-earth requirements differ among technologies. Lower market demand does not mean a species or place loses intrinsic worth; avoid undated universal supply-concentration claims.
Does lower market demand necessarily remove a resource’s intrinsic worth?
Difficulty 1/5 · 100 coins + a small bonus on first completion today
Whale oil and lithium illustrate changing uses without reducing every value to price.
Compare two water-security contexts
- Singapore's Four National Taps combine catchments, imports, NEWater and desalination, reducing some rainfall/import risks while requiring energy, treatment and finance. Diverse supply is not complete independence from external inputs.
- Jordan's 2023–2040 strategy reports about 61 m³ renewable freshwater per person per year in its dated account. Aridity, demand and groundwater pressure create different constraints; compare reliability, affordability, ecology and delivered capacity rather than technology names alone.
Does diversified supply prove complete independence from outside inputs?
Difficulty 1/5 · 100 coins + a small bonus on first completion today
Compare Singapore and Jordan using reliability, affordability, ecology and actual implementation.
Choose resources using a complete boundary
- Demand reduction, durability, substitution 替代, repair/reuse and recycling can lower primary demand. Diverse suppliers and trade may improve security, which is different from proving extraction sustainable.
- Geography, history, culture, economics, policy, technology and environmental concern influence choices. A renewable stock can still be harvested destructively; imported resources can improve access while creating route or supplier vulnerability.
Can supply diversification improve security without proving sustainability?
Difficulty 1/5 · 100 coins + a small bonus on first completion today
Evaluate the whole extraction/use chain as well as reliability.
Separate primary energy, carriers and services
- Primary energy is energy in resources before conversion. Electricity and hydrogen are carriers: producing them requires inputs. Heat, transport, steel, cement and fertiliser need particular services, not electricity labels alone.
- Population and per-person demand both affect total use; access is unequal. Capacity in MW is a rate, while generated MWh accumulates over time; new solar capacity is not annual generation or all energy consumed.
Which is an energy carrier requiring production inputs?
Difficulty 1/5 · 100 coins + a small bonus on first completion today
Electricity and hydrogen deliver energy from conversion processes; they are not free primary sources.
Read the dated primary-energy comparison
- Energy Institute's 2024 edition gives rounded 2023 global primary energy of 620 EJ, with 505 EJ fossil and 115 EJ other sources. Fossil share is $505/620\times 100=81.45\%$, about 81.5%.
- State the date, source and accounting method; these are not electricity shares. A dataset using another primary-energy convention must not be spliced into a trend without reconciliation.

Using rounded EI2024-edition values, find fossil share from 505 EJ out of620 EJ, to one decimal percent.
Difficulty 2/5 · 140 coins + a small bonus on first completion today
505/620×100=81.4516...%, rounded 81.5; this is primary energy, not electricity.
Evaluate fossil and nuclear 核能 sources
- Coal, oil and gas supply energy and feedstocks with combustion and extraction impacts. Gas can have lower direct CO₂ per comparable output than coal, but upstream methane affects a complete comparison.
- Nuclear fuel is non-renewable; lifecycle carbon is generally low, not zero-impact. Compare availability, mining, cooling, accidents, waste, construction/finance and decommissioning against equivalent output and alternatives.
Does low-carbon nuclear mean zero-impact or absolutely constant output?
Difficulty 1/5 · 100 coins + a small bonus on first completion today
Compare equivalent output and the complete system, not a single label.
Compare renewable sources without guarantees
- Solar PV needs sunlight; wind depends on weather. Reservoir hydro can store water, while run-of-river output is less controllable; drought, fish, sediment, land and displacement matter. Tides are predictable, while waves depend on sea conditions.
- Geothermal heat is not confined to volcanic areas, though high-temperature electricity resources are site-dependent. Biomass can be stored but is not automatically carbon-neutral; assess land, regrowth, food competition, pollution and end-of-life impacts of equipment.
Which statement is correct?
Difficulty 1/5 · 100 coins + a small bonus on first completion today
Renewables differ in mechanisms, constraints and lifecycle impacts.
Compare Norway and Japan in context
- Norway's hydro-rich electricity system uses topography, rainfall, reservoirs and interconnections; drought, ecology and costs remain. Its electricity mix does not describe every transport or industrial energy use.
- IEA's Japan 2021 review describes import dependence and post-Fukushima disruption, with diversification, efficiency, renewables and nuclear safety as responses. This is dated context, not unchanged current shares; history, geography, infrastructure and trust affect choices.
Does a hydro-rich electricity mix describe all national energy use?
Difficulty 1/5 · 100 coins + a small bonus on first completion today
Keep sector, carrier and time boundary visible in country comparisons.
Calculate energy from capacity and time
- Invented: a 50 MW installation at capacity factor 0.30 for 8760 hours produces $50\times 0.30\times 8760=131\,400$ MWh, or 131.4 GWh. Capacity factor is actual output relative to continuous rated output.
- It is not conversion efficiency. An engineering efficiency uses useful energy output/input under a stated boundary; the two ratios cannot be substituted merely because both can be written as percentages.
Invented 50 MW installation at capacity factor 0.30 over 8760 hours: find generated MWh.
Difficulty 2/5 · 140 coins + a small bonus on first completion today
50×0.30×8760=131400 MWh=131.4 GWh; capacity factor is not conversion efficiency.
Match storage power and duration
- Invented: 5 MWh input gives 4 MWh delivered and 1 MWh losses: round-trip efficiency is 80%. Delivery at 1 MW lasts four hours in this model, within the system's usable-energy and power limits.
- Batteries, pumped hydro, thermal stores and hydrogen chains have different losses and constraints. Storage shifts energy rather than creating it; grids and flexible demand also help, but no finite store guarantees an unlimited long shortfall.
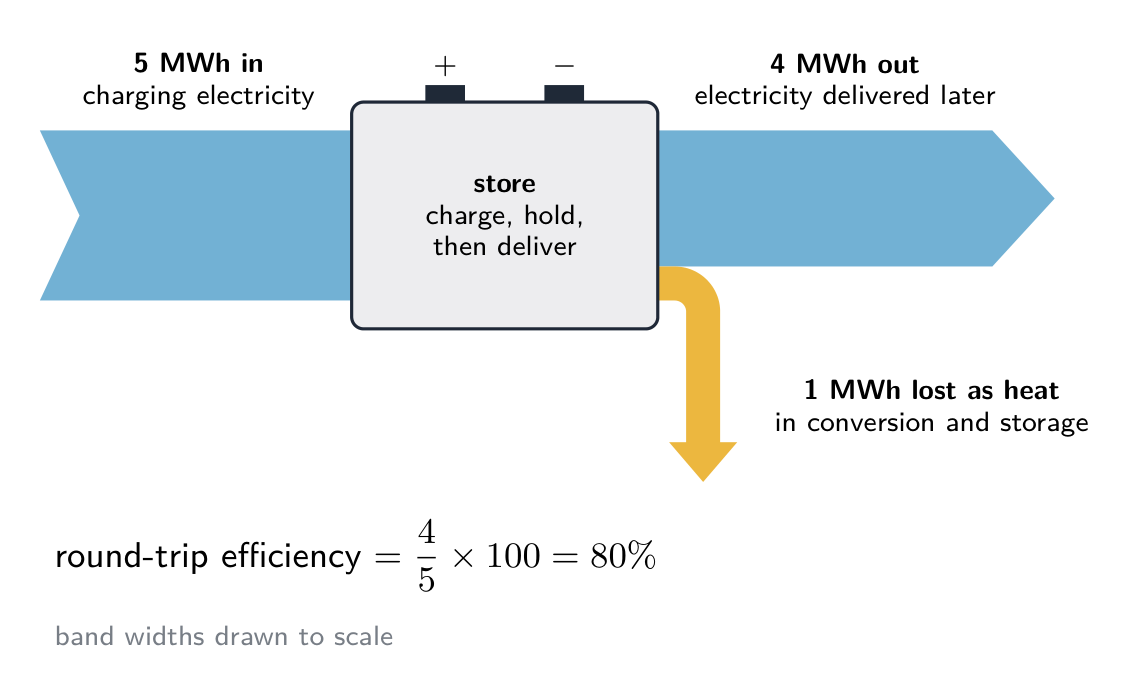
Invented store delivers 4 MWh after 5 MWh input. Find round-trip efficiency.
Difficulty 2/5 · 140 coins + a small bonus on first completion today
4/5×100=80%; the remaining 1 MWh is outside delivered electrical output.
An invented usable 4 MWh store supplies 1 MW. How many hours can it deliver at that rate?
Difficulty 2/5 · 140 coins + a small bonus on first completion today
Energy/power=4 MWh/1 MW=4 hours within the model limits.
Distinguish conservation, efficiency and rebound
- Conservation changes consumption behaviour; efficiency reduces input for comparable service. Insulation and efficient lighting should be evaluated with measured comfort, illumination, occupancy and costs.
- Invented: 30 MJ useful output from 100 MJ input is 30% efficiency. Cheaper service can encourage more use, partly offsetting engineering savings through rebound; lower impact per use need not mean lower total impact.
Can greater efficiency leave total consumption unchanged or higher?
Difficulty 1/5 · 100 coins + a small bonus on first completion today
Compare like service and measured outcomes; per-use and total impacts differ.
Classify waste with consistent measures
- Domestic, industrial and agricultural describe sources; food, e-waste and biohazardous material describe types. Categories overlap, and domestic waste may include packaging, glass, metals, organics, clothing and construction debris.
- Municipal definitions and collection coverage vary. Compare matching mass, volume, moisture, time and per-person boundaries; diet, policy, technology, income and season change amount and composition without making an income group uniform.
Are domestic source and plastic type mutually exclusive waste categories?
Difficulty 1/5 · 100 coins + a small bonus on first completion today
Source, type, mass, volume and coverage require consistent definitions.
Interpret historical waste estimates
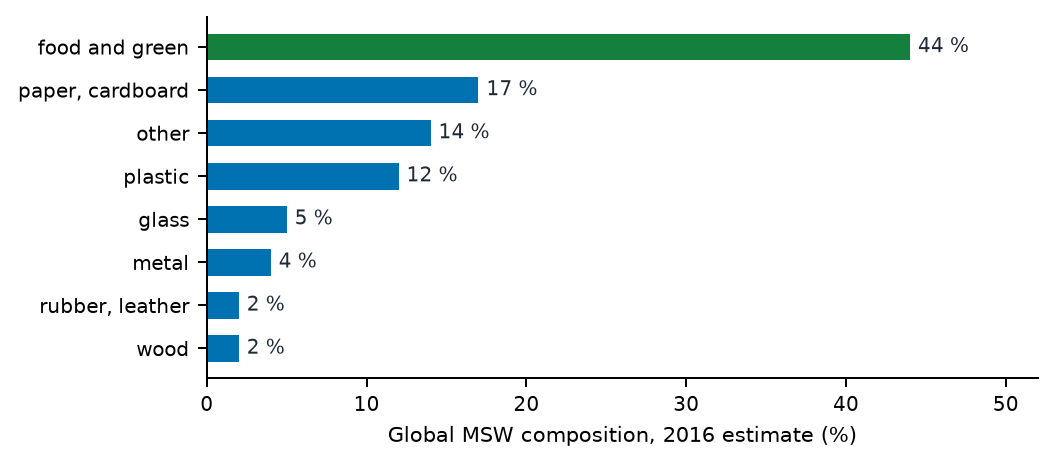
- World Bank's 2018 report estimated 2.01 billion tonnes MSW in 2016 and projected 3.40 billion for 2050 under its assumptions. Estimate, projection and current measurement are different evidence.
- Its approximate composition categories total 100%; global shares are not every city. Richer societies do not generate only packaging, and organic waste is not confined to poorer societies.
Is the 2050 World Bank waste projection a present measurement?
Difficulty 1/5 · 100 coins + a small bonus on first completion today
The report and baseline date matter; estimates and projections are different evidence.
Explain plastic harms and evidence limits
- Persistent debris can entangle organisms, be ingested, alter habitat and fragment into microplastics 微塑料 below 5 mm. Fragmentation is not complete mineralisation; no single lifetime describes all polymers and environments.
- OECD estimated 9% of 2019 plastic waste ultimately recycled after process losses, not 9% of every product ever made. Detection in humans establishes exposure, not by itself a particular disease; ocean accumulation zones are distributed debris rather than solid islands.
Does detecting microplastics in a person by itself establish a specific disease cause?
Difficulty 1/5 · 100 coins + a small bonus on first completion today
Mechanism, dose, controls and outcome evidence are needed for a causal health claim.
Use a half-life model conditionally
- Invented: a substance with constant 10-year half-life starts at 80 g; after 10 years, 40 g remains, and after 20, 20 g. It does not vanish after one half-life.
- Real biodegradation depends on organisms, oxygen, moisture, temperature and chemistry; not every weathering 风化 process follows exponential decay. Metals change form without disappearing as elements, and biodegradable material can still cause oxygen-demand pollution.
Invented 80 g substance follows a10-year constant half-life. Find mass remaining after 20 years.
Difficulty 2/5 · 140 coins + a small bonus on first completion today
Two half-lives:80→40→20 g. This model does not fit every degradation process.
Follow waste impacts across places
- Leachate 渗滤液, uncontrolled burning and unsafe recovery can harm workers and neighbours. Exports may provide materials and livelihoods but can shift risk away from consumers; assess who benefits, participates and bears exposure.
- Basel e-waste amendments effective January 2025 extend prior-informed-consent controls within that framework. This is not proof that illegal movement ended or a universal ban on every working second-hand device.
Can waste movement shift environmental costs away from consumers?
Difficulty 1/5 · 100 coins + a small bonus on first completion today
Assess benefits, burdens, rights and actual implementation across places.
Explain engineered landfill 填埋 and incineration 焚烧
- A sanitary landfill uses a liner, drainage, leachate treatment, gas management, covering and monitoring during and after use. Drainage belongs above the liner; containment reduces rather than eliminates risk.
- Incineration can reduce volume and recover energy but needs emissions control, monitoring and ash treatment; fossil carbon and contractual incentives matter. Neither method makes all waste or harm disappear.

Where should landfill leachate drainage be relative to a bottom liner?
Difficulty 1/5 · 100 coins + a small bonus on first completion today
Containment reduces risk; leakage and post-closure management remain important.
Compare biological and material recovery
- Composting 堆肥 suitable separated organics needs oxygen, moisture and quality control. Anaerobic digestion produces biogas and digestate, which needs safe nutrient management; biodegradability alone does not prove treatment quality.
- Recycling needs collection, clean streams, energy, markets and safe residual treatment. Prevention usually avoids more upstream demand; hazardous contamination and hygiene may limit reuse or recovery, while controlled residual disposal can be necessary.

Does biodegradable mean rapidly harmless in every environment?
Difficulty 1/5 · 100 coins + a small bonus on first completion today
Biological routes and recycling require suitable inputs and safe residual handling.
Interpret lifecycle equality and strict savings
- Invented cup: reusable energy $1000+10n$, disposable $60n$; equality is at 20 uses. Invented bottle: $1500+15n<90n$ gives $n>20$, so lower counted energy first occurs at 21 whole uses.
- Match the functional unit and system boundary. One wash per use is assumed; transport, detergent, water, breakage, hygiene and other impact categories are excluded, so an energy result is not a complete lifecycle verdict.

In an invented energy model, a reusable bottle costs 1500 energy units to make plus 15 per use; disposable bottles cost 90 per use. Find the first whole-number use at which reusable energy is lower.
Difficulty 2/5 · 140 coins + a small bonus on first completion today
Strict saving requires 1500 + 15n < 90n, so 1500 < 75n and n > 20. At n = 20 both totals are 1800; the first whole-number saving is at n = 21. This is a scoped energy model, not a complete lifecycle verdict.
Trace actual circular recovery
- Follow an aluminium can from ore through refining, manufacture and use to collection, sorting and remelting. Invented: collect 80% and recover 90% of collected metal: overall return is $0.80\times 0.90=0.72$, or 72%, with 28% uncollected or lost.
- Recyclable design is a potential rather than an observed result. Prevention, refill/reuse, producer responsibility, deposits and convenient facilities need evidence about demand, access, dumping, contamination and actual output; growing consumption can offset efficiency.
Invented 100 units:80% collected and 90% of collected material recovered. Find returned units.
Difficulty 2/5 · 140 coins + a small bonus on first completion today
100×0.80×0.90=72. Collection and process efficiencies multiply.
Evaluate Shanghai sorting through the whole chain
- Regulation effective July 2019 requires recyclables, hazardous, wet/food and dry/residual streams. Labels, collection facilities, education, monitoring and penalties can support behaviour; apply relevant local material guidance rather than one battery rule for all chemistries.
- Track sorting, contamination, transport, processing, recovered output and residues separately. Before/after sorted collection alone does not establish causation or show every item was recycled; evaluate access, enforcement and downstream capacity.
Does more sorted collection alone prove every item was recycled?
Difficulty 1/5 · 100 coins + a small bonus on first completion today
Sorting, treatment, actual recovery and causation are distinct stages.