Feedback and internal conditions
Introduced| English | Meaning |
|---|---|
| homeostasis/ˌhəʊmiːəˈstɑːsiz/ | Maintaining a relatively stable internal environment despite external or internal changes. |
| negative feedback/ˈneɡətɪv ˈfiːdbæk/ | A control process in which a change triggers responses that oppose that change. |
What would explain this observation?
- Blood glucose rises after a meal, but usually does not keep rising indefinitely. A control system responds to the change in internal conditions.
Build the model
- Homeostasis 稳态 maintains internal conditions within suitable limits.
- Receptors detect changes, coordination centres process information, and effectors respond.
- Negative feedback 负反馈 opposes the original change.
- homeostasis: Maintenance of suitable internal conditions.
- negative feedback: A response opposing the original change.

Which response opposes a rise in blood glucose?
Difficulty 1/5 · 100 coins + a small bonus on first completion today
Insulin lowers blood glucose by promoting uptake and storage of glucose, opposing the rise - this is negative feedback. Releasing glucose from glycogen would raise glucose further, and stopping respiration would harm cells rather than regulate glucose.
Match each technical term to its precise meaning.
Difficulty 2/5 · 140 coins + a small bonus on first completion today
Use the definitions to distinguish related quantities and processes.
Choose evidence that can test it
- When blood glucose is high, insulin helps increase glucose uptake and storage as glycogen.
- When it is low, glucagon supports release of glucose from stores.
- These responses are coordinated, not identical effects of two hormones.
In the lab: Interpret a time graph by identifying the initial disturbance, the response and the return toward the normal range. Mark the delay before a response. Do not assume a graph shows an instantaneous correction.
Which two habits make the investigation or model in this case more defensible?
Difficulty 2/5 · 140 coins + a small bonus on first completion today
Stating the conditions and assumptions lets others repeat the work exactly, and recording the supporting evidence lets them check the conclusion. Hiding disagreeing results removes the evidence that could challenge a wrong conclusion, and one measurement can never establish a wider claim.
Work from known quantities
- Known: glucose changes from 5.0 to 7.0 arbitrary concentration units.
- Increase = final - initial.
- Increase = 7.0 - 5.0 = 2.0 units.
- Percentage increase = 2.0/5.0 × 100 = 40%.
- The numerical change is evidence of a disturbance, not a diagnosis on its own.
Your turn: A value rises from 4.0 to 5.0. Calculate the percentage increase.
A delayed response opposes the change
A rise from 5 to 7 arbitrary units is a 40% increase. Compare positive and negative disturbances and see a delayed return toward the set point, without making the concentration negative.
A value rises from 4.0 to 5.0. Calculate the percentage increase.
Difficulty 2/5 · 140 coins + a small bonus on first completion today
The result is 25 %. Known: the value rises from 4.0 to 5.0 units. Increase = final - initial = 5.0 - 4.0 = 1.0 unit. Use percentage increase = increase / initial x 100. Percentage increase = 1.0/4.0 x 100 = 25%. The change is evidence of a disturbance, not a diagnosis by itself.
Check the conclusion and its limits
- Negative feedback does not mean the response is harmful or the measured value becomes negative.
- Diabetes has different mechanisms; do not treat every case as a failure to make insulin.
Not true: Negative feedback always makes the measured value negative. Negative feedback means the response opposes the change - it pushes the value back towards the set point. "Negative" describes the direction of correction, not a harmful effect or a negative measurement.
- Homeostasis maintains internal conditions within suitable limits.
- When blood glucose is high, insulin helps increase glucose uptake and storage as glycogen.
- Watch for: negative feedback does not mean the response is harmful or the measured value becomes negative.
Negative feedback means the response opposes the change - it pushes the value back towards the set point. "Negative" describes the direction of correction, not a harmful effect or a negative measurement.
Difficulty 1/5 · 100 coins + a small bonus on first completion today
True. Negative feedback means the response opposes the change - it pushes the value back towards the set point. "Negative" describes the direction of correction, not a harmful effect or a negative measurement.
Maintenance of suitable internal conditions: write the technical term.
Difficulty 1/5 · 100 coins + a small bonus on first completion today
homeostasis means Maintenance of suitable internal conditions.
Write from a rise of 60 percent
- A glucose value rises from 5.0 to 8.0 units.
- Find the percentage increase. The number is not a diagnosis.
A value rises from 5.0 to 8.0 units. What is the percentage increase, and which hormone response fits a high blood-glucose reading?
3.0 divided by 5.0 is 0.60, so the percentage increase is 60 percent.
The HL written case rises from 5.0 to 8.0 units. Find percentage increase relative to the starting value.
Difficulty 1/5 · 100 coins + a small bonus on first completion today
Increase = 8.0 − 5.0 = 3.0 units. Percentage increase = increase/starting value × 100 = 3.0/5.0 × 100 = 60%.
Explain integration through connections between systems
- Cells form tissues, tissues contribute to organs, and organs interact in body systems. One organ commonly contains several tissues: the stomach includes muscle, epithelium, connective and nervous tissues. Integration means coordinating their activities, rather than making every cell perform the same task.
- A running animal needs neural coordination of opposing muscles, circulation delivering respiratory substrates and oxygen, and lungs exchanging gases. Metabolism supplies ATP while circulation also transfers heat. Pursuit is an emergent whole-animal function: explain how these interactions support it, rather than giving only a list of organs.
Compare signal delivery with target recognition
- Nervous signalling combines impulses along neurons with transmitter action at synapses; connections help localize the response. Endocrine cells release hormones into circulation, which distributes them widely. Compatible receptors and downstream machinery determine which targets respond.
- Neural effects are often rapid and localized, while hormonal effects can coordinate longer-lasting changes. These are patterns, not absolutes: some hormones act within seconds, and neural activity can produce lasting learning. Signals convey information; blood must still deliver oxygen and substrates for cells to respond.
Check feedback direction and percentage denominators
- Negative feedback opposes the initiating change, without making every measured value negative or perfectly constant. Delays can allow overshoot or oscillation. In an invented trace, a rise from 5 to 8 units is 60%; a return from 8 to 5 is a 37.5% decrease because the starting denominator differs.
- Raised blood glucose can stimulate insulin-linked uptake/storage and reduced liver glucose output; low glucose can stimulate glucagon-linked liver glucose production. Do not describe these as identical effects, insert GLUT4 into every liver cell, or treat all diabetes as absent insulin. The invented numerical trace is not a diagnostic test.
An invented concentration rises from 5 to 8 units and later returns from 8 to 5. Find percentage decrease during the return, relative to 8.
Difficulty 2/5 · 140 coins + a small bonus on first completion today
(8 − 5)/8 × 100 = 37.5%. The preceding rise used 5 as denominator and was 60%; equal absolute changes need not have equal percentages.
Link brain and spinal integration with motor output
- Sensory neurons bring receptor information towards the central nervous system. Spinal circuits can integrate unconscious responses, while ascending pathways permit cerebral processing and conscious awareness. Cerebral activity can influence motor output through intervening circuits; motor neurons then communicate with muscle cells.
- The cerebellum contributes to timing, force, posture and balance, helping compare intended movement with sensory information. It is not the sole source of every motor command. Learning and memory change later information processing; no single neuron stores every experience or performs the whole integration alone.
Read a mixed nerve section at the correct scale
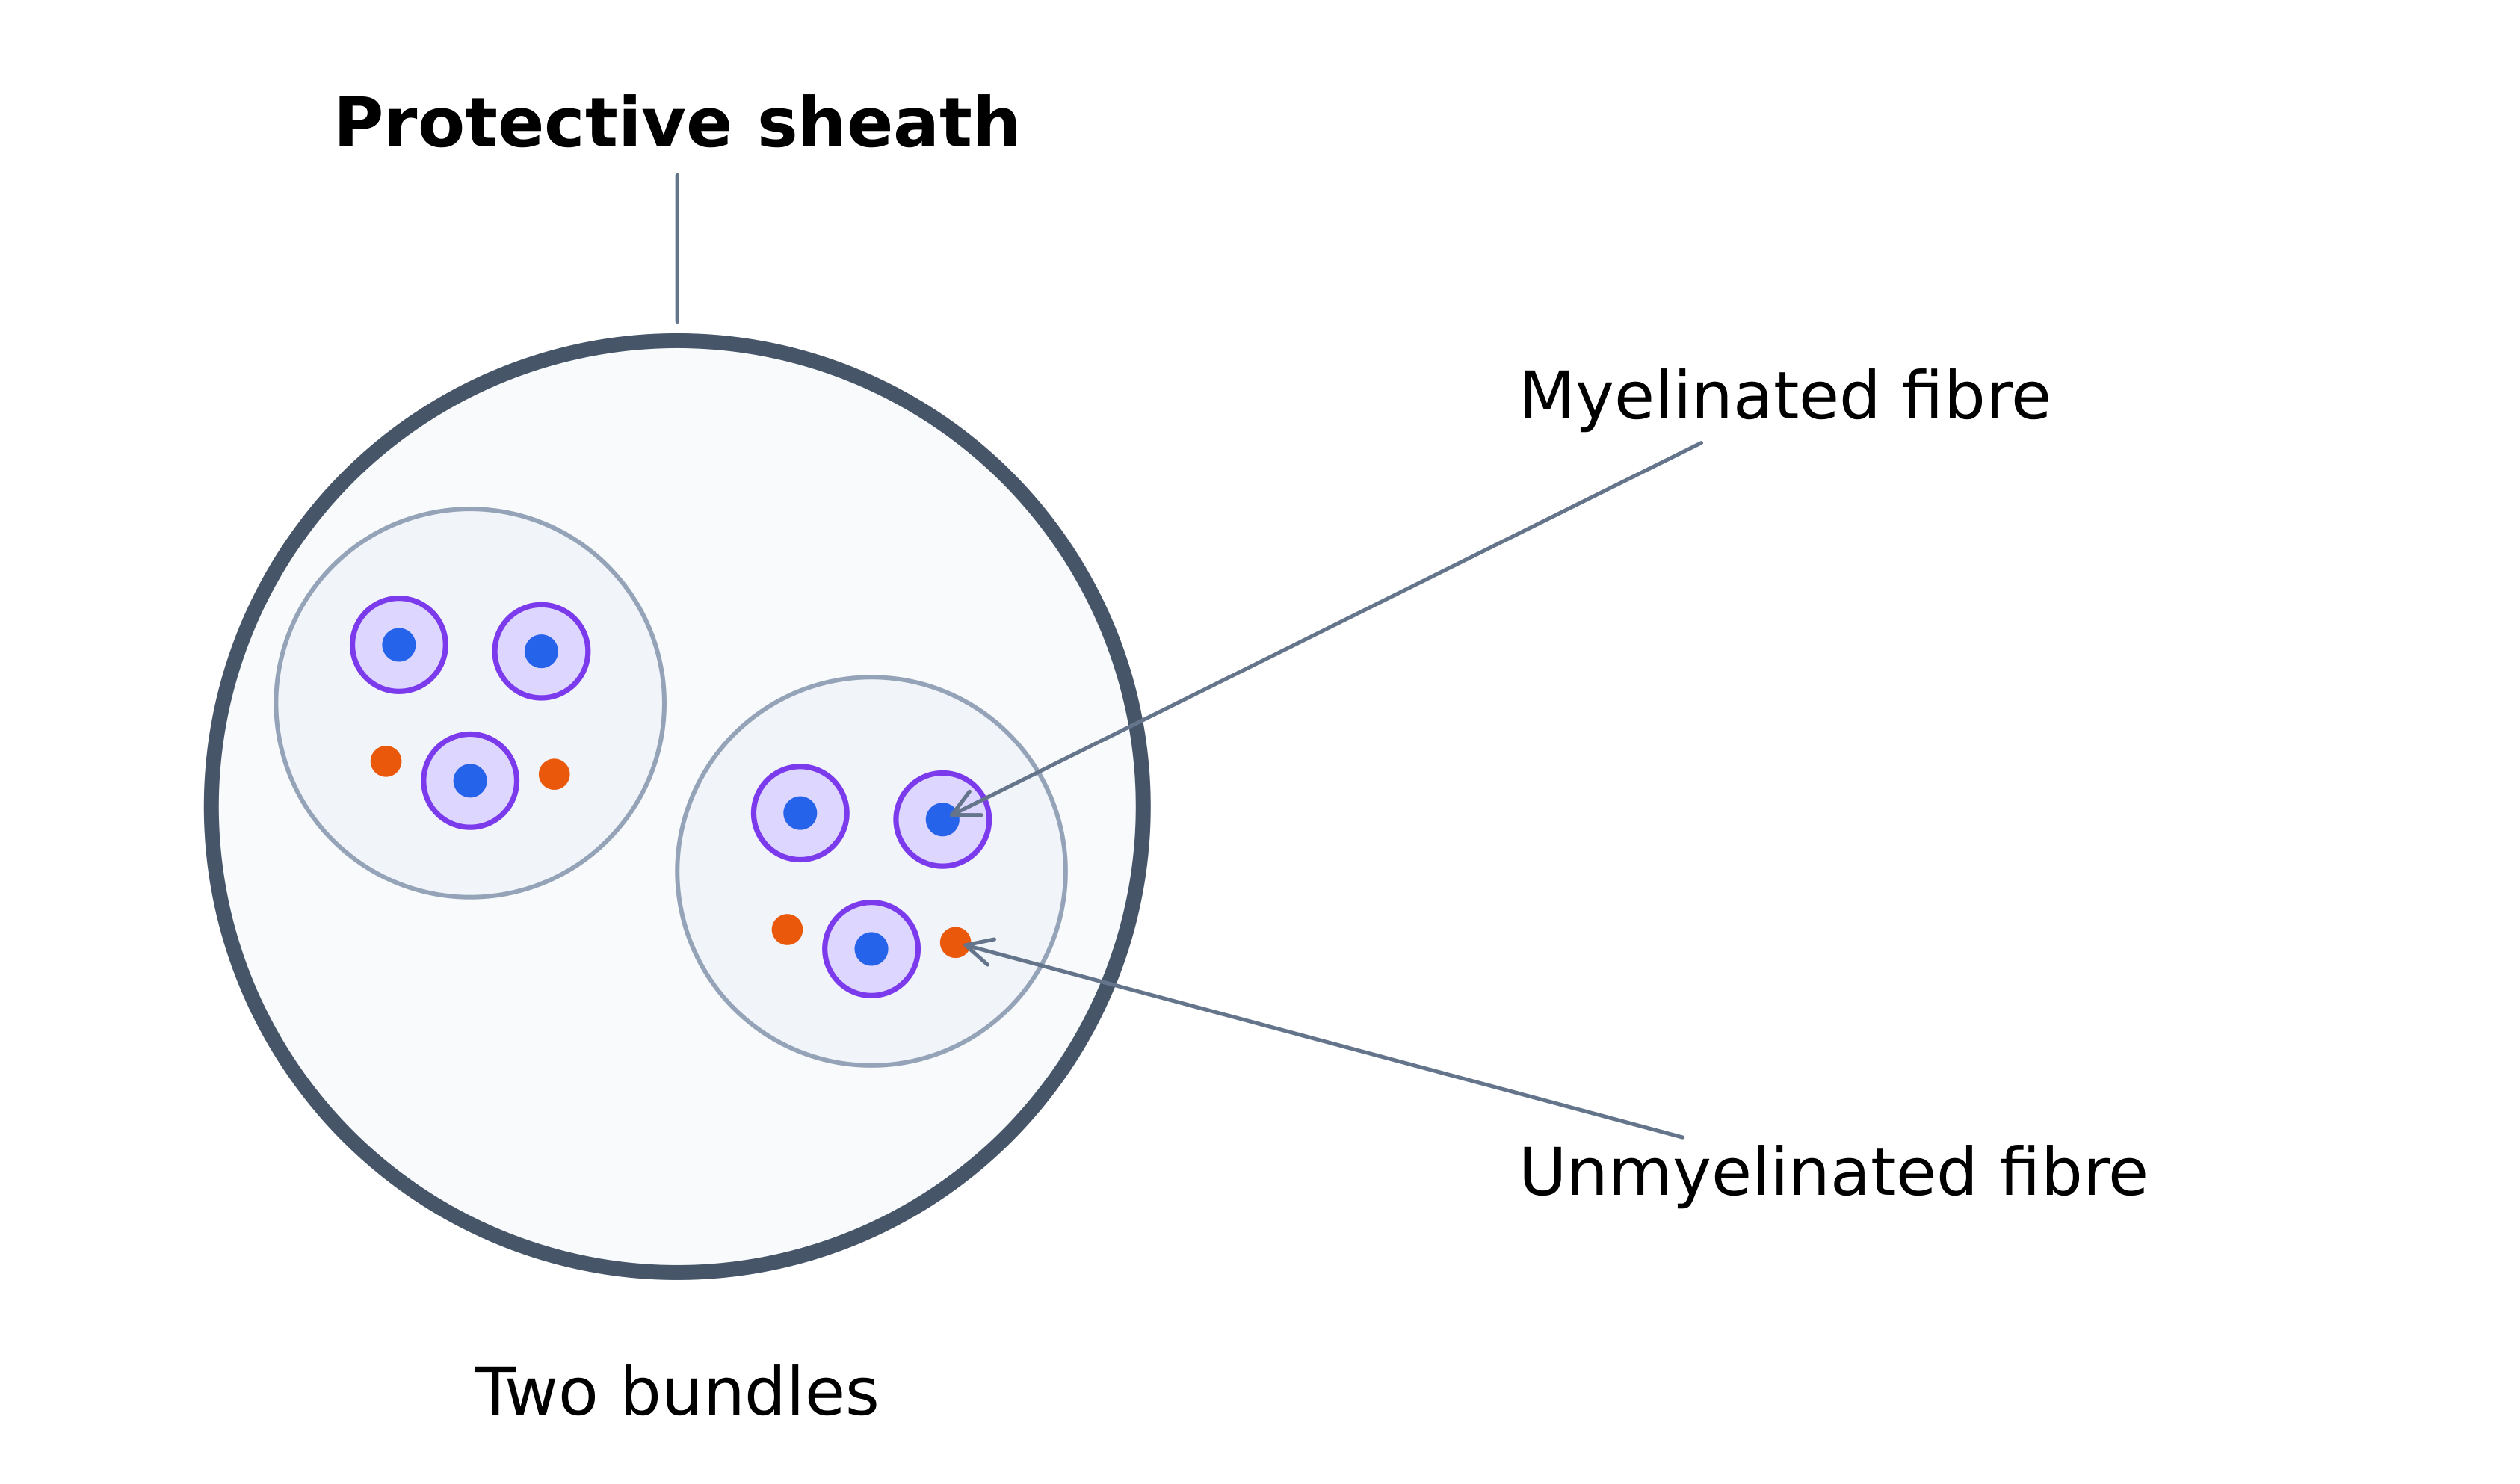
- A nerve bundles many axons with supporting cells and connective sheaths. A transverse section shows small axon profiles, some with myelin and others without. Supporting cells still matter for unmyelinated fibres; they are not necessarily bare axons floating without support.
- Many peripheral nerves contain both sensory and motor fibres. Sharing a protective route does not make each fibre alternate between those functions. A profile's round shape alone does not identify its sensory or motor direction; trace its connections or use other evidence.
Trace a withdrawal reflex before conscious awareness
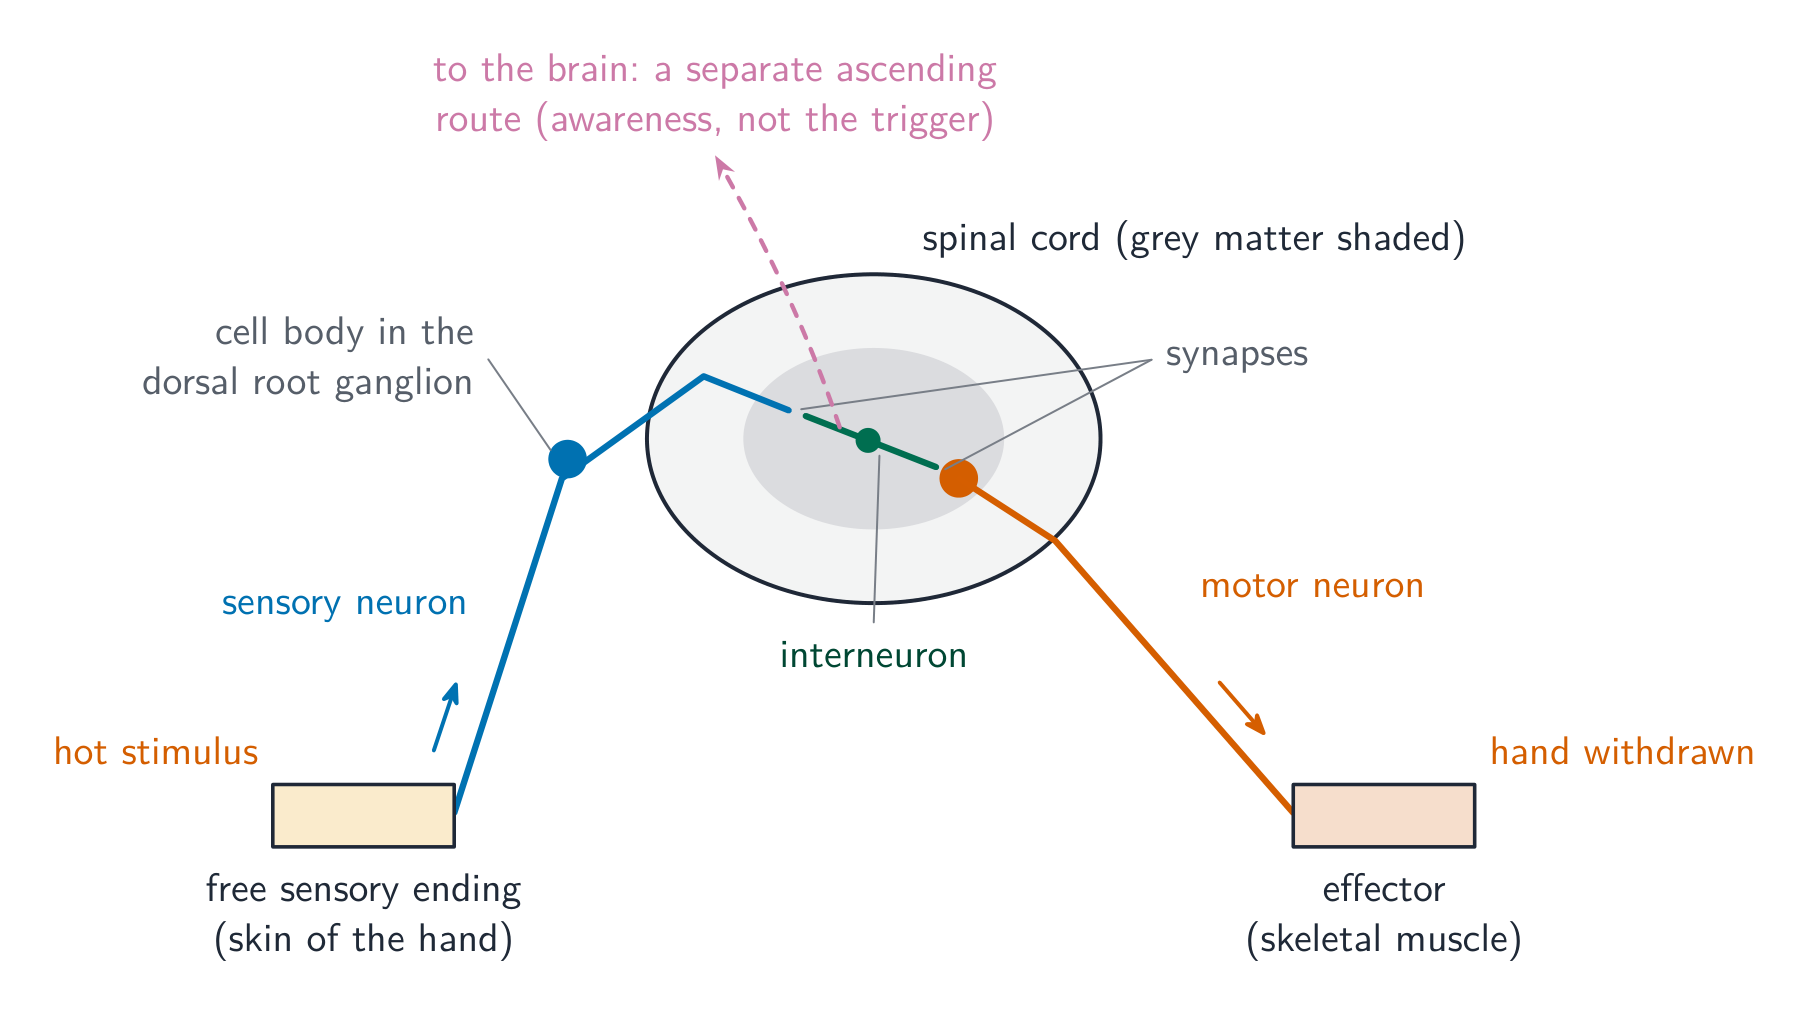
- In the simplified hot-surface reflex, a sensory ending initiates impulses; the sensory neuron enters spinal grey matter and communicates through one interneuron to a motor neuron. Motor output reaches a skeletal-muscle effector and helps flex the limb away. The sensory cell body lies in a dorsal-root ganglion outside the cord.
- This model has two neuronal synapses in the cord, plus a neuromuscular junction at the effector. Interneuron and motor-neuron cell bodies are in spinal grey matter; motor output leaves through a ventral root. Ascending pathways allow awareness without requiring a conscious decision first. Other reflexes use different circuits, and real withdrawal coordinates several muscle groups.
In the supplied spinal withdrawal-reflex model, where is the sensory-neuron cell body?
Difficulty 1/5 · 100 coins + a small bonus on first completion today
The sensory cell body is outside the cord in a dorsal-root ganglion; its central process reaches spinal synapses. The model interneuron and motor-neuron cell bodies lie in spinal grey matter.
Distinguish rhythm timing from rhythm amplitude
- Circadian rhythms are approximately daily patterns generated internally and synchronized by environmental cues. Light reaching the eyes helps set brain timing pathways. Pineal melatonin normally rises during biological night and falls during biological day; light at night can suppress secretion.
- Melatonin signals night and helps modulate sleep–wake timing, rather than instantly switching everyone into sleep. Prior wakefulness and other neural processes matter too. A shift of a peak from 02:00 to 04:00 is a two-hour phase delay; a smaller high–low difference is instead reduced amplitude. Repeated days help distinguish a rhythm from one fluctuation.
Connect epinephrine with endocrine coordination
- Epinephrine from the adrenal medulla can increase heart activity, mobilize fuels, widen airways and help redistribute blood flow during vigorous activity. Receptor differences allow different tissues to respond differently. The hormone coordinates delivery and use; it is not itself the fuel supplying contraction energy.
- The hypothalamus integrates neural and internal information and helps control pituitary output. Some pituitary hormones regulate peripheral endocrine glands; a gland's hormone can feed back to reduce earlier stimulation. Name the pathway and direction, rather than assuming every gland has an identical pituitary mechanism.
Follow pressure feedback through the medulla
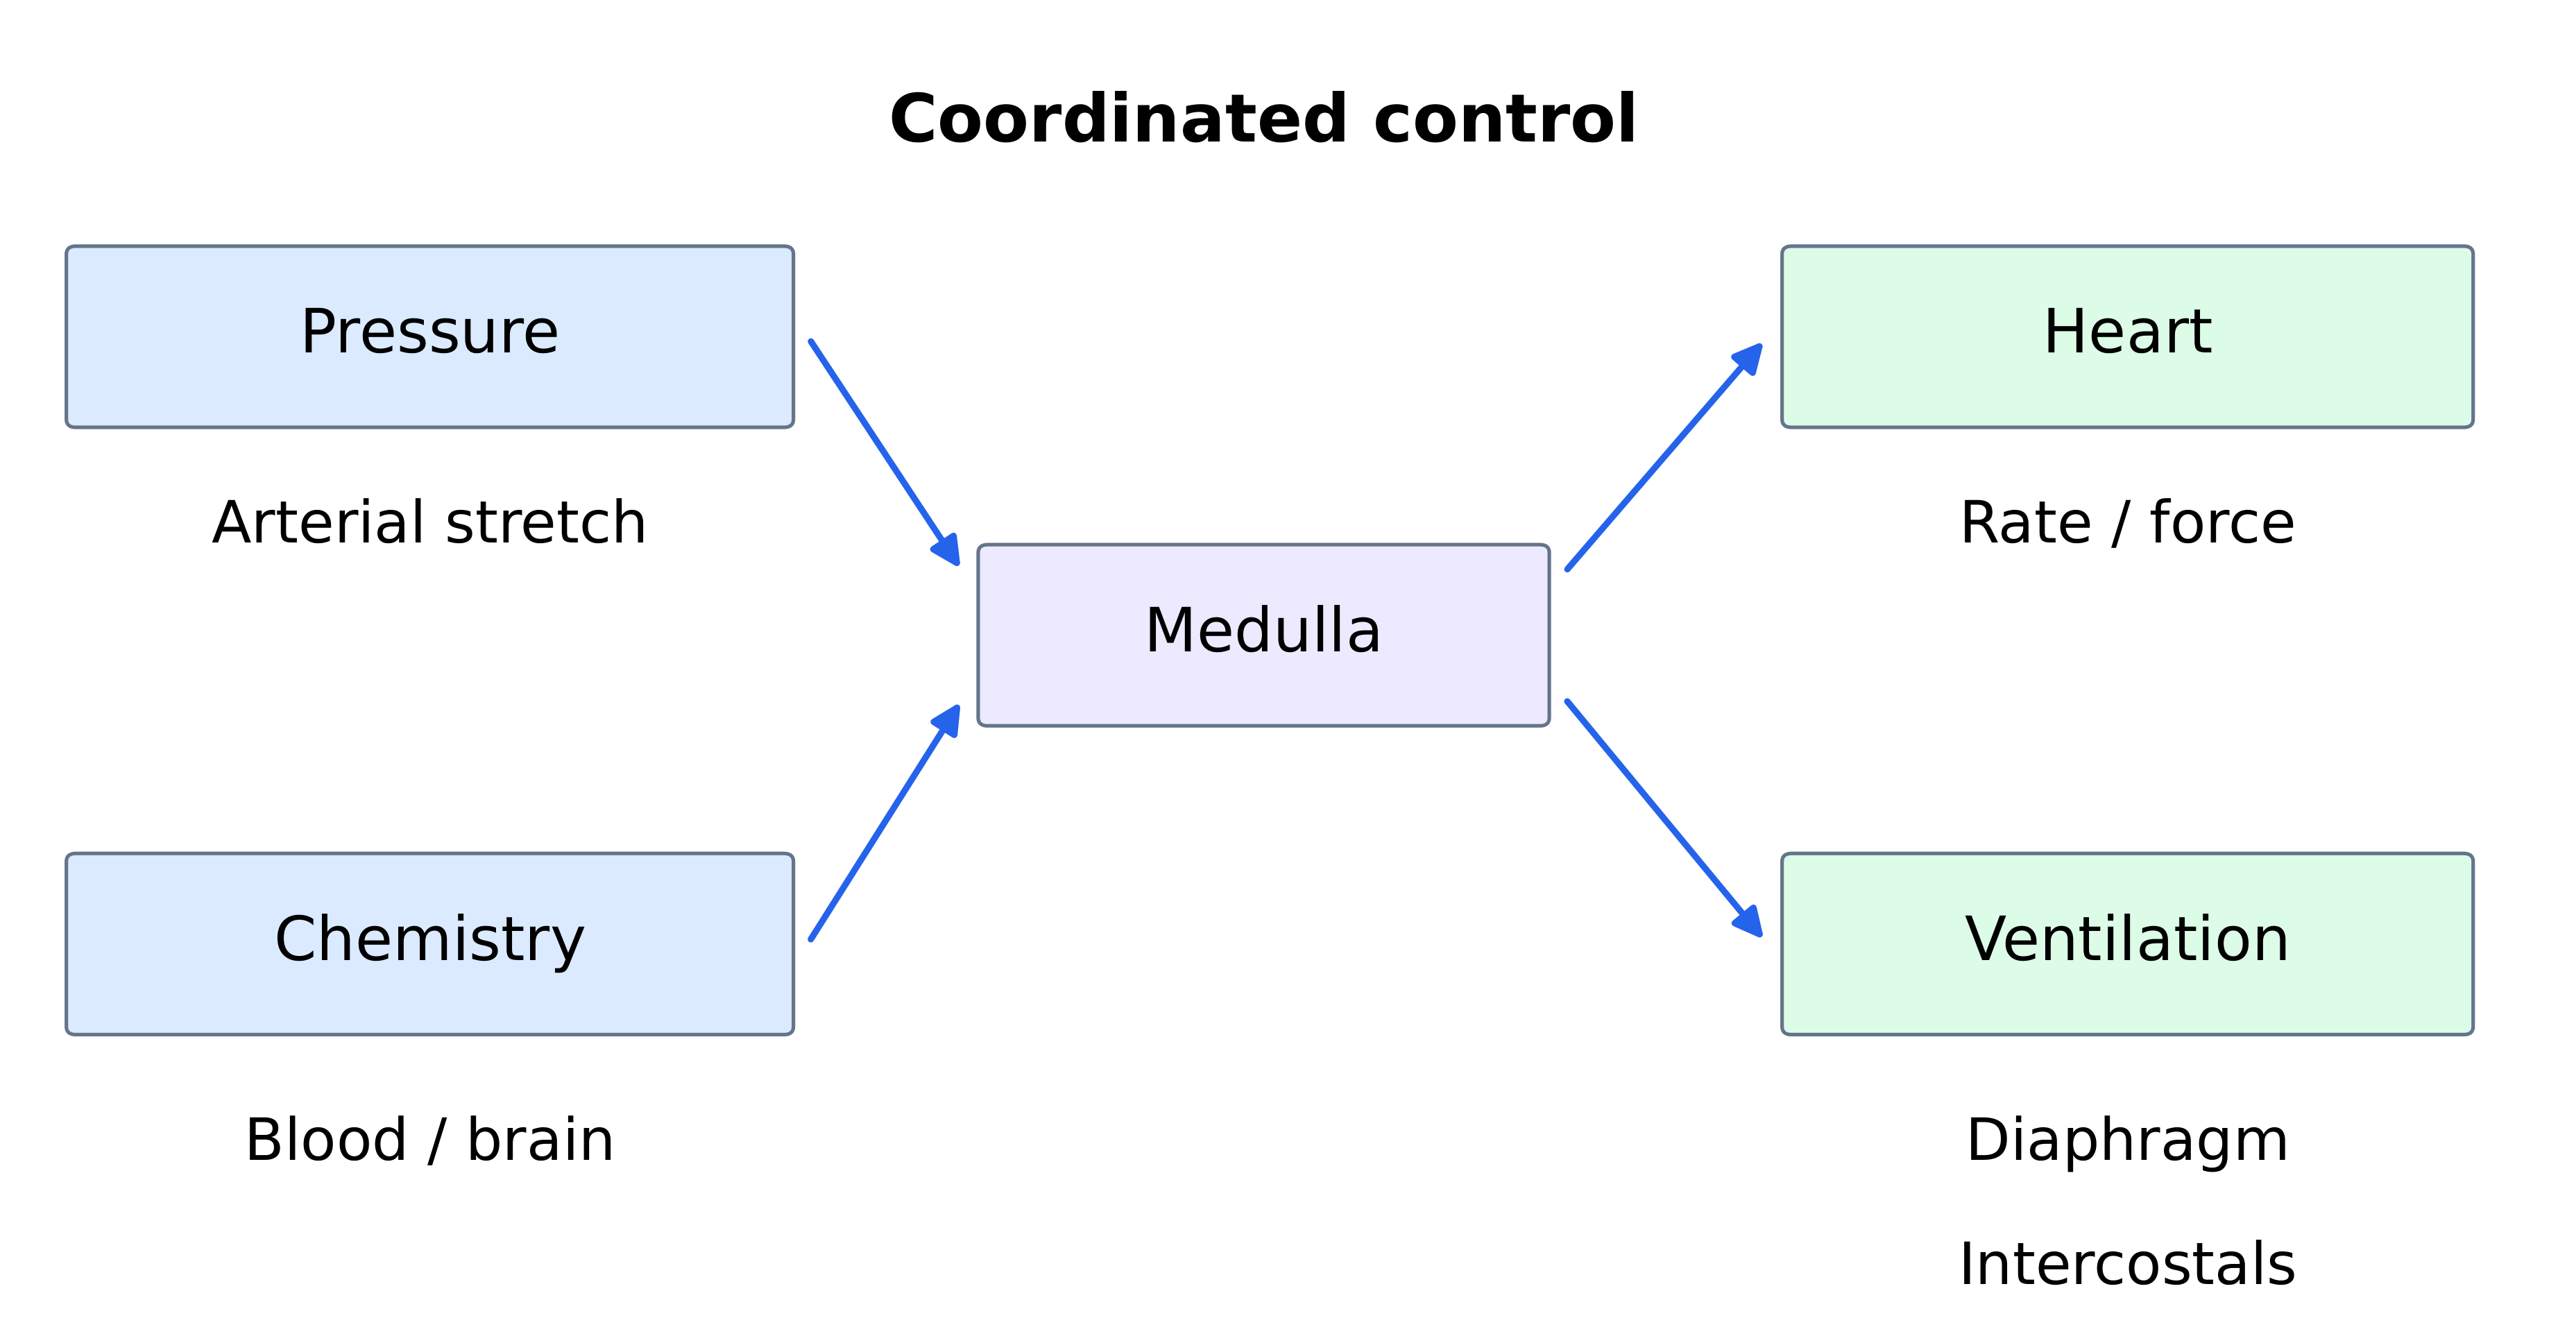
- Baroreceptors detect stretch in arterial walls, including carotid sinuses and the aortic arch. Falling pressure generally reduces their firing; medullary cardiovascular centres adjust autonomic output, which can increase heart rate and contraction strength and alter vessels. These changes can oppose the initial pressure fall.
- The heart's pacemaker generates its basic rhythm; autonomic nerves modify it rather than initiating every beat. Carotid-sinus baroreceptors are distinct from carotid-body chemoreceptors monitoring arterial chemistry. Identify both receptor location and measured variable before linking a graph to a control pathway.
Link carbon dioxide, acidity and ventilation
- Increased carbon dioxide can increase hydrogen-ion concentration through its reversible reactions with water, lowering pH when other conditions are comparable. Carbon dioxide can cross into brain fluids and change local pH; central brainstem chemoreceptive pathways respond importantly to this linked acidity.
- Peripheral chemoreceptors also monitor arterial chemistry, including low oxygen, carbon dioxide and acidity. Medullary respiratory control alters output to breathing muscles. Greater ventilation can remove more carbon dioxide, opposing its rise; ventilation, lung diffusion and tissue respiration remain different processes.
Calculate output before interpreting compensation
- In an invented comparison, pressure falls from 110 to 90 units, an 18.2% decrease, while heart rate rises from 70 to 84 beats per minute, a 20% increase. If stroke volume changes from 70 to 75 mL, cardiac output rises from 4.90 to 6.30 litres per minute, about 28.6%, rather than necessarily following the heart-rate percentage.
- Another invented comparison changes 12 breaths per minute at 0.50 L to 20 at 0.75 L. Minute ventilation rises from 6 to 15 litres per minute: a 150% increase. This is total moved air, not automatically alveolar ventilation or a known blood-gas change. Recovery patterns support compensation without proving that one pathway caused every change.
An invented comparison has heart rate 84 beats per minute and stroke volume 75 mL per beat. Find cardiac output in litres per minute.
Difficulty 2/5 · 140 coins + a small bonus on first completion today
84 × 75 = 6,300 mL per minute = 6.30 litres per minute. Stroke volume as well as heart rate affects output; a rate percentage alone cannot specify output change.
An invented comparison changes minute ventilation from 6 to 15 litres per minute. Find percentage increase relative to 6.
Difficulty 2/5 · 140 coins + a small bonus on first completion today
(15 − 6)/6 × 100 = 150%. The final value is 2.5-fold the starting value. Total ventilation does not directly specify alveolar ventilation or an exact blood-gas change.
Explain local gut coordination and central influence
- Enteric nervous-system circuits in the gut wall coordinate smooth-muscle activity. In peristalsis, contraction behind a bolus and relaxation ahead help propel contents. Local sensory input guides the pattern; the brain does not consciously command each individual wave.
- Autonomic central input can modify enteric activity, so local coordination does not mean complete independence from the central nervous system. Swallowing begins voluntarily before coordinated involuntary phases; defecation combines reflexes with voluntary external-sphincter control. Neither example makes all gut movement a voluntary action.
Separate an observed recovery from a complete causal explanation
- A time graph can show a disturbance, a delayed response and movement towards a suitable range. Label what was measured and when. To identify a mechanism, seek evidence about receptors, coordinating centres and effectors; matching time courses alone do not isolate every causal route.
- Compare appropriate baselines, repeated observations and independent subjects or samples. Changes in activity, temperature and prior conditions may affect several variables at once. Use supplied datasets or approved observations rather than provoking pain, altering breathing or administering hormones to test a class model.
Build a connected control-system explanation
- Name the disturbance, detected variable, receptor, integrating centre, effector and returning effect. Explain how that returning effect opposes or reinforces the disturbance, and include any delay. Distinguish the information route from the material or energy supply that makes the response possible.
- For a reflex, locate each neuron and synapse before naming the effector. For a rhythm, distinguish phase from amplitude. For a numerical comparison, state the starting denominator, units and assumptions; a percentage change alone neither diagnoses illness nor proves a feedback mechanism.
Explain how a fall in arterial pressure can lead to a compensating heart response, distinguish the relevant sensory structures from those monitoring blood chemistry, and explain why a recovery graph alone is incomplete evidence.
An integrated explanation links components with causal steps and a returning influence, while keeping the measured evidence distinct from wider assumptions.
AHL: Measure a directional growth response
- A tropism is growth relative to a directional stimulus. For shoot phototropism, record light direction and the shoot's angle from a defined original vertical at stated times. Invented angles of 10°, 12° and 11° give a mean of 11° and a range of 2°; repeated photographs of one seedling are not three independent seedlings.
- Compare independent seedlings of the same species and age, with a uniform-light control, fixed camera geometry, watering, temperature and light intensity. A lamp can heat or dry one side. Finer protractor resolution improves reading precision but cannot remove a misplaced reference line or camera bias.
AHL: Three independent seedlings in an invented lateral-light test bend 10°, 12° and 11° from the original vertical. Find the mean angle.
Difficulty 2/5 · 140 coins + a small bonus on first completion today
(10 + 12 + 11)/3 = 11°. The range is 2°. Repeated readings do not remove systematic camera/reference error, and the experimental unit is the seedling.
AHL: Connect polar auxin transport with bending
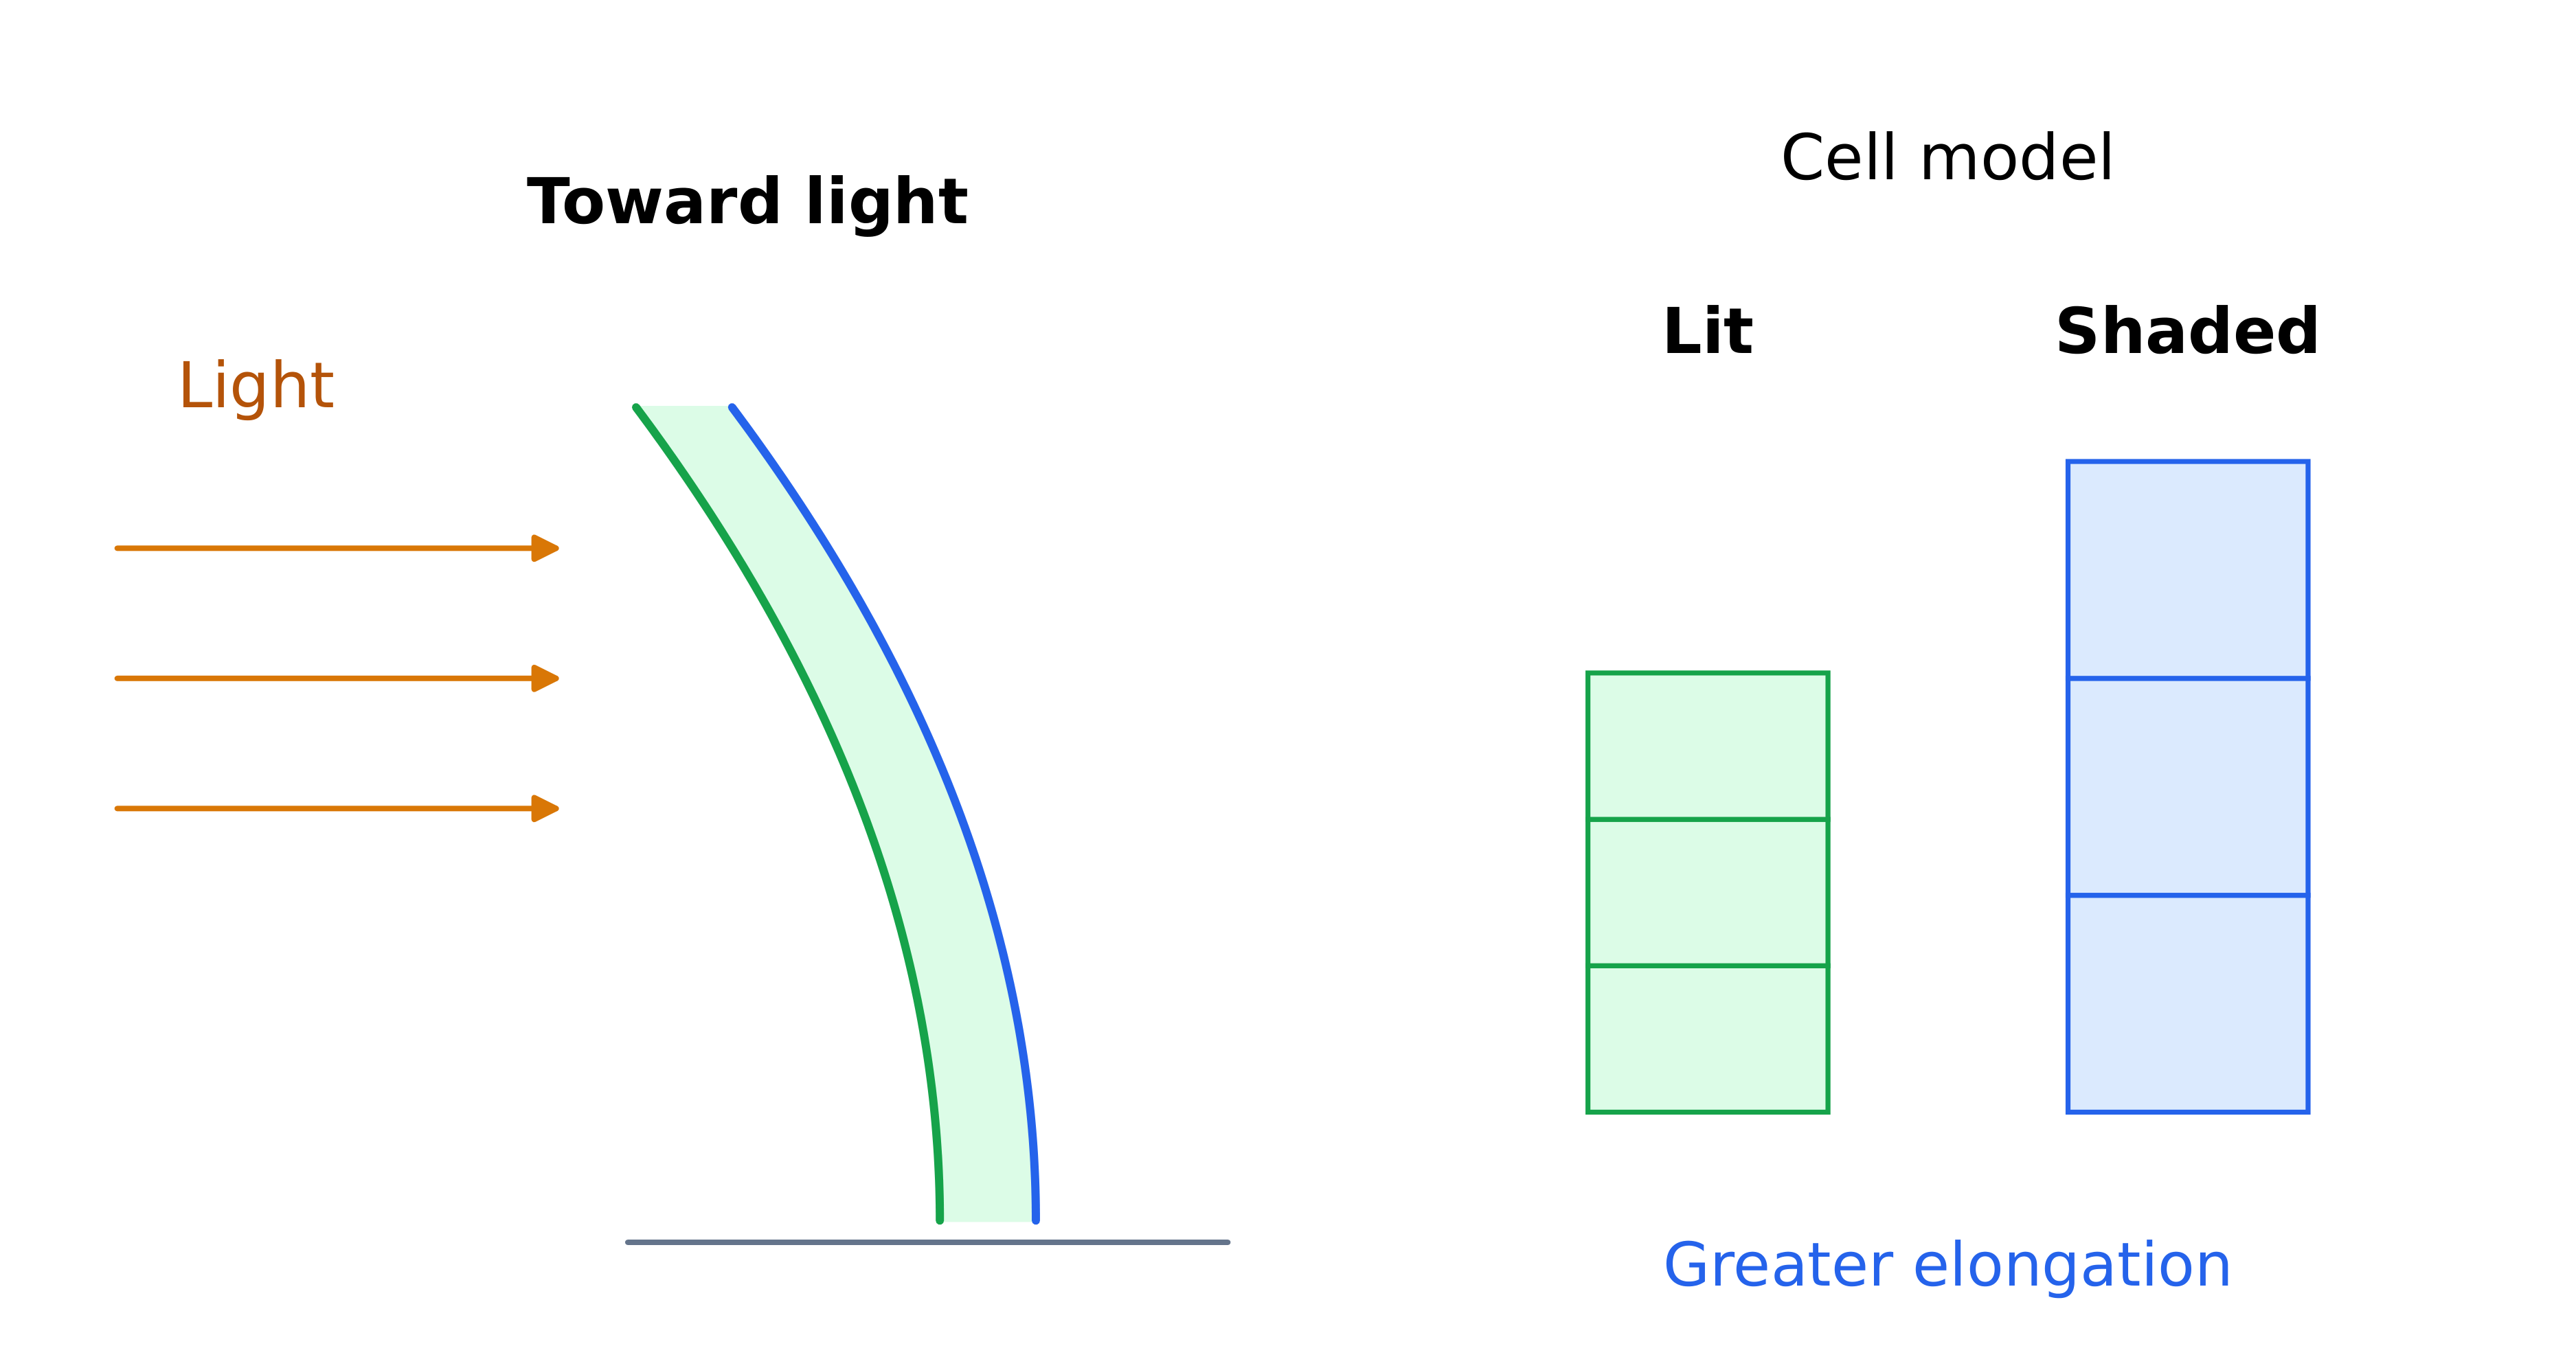
- In a simplified shoot under lateral light, greater auxin action on the shaded side of the elongating region promotes greater elongation there. The longer shaded side forms the outside of the curve, bending the shoot towards the light. Cells do not crawl towards the lamp, and the lit side is not the faster-growing side in this model.
- Asymmetric placement of auxin efflux carriers helps direct cell-to-cell transport. IAA is a weak acid: its protonated form can enter from a more acidic wall region, while much becomes deprotonated in the less acidic cytosol and needs transport proteins to exit efficiently. Influx routes and proton gradients also contribute; not every carrier hydrolyses ATP once per molecule.
AHL: Link wall acidification with turgor-driven elongation
- Auxin can promote proton pumping into the apoplast, lowering wall pH and favouring wall-loosening processes including expansin activity. Water uptake and turgor then help extend the loosened wall. The wall remains a supporting network; cellulose is not simply dissolved into glucose every time the cell lengthens.
- Arabidopsis hypocotyl experiments connect auxin perception, acidification and growth. Distinguish the signal, proton pump, wall response and water-driven extension. Tissue, concentration and developmental state matter; the shoot model does not imply that auxin accelerates every root and shoot equally.
AHL: Which sequence explains shoot bending towards lateral light in the simplified auxin model?
Difficulty 1/5 · 100 coins + a small bonus on first completion today
Polar transport and signalling support unequal elongation. Apoplast acidification favours loosening; turgor supports extension while the wall remains a supporting network.
AHL: Coordinate root and shoot with interacting hormones
- Shoot tips and young tissues are important auxin sources, with transport towards roots influencing development. Roots produce cytokinins that can travel towards shoots and influence growth. Neither hormone is produced exclusively in one organ; local production, transport and sensitivity also matter.
- Auxin and cytokinin interactions adjust development and resource allocation. Root uptake and shoot photosynthesis support each other, so the response depends on hormonal balance and tissue context. Plants can produce and receive signals without animal-style endocrine glands, and increasing one hormone does not guarantee unlimited whole-plant growth.
AHL: Identify positive feedback in tomato ripening
- Ethylene, also named ethene, is a gaseous phytohormone. In climacteric fruits such as tomato, ethylene signalling can promote ripening changes and further ethylene production. Signal spread between nearby fruits can help synchronize colour, softening and other ripening changes; the return influence on production makes this positive feedback.
- UC Davis observations and guidance describe mature-green tomato responses to supplied ethylene. Developmental competence matters, and not every fruit follows this pattern. Positive feedback reinforces a change rather than making it inherently beneficial or unlimited: substrates, maturation and senescence still constrain the system.
AHL: Which feature makes the climacteric-tomato ripening model a positive-feedback example?
Difficulty 1/5 · 100 coins + a small bonus on first completion today
The returning influence reinforces signal production. Developmental state, fruit type and finite resources limit the model; positive describes direction, not desirability.
Identify the internal environment and the flows behind a steady value
- Homeostasis regulates the conditions around cells, including blood plasma and tissue fluid. Core temperature, pH, glucose and osmotic concentration affect enzymes, membranes and cell volume. The internal environment is not simply the air beside the skin. A suitable range allows ordinary fluctuation and delays, rather than requiring a perfectly fixed number.
- A steady glucose concentration can coexist with absorption, use and storage. Regulation changes these flows. The model reference 5.0 mmol/L below is an invented classroom value, not a personal diagnostic target. A return towards a starting value is consistent with control, but could also follow the end of a disturbance; identify the mechanism and evidence.
Locate glucose detection and hormonal coordination in the pancreas
- Pancreatic islets contain beta cells and alpha cells. Rising glucose normally stimulates beta-cell insulin secretion; falling glucose normally promotes alpha-cell glucagon secretion. Endocrine cells can detect a condition and change signalling, so a separate conscious brain decision is not required before every correction.
- The hormones travel in blood and affect responsive cells. Increasing glucose removal opposes a rise; increasing glucose supply opposes a fall. As the stimulus declines, corrective drive usually declines, although basal secretion can remain. Negative feedback does not mean a harmful response, a negative concentration or a requirement for every effector to switch completely off.
Explain insulin through transport and metabolism rather than a vague arrow
- Insulin promotes glucose uptake in skeletal muscle and adipose tissue, including recruitment of GLUT4 transporters to the cell surface. It also promotes storage and suppresses liver glucose output. Glucose can be incorporated into glycogen, but insulin is the signal controlling pathways, not the enzyme physically joining glucose units.
- Liver regulation differs from the muscle/adipose GLUT4 mechanism. Do not put the same transporter response into every cell or imply that no tissue can use glucose without insulin. Target-cell receptors, transport and metabolic effects connect the circulating signal to lower blood glucose.
Which statement correctly connects insulin with target-cell mechanisms?
Difficulty 1/5 · 100 coins + a small bonus on first completion today
Insulin is a hormone controlling transport and metabolic processes. Liver glucose handling must not be copied directly from the muscle/adipose transporter model.
Distinguish liver glucose supply from muscle glycogen use
- Glucagon promotes liver glycogen breakdown and glucose production from suitable non-carbohydrate substrates. These are distinct pathways: breaking down a stored polymer is not the same as making glucose from other materials. Increased supply to blood opposes a low-glucose disturbance.
- Muscle glycogen mainly supports the muscle's own metabolism; it is not simply exported as free glucose by the liver's route. Meals, fasting, activity and other hormones also affect the balance. The insulin–glucagon model captures key opposing actions without claiming that only two substances ever influence glucose.
Read a meal-response trace with two explicit percentage denominators
- In this invented record, glucose at 0, 15, 30, 60, 90 and 120 minutes is 5.0, 6.5, 7.0, 6.0, 5.3 and 5.1 mmol/L. Insulin is shown separately in relative units. The largest observed glucose value is 7.0 at 30 minutes; its rise from 5.0 is 2.0 mmol/L, or 40% of that reference.
- The subsequent fall from 7.0 to 5.1 is 1.9 mmol/L, about 27.1% of the peak, because this question uses 7.0 as denominator. The actual peak may lie between samples. An insulin relative-unit value cannot be directly compared with glucose mmol/L as if both measured the same quantity.
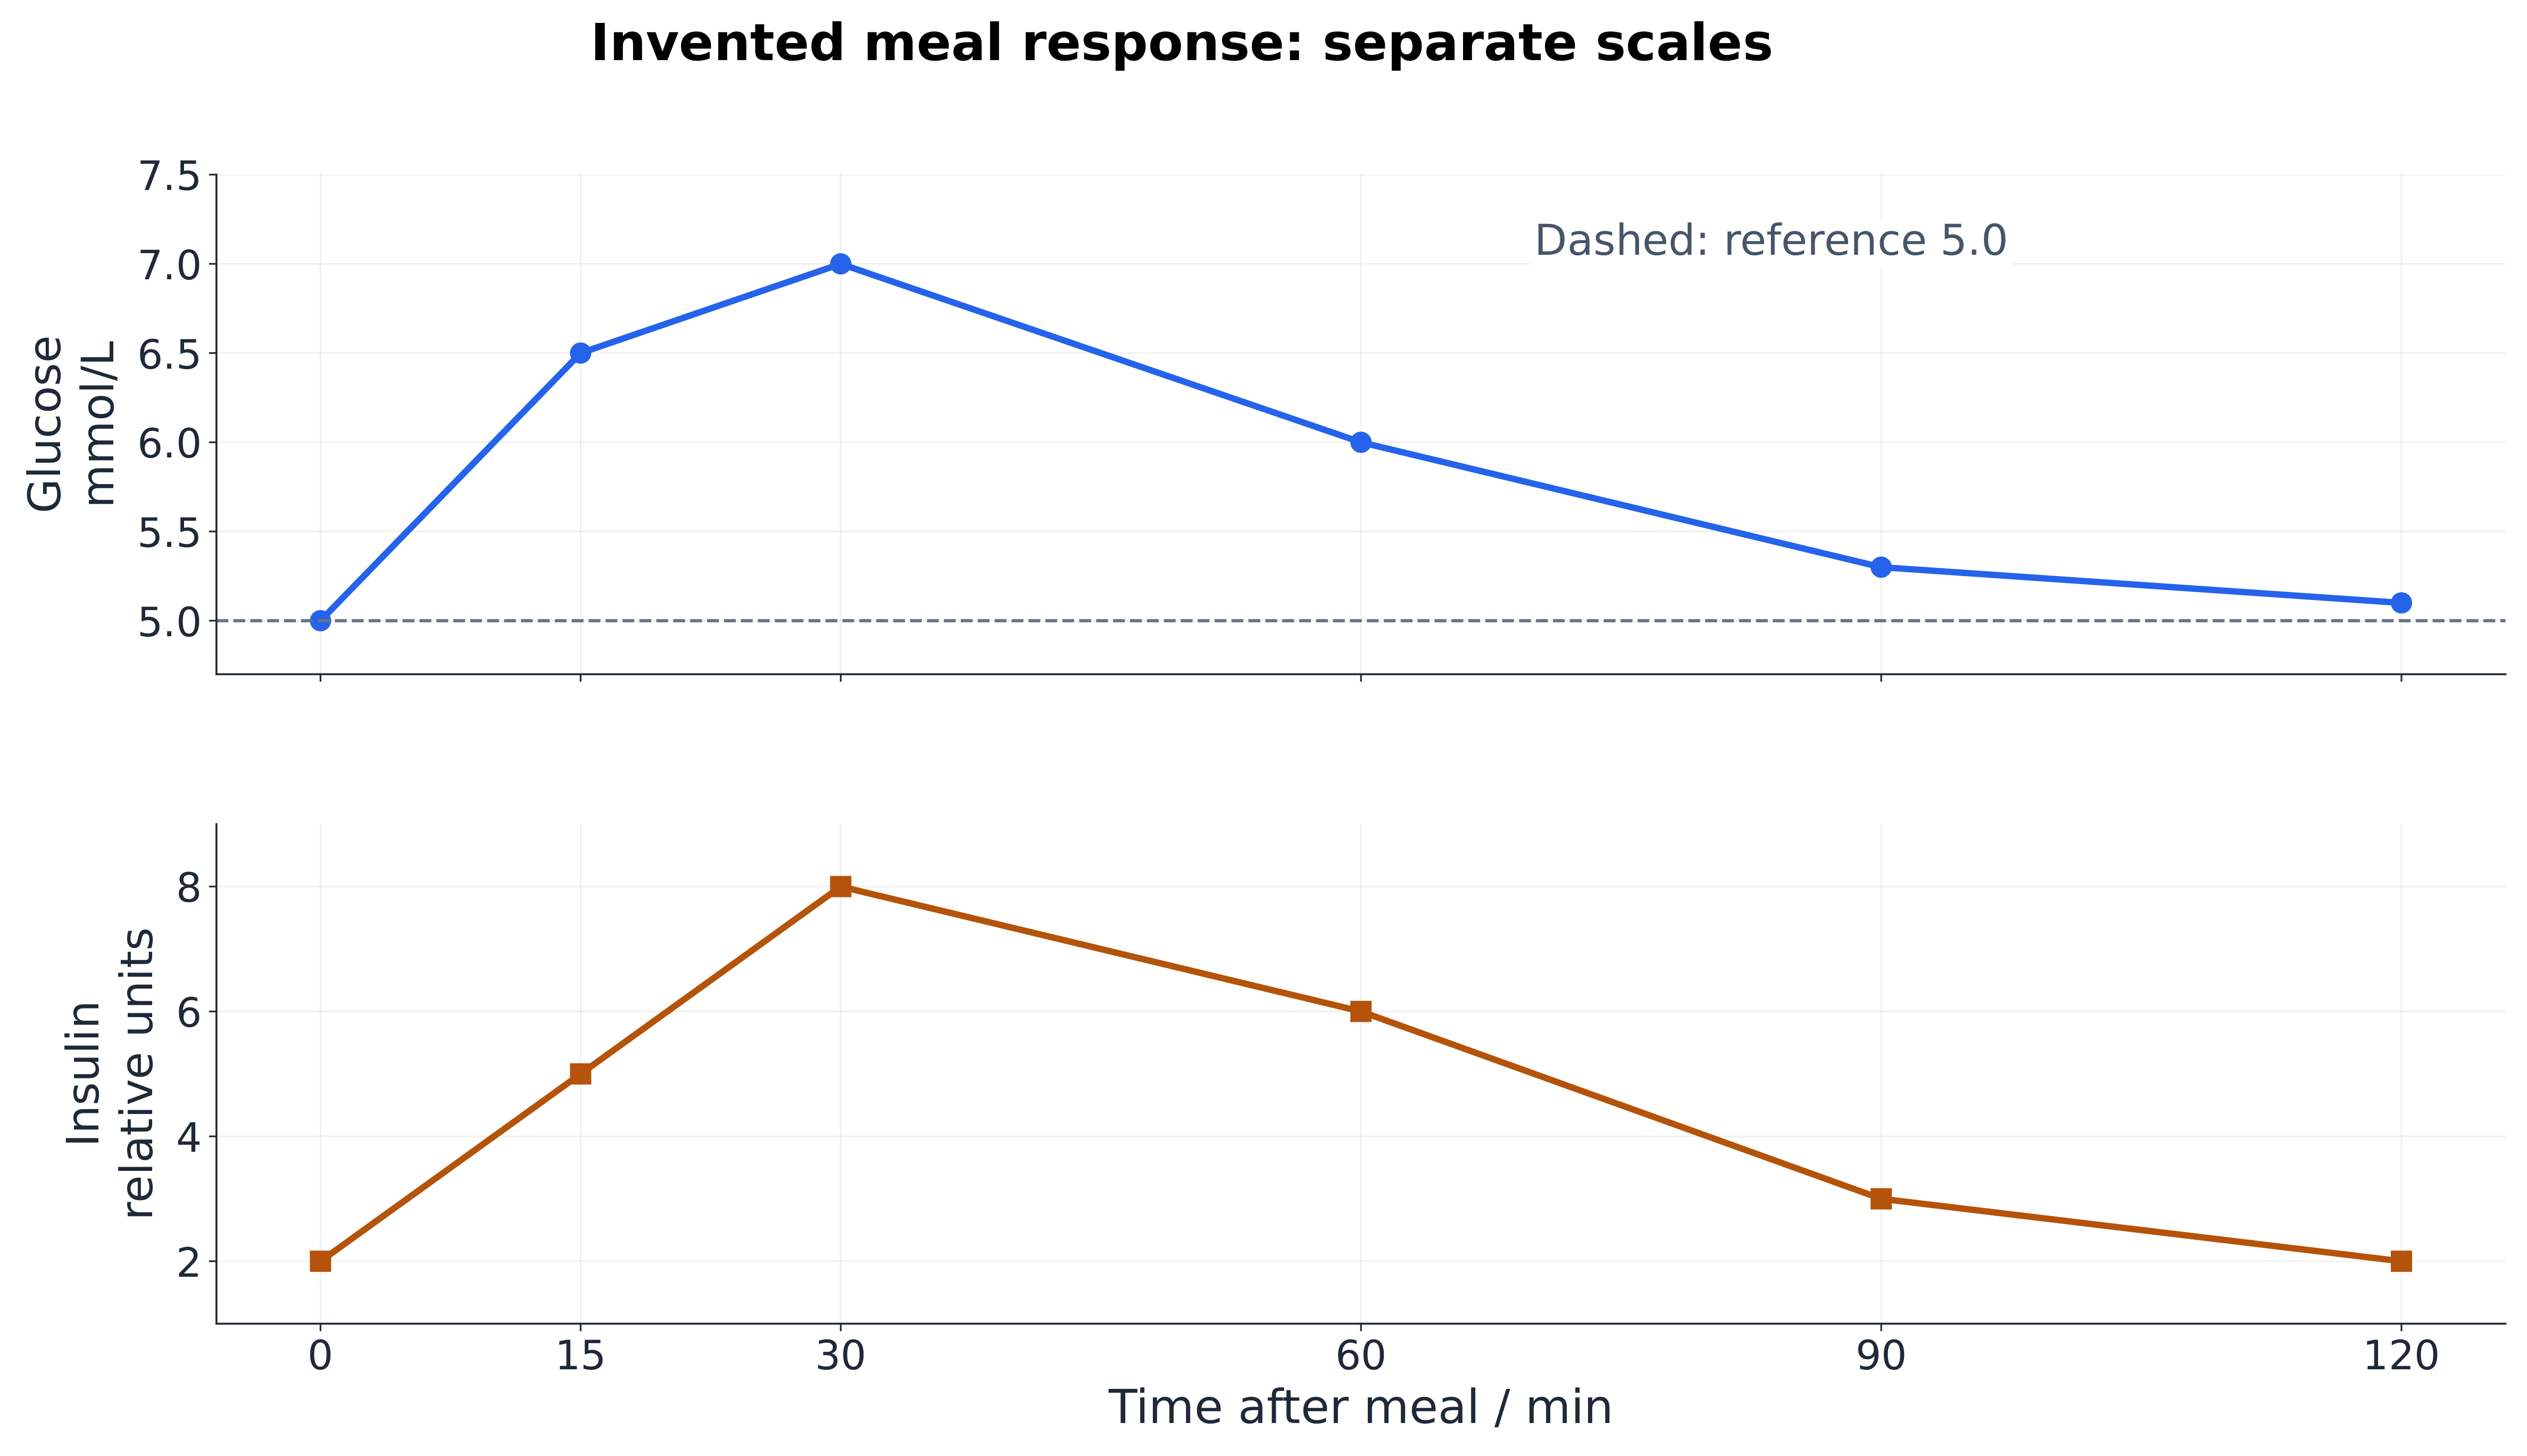
In the invented trace, glucose falls from its observed peak of 7.0 to 5.1 mmol/L. Find the percentage decrease relative to the peak.
Difficulty 2/5 · 140 coins + a small bonus on first completion today
(7.0 − 5.1)/7.0 × 100 ≈ 27.14%, about 27.1%. The earlier rise from 5.0 to 7.0 is 40% because it uses a different starting denominator.
Separate a compatible time sequence from a unique causal test
- Insulin rises before glucose later falls in the invented record, which fits the regulatory model. Timing alone does not exclude changes in meal absorption, activity or other signals. A glucose-only trace does not measure insulin at all. Controlled comparisons can test a proposed contribution more strongly than an untested causal caption.
- Analyse supplied or approved data with standardized timing, meal description, activity and method. Independent participants provide biological replication; repeated measurements from one person provide a time series, not several independent people. Do not provoke abnormal glucose values or use a classroom pattern to diagnose anyone.
Three glucose measurements are taken from one participant after a meal. What do they provide?
Difficulty 1/5 · 100 coins + a small bonus on first completion today
Readings from one person remain related. Timing and recovery can support a model without uniquely identifying a causal pathway.
Compare diabetes by the failed mechanism rather than the person's age
- Type 1 diabetes usually involves immune-mediated beta-cell destruction and severe insulin deficiency. It can begin at any age; eating sugar is not the simple cause. Replacement insulin and monitoring address the missing signal, with nutrition and activity also supporting management. General lifestyle measures do not replace absent insulin. See NIDDK's type 1 explanation.
- Type 2 involves insulin resistance and inadequate beta-cell compensation; insulin can initially be abundant but insufficient for the response needed. Family history, activity, age and excess body fat can affect risk without determining one person's outcome. Nutrition/activity changes can reduce risk in susceptible groups, and treatment can include medicines and sometimes insulin. NIDDK's type 2 explanation supports this distinction. Similar high glucose does not establish identical mechanisms.
Which comparison fits the physiological teaching model?
Difficulty 1/5 · 100 coins + a small bonus on first completion today
Age or one high-glucose trace does not identify the mechanism. The distinction concerns insulin supply and response; clinical assessment is separate from this classroom model.
Trace temperature information and distinguish rapid from endocrine responses
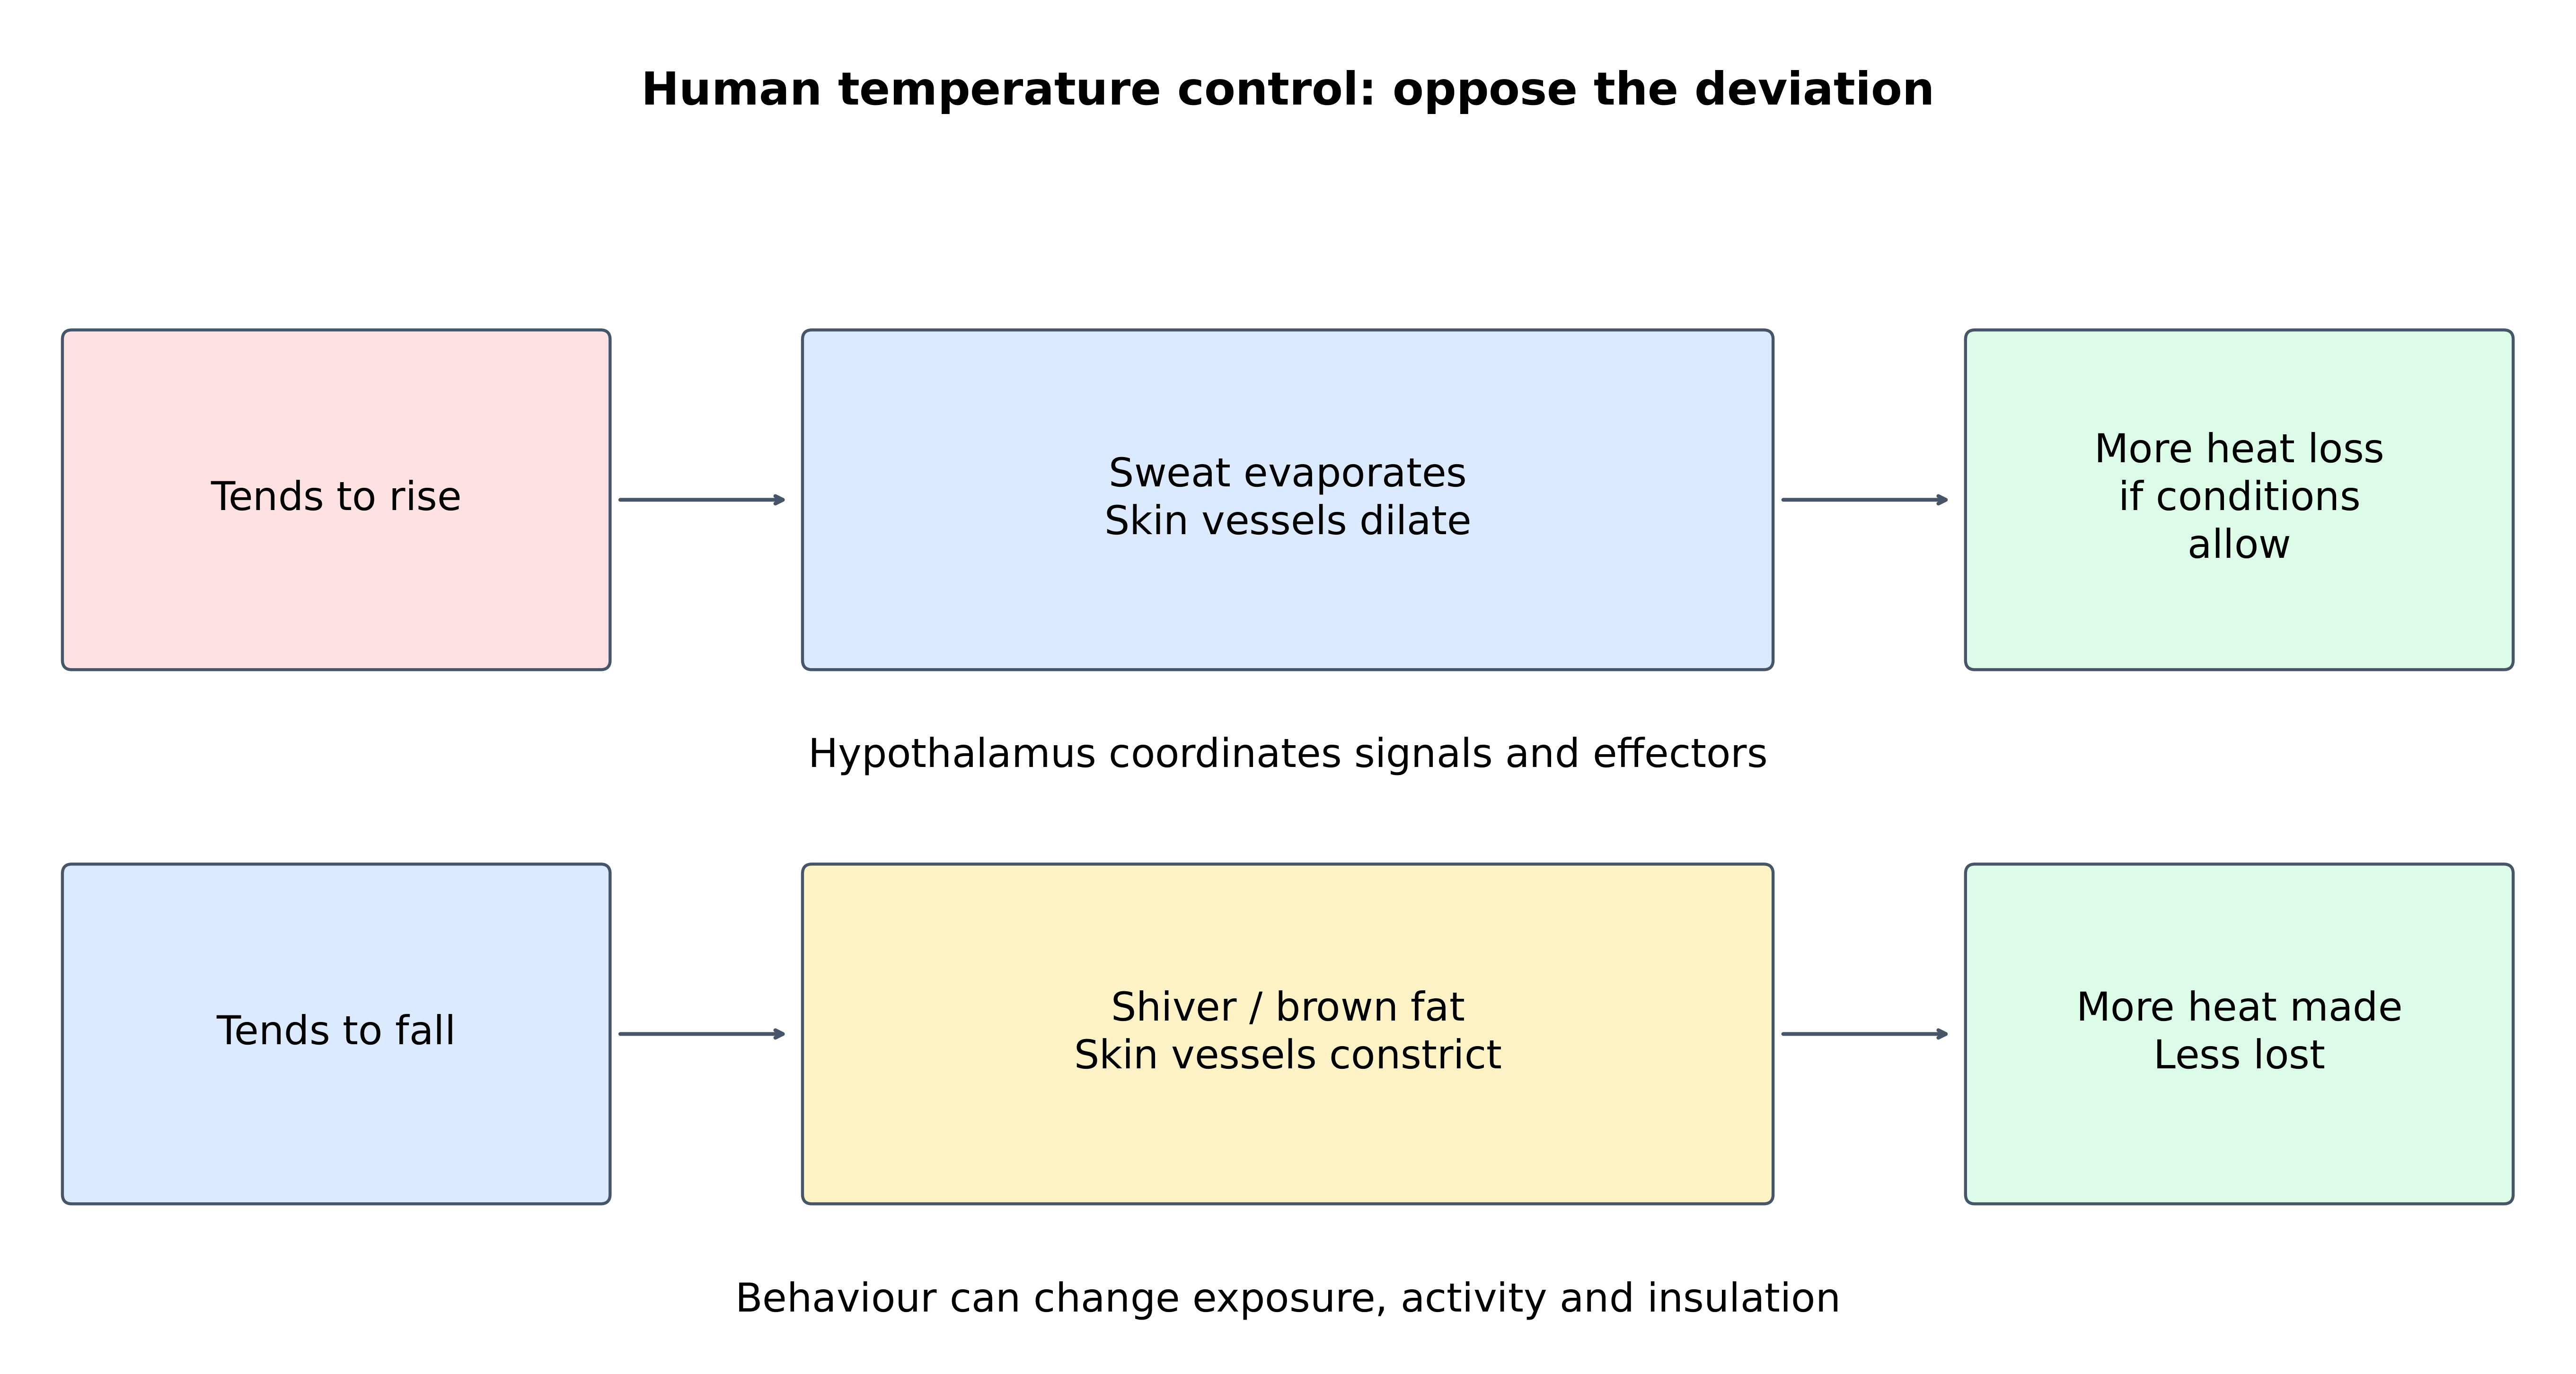
- Skin thermoreceptors supply information about peripheral conditions; temperature-sensitive hypothalamic regions also respond to internal conditions. The hypothalamus coordinates responses, rather than measuring only outdoor air. Sweating, skin-vessel smooth muscle and skeletal muscle can respond through rapid neural pathways.
- A longer endocrine route links hypothalamic signals to anterior-pituitary TSH, thyroid stimulation and thyroid hormones including thyroxin, affecting metabolism. The thyroid produces thyroxin; the pituitary releases TSH. Thyroxin is not the immediate motor signal for each shiver. Name source, target and timescale instead of drawing every response as one identical hormonal arrow.
Explain skin blood flow through the direction of energy transfer
- Vasodilation increases skin blood flow and can support heat loss; vasoconstriction reduces it and conserves heat near the core. Arterioles change diameter, while capillaries do not physically move nearer the surface. State how changed flow alters heat exchange instead of saying that blood itself becomes colder on command.
- Dry exchange depends on the temperature gradient. If surroundings are hotter than skin, increased exposure can add heat rather than remove it. Clothing, wind and radiant conditions matter too. The figure compares typical warming/cooling responses, not unlimited independence from the environment.
Connect sweating with evaporation and humidity
- Sweat cools skin when water evaporates and takes energy from the surface. Water that drips away has not produced the same evaporative cooling there. High humidity reduces the water-vapour gradient, restricting evaporation even when sweat production is high. Sweating and evaporative heat loss are related but distinct quantities.
- Shade, appropriate clothing and reduced exertion can change heat gain or production; shelter and insulation can conserve heat in the cold. Behaviour works alongside physiology. Water availability and environmental conditions constrain responses, so more sweating is not proof of a larger fall in core temperature.
Connect shivering and brown fat with metabolism
- Shivering involves repeated involuntary skeletal-muscle contractions whose metabolism generates heat. Brown adipose tissue can increase heat production through uncoupled respiration: proton return across the inner mitochondrial membrane bypasses ATP synthase, so less of the available energy is captured in ATP. Respiration has not stopped. Brown fat is important in infants and can also be active in adults.
- Hair erection can trap an insulating air layer in a furred mammal, but sparse human body hair limits this effect. Goosebumps are not equivalent to growing a thick coat. Distinguish heat generation, insulation and external exchange; each alters energy balance through a different route.
Calculate heat retention without inventing a temperature change
- An invented short interval has heat generation 160 J/s and loss 120 J/s: net retention is 40 J/s. Over ten minutes, multiply by 600 seconds to obtain 24,000 J, or 24 kJ. A second example with generation 180 J/s and loss 130 J/s for eight minutes also retains 24 kJ, because 50 × 480 = 24,000.
- These data alone do not specify the temperature rise: effective mass/heat capacity and the model's heat-balance assumptions are needed. For invented repeat readings 36.8, 37.0 and 37.2 degrees Celsius, mean is 37.0. Name site, instrument, timing, activity and ambient conditions; repeats from one person are not three independent participants.
Invented heat generation is 180 J/s and loss is 130 J/s, both constant for eight minutes. Calculate energy retained in kJ.
Difficulty 2/5 · 140 coins + a small bonus on first completion today
Net rate = 180 − 130 = 50 J/s; eight minutes = 8 × 60 = 480 s. Energy retained = 50 × 480 = 24,000 J; divide by 1,000 to obtain 24 kJ. Temperature rise additionally needs an effective heat capacity and appropriate model assumptions.
Build a physiological explanation from detection to measured recovery
- For glucose, name pancreatic cells, hormone, target and the process changing supply or removal. For temperature, identify receptor/coordinator and the effector changing heat generation or exchange. State how the response opposes the initial disturbance and why it should weaken as conditions recover.
- Support the explanation with measurements and correct denominators, while separating observations from unmeasured signals. Explain delays, alternative causes, experimental independence and environmental limits. Suitable regulation can include continuing material flows and ordinary fluctuation; a flat graph is neither required nor sufficient to establish the mechanism.
Explain negative feedback for high glucose and for a rise in core temperature. Connect detection to effectors, name one measurement limitation, and distinguish observed recovery from proof of a unique mechanism.
Trace mechanisms and limits, rather than labelling any fall in a graph negative feedback.
AHL: Separate excretion, osmotic concentration and the nephron route
- Excretion removes metabolic waste, including urea formed from amino-acid nitrogen. Egestion removes unabsorbed digestive material. Osmoregulation controls the osmotic concentration of body fluids; concentrating urine does not automatically increase waste production. Under an ideal complete-dissociation model, 0.10 mol/L NaCl contributes about 0.20 osmol/L because each formula unit yields two ions.
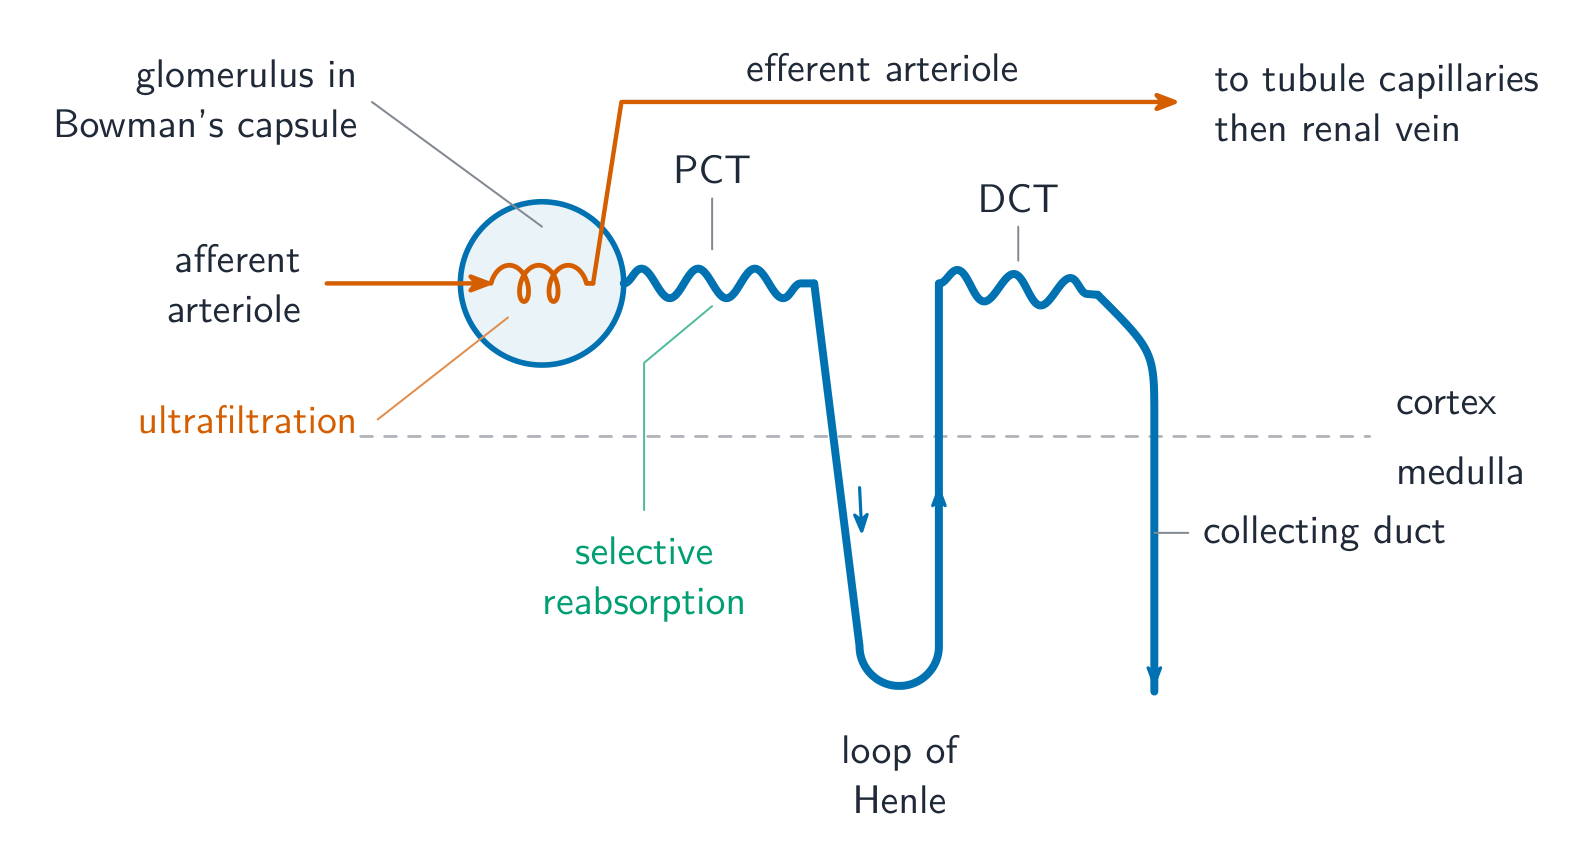
- A nephron has a glomerular filter and a tubular route. Blood continues in vessels while filtrate enters the tubule; final urine passes to the renal pelvis, ureter and bladder. The ureter is not the renal vein, and the bladder stores rather than produces urine. NIDDK's kidney explanation separates filtration from tubular return to blood.
AHL: Distinguish pressure filtration from selective reabsorption
- Glomerular hydrostatic pressure supports water/small-solute passage into Bowman's capsule, while blood cells and most large proteins remain in blood. Useful glucose enters filtrate too: the filter does not classify a molecule as useful or waste. In the proximal convoluted tubule, microvilli provide area and mitochondria support transport; sodium gradients help drive glucose cotransport, while water follows suitable osmotic gradients.
- Reabsorption returns material from tubule to blood; secretion moves some substances the other way. Ignoring secretion for a specified substance, excreted amount equals filtered minus reabsorbed. Invented daily water values of 180 L filtered and 1.5 L urine imply 178.5 L reabsorbed, about 99.17%. Repeated filtration does not mean drinking 180 L. Glucose recovery has finite transport capacity, so glucose in urine does not prove active disposal of glucose as a waste.
AHL: Connect loop permeability with a medullary osmotic gradient
- The descending limb permits water movement more readily, while the ascending limb is relatively impermeable to water. Salt transport, including active transport in the thick ascending segment, supports concentrated medullary tissue fluid. Opposing flow and different permeabilities help maintain the gradient; do not draw water following salt freely out of the ascending limb.
- A suitably permeable collecting duct can then lose water down the osmotic gradient. ATP supports salt transport but does not directly push water through aquaporins. Urea recycling and blood exchange also contribute in real kidneys, and blood flow must avoid immediately washing the gradient away. The loop alone does not determine final urine concentration independently of collecting-duct permeability.
AHL: Trace ADH from its synthesis site to channel insertion
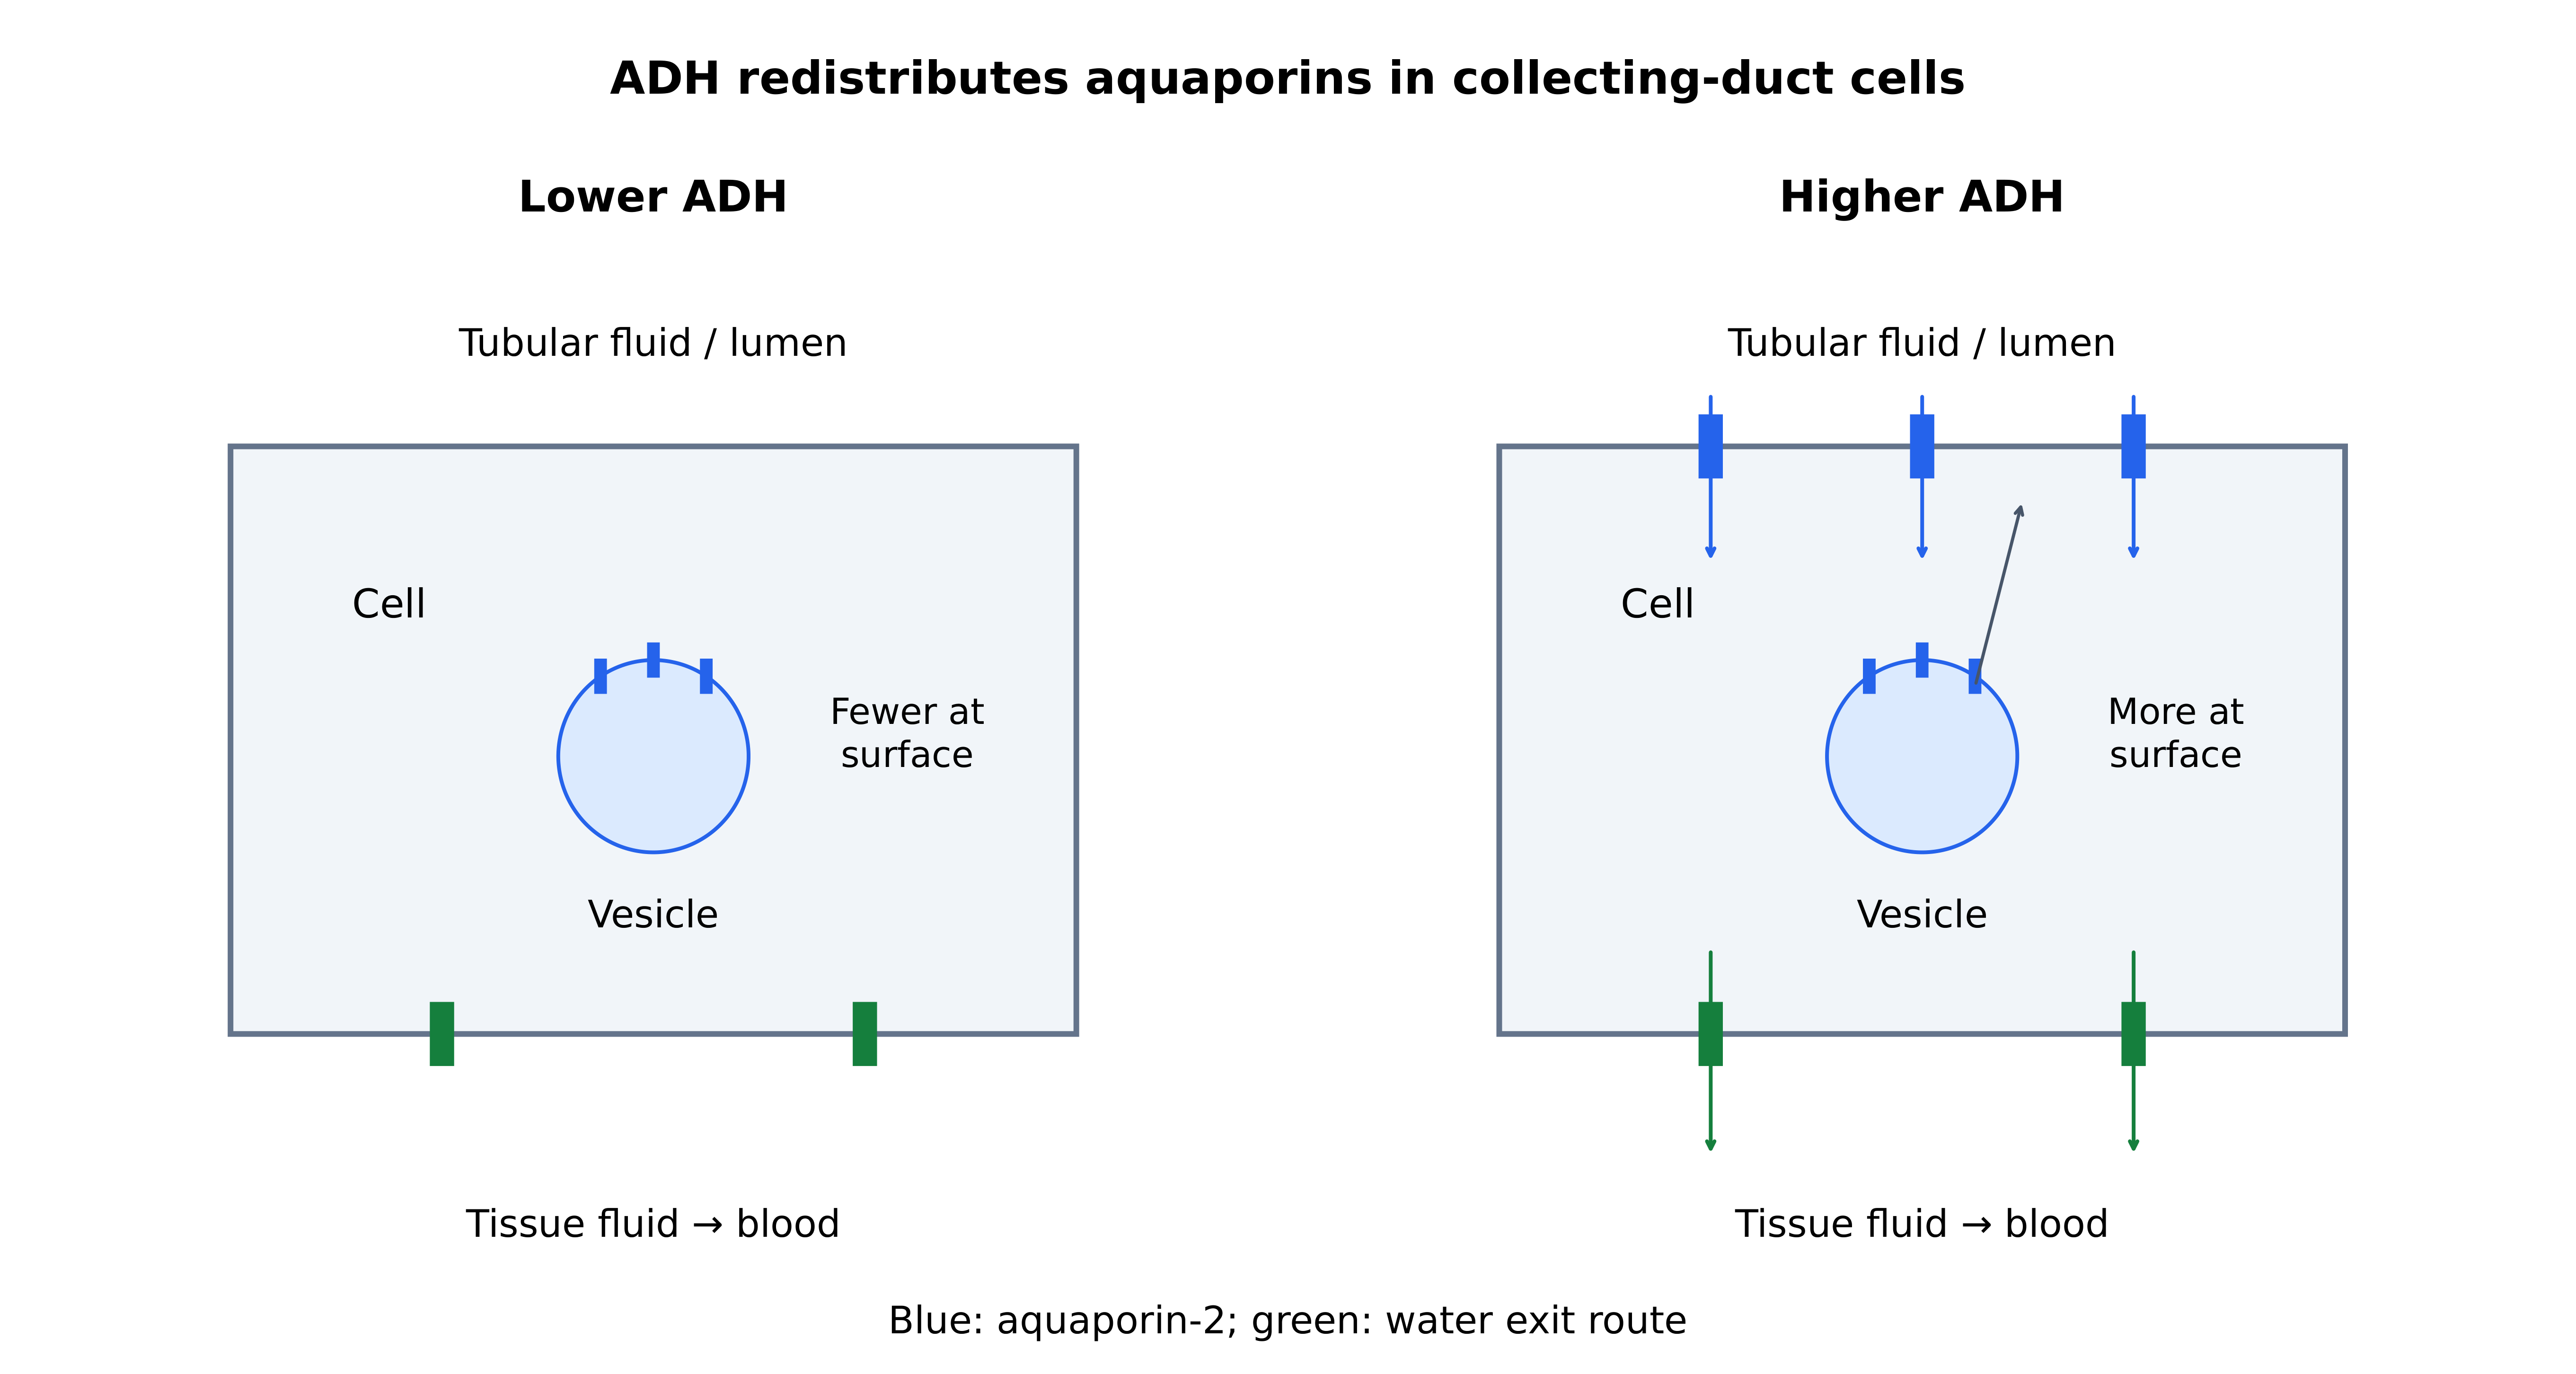
- Raised blood osmotic concentration stimulates hypothalamic osmoreceptors. ADH is synthesized in hypothalamic neurons and released into blood from the posterior pituitary. It promotes insertion of aquaporin-2 channels into the collecting-duct membrane facing tubular fluid, increasing water permeability. A route across the other side lets water move towards tissue fluid and blood.
- With a suitable medullary gradient, increased permeability promotes water reabsorption, reducing urine volume and generally increasing its concentration. Lower osmotic drive favours channel removal into vesicles and more dilute urine. This opposes the original disturbance; other volume/pressure signals also affect ADH. Distinguish synthesis, release, permeability and the gradient providing passive water-movement direction.
AHL: Which account correctly connects ADH with water reabsorption?
Difficulty 1/5 · 100 coins + a small bonus on first completion today
Distinguish synthesis from release, and channel permeability from the osmotic gradient. ATP supports relevant solute transport rather than directly pumping water through aquaporins.
AHL: Keep excretion rate separate from urine concentration
- At an invented constant urea excretion of 0.60 mmol/hour, urine flow 0.120 L/hour gives 5.0 mmol/L. Reducing flow to 0.030 L/hour gives 20 mmol/L. The concentration rises fourfold while the amount excreted each hour is unchanged. Amount per time divided by volume per time gives amount per volume.
- For a separate invented water balance, 150 L/day filtered and 1.2 L/day urine imply 148.8 L/day reabsorbed, or 99.2% of the filtered volume. This calculation assumes the stated balance and does not derive filtration rate directly from renal blood flow or diagnose a person's kidney function.
AHL: An invented daily balance has 150 L water filtered and 1.2 L excreted as urine. What percentage of filtered water is reabsorbed under the stated balance?
Difficulty 2/5 · 140 coins + a small bonus on first completion today
(150 − 1.2)/150 × 100 = 99.2%; reabsorbed volume is 148.8 L/day. The filtered volume is repeatedly processed fluid, not daily intake.
AHL: Urea excretion is 0.60 mmol/hour and urine flow is 0.030 L/hour. Calculate urine urea concentration.
Difficulty 2/5 · 140 coins + a small bonus on first completion today
0.60/0.030 = 20 mmol/L. Compared with 5 mmol/L at flow 0.120 L/hour, concentration is fourfold while excretion rate is unchanged.
AHL: Compare absolute organ flow with shares of changing output
- Invented wakeful-rest flow is muscle 1.00, gut 1.25, brain 0.75, kidney 1.10 and other organs 0.90 L/min, total 5.00. During vigorous exercise the corresponding values are 16.00, 0.60, 0.75, 0.40 and 2.25, total 20.00. Brain flow stays 0.75 while its share falls from 15% to 3.75%. Muscle flow rises sixteenfold and its share from 20% to 80%.
- Invented sleep allocations 0.90, 1.10, 0.70, 1.00 and 0.80 total 4.50 L/min; actual sleep-stage patterns vary. These are calculation models, not universal physiological values. Arteriole resistance and cardiac output redistribute perfusion, with local regulation too. Lower kidney flow remains nonzero, and neither percentage allocation nor total renal flow alone specifies filtration, urine production or waste excretion.
AHL: In the invented exercise allocation, brain flow is 0.75 L/min and total cardiac output is 20 L/min. What percentage reaches the brain?
Difficulty 2/5 · 140 coins + a small bonus on first completion today
0.75/20 × 100 = 3.75%. At rest the same absolute flow is 15% of 5 L/min; a smaller share does not necessarily mean a smaller absolute flow.
AHL: Explain why low urine volume, concentrated urine, reduced renal blood flow and an increased waste-production rate are different claims. Urea excretion stays at 0.60 mmol/hour while urine flow falls from 0.120 to 0.030 L/hour; calculate both concentrations to illustrate the distinction. Trace one ADH feedback response.
Concentration = amount excreted per time/urine volume per time. Initially 0.60/0.120 = 5 mmol/L; later 0.60/0.030 = 20 mmol/L, a 20/5 = fourfold rise despite unchanged excretion. Mechanism and material balance determine what this supports about production or renal blood flow.