Sampling and estimation
Introduced| English | Meaning |
|---|---|
| sample/ˈsæmpl/ | A subset of a population selected for observation, measurement or analysis. |
| population/ˌpɒpjʊˈleɪʃn/ | The entire set of individuals, items or outcomes about which a statistical study seeks information. |
| stratified/ˈstrætɪfaɪd/ | Describing sampling that divides a population into groups and samples within each group. |
| systematic/ˌsɪstəˈmætɪk/ | Describing sampling that selects members at a fixed interval after a starting point, usually chosen randomly. |
| cluster/ˈklʌstə/ | Describing sampling that selects whole groups from a population and studies members within the selected groups. |
| sampling distribution/ˈsæmplɪŋ ˌdɪstrɪˈbjuːʃn/ | sampling distribution |
| standard error/ˈstændəd ˈerə/ | The standard deviation of a statistic's sampling distribution, often estimated from a sample. |
| Central Limit Theorem/ˈsentrəl ˈlɪmɪt ˈθɪərəm/ | A theorem stating that, under suitable conditions, the sampling distribution of a mean approaches a normal distribution as sample size increases. |
| confidence interval/ˈkɒnfɪdəns ˈɪntəvl/ | An interval calculated from sample data using a method with a stated long-run probability of containing the population parameter. |
The poll that predicted the election
- A survey of 1000 people can predict the voting behaviour of 60 million. How?
- Sampling 样本 lets you draw conclusions about a whole population 总体 from a small, carefully chosen subset. The mathematics behind it is the foundation of all statistical inference.
Populations and samples
- A population is the entire group you want to study. A sample is a small group from the population.
- Good sampling needs randomness — every member must have a known chance of being selected.
- Sampling methods: simple random, stratified 分层 (proportional from each subgroup), systematic 系统 (every $k$th member), cluster 整群.
Stratified sampling. A school has 600 boys and 400 girls. A stratified sample of 50: $\dfrac{600}{1000} \times 50 = 30$ boys and $\dfrac{400}{1000} \times 50 = 20$ girls.
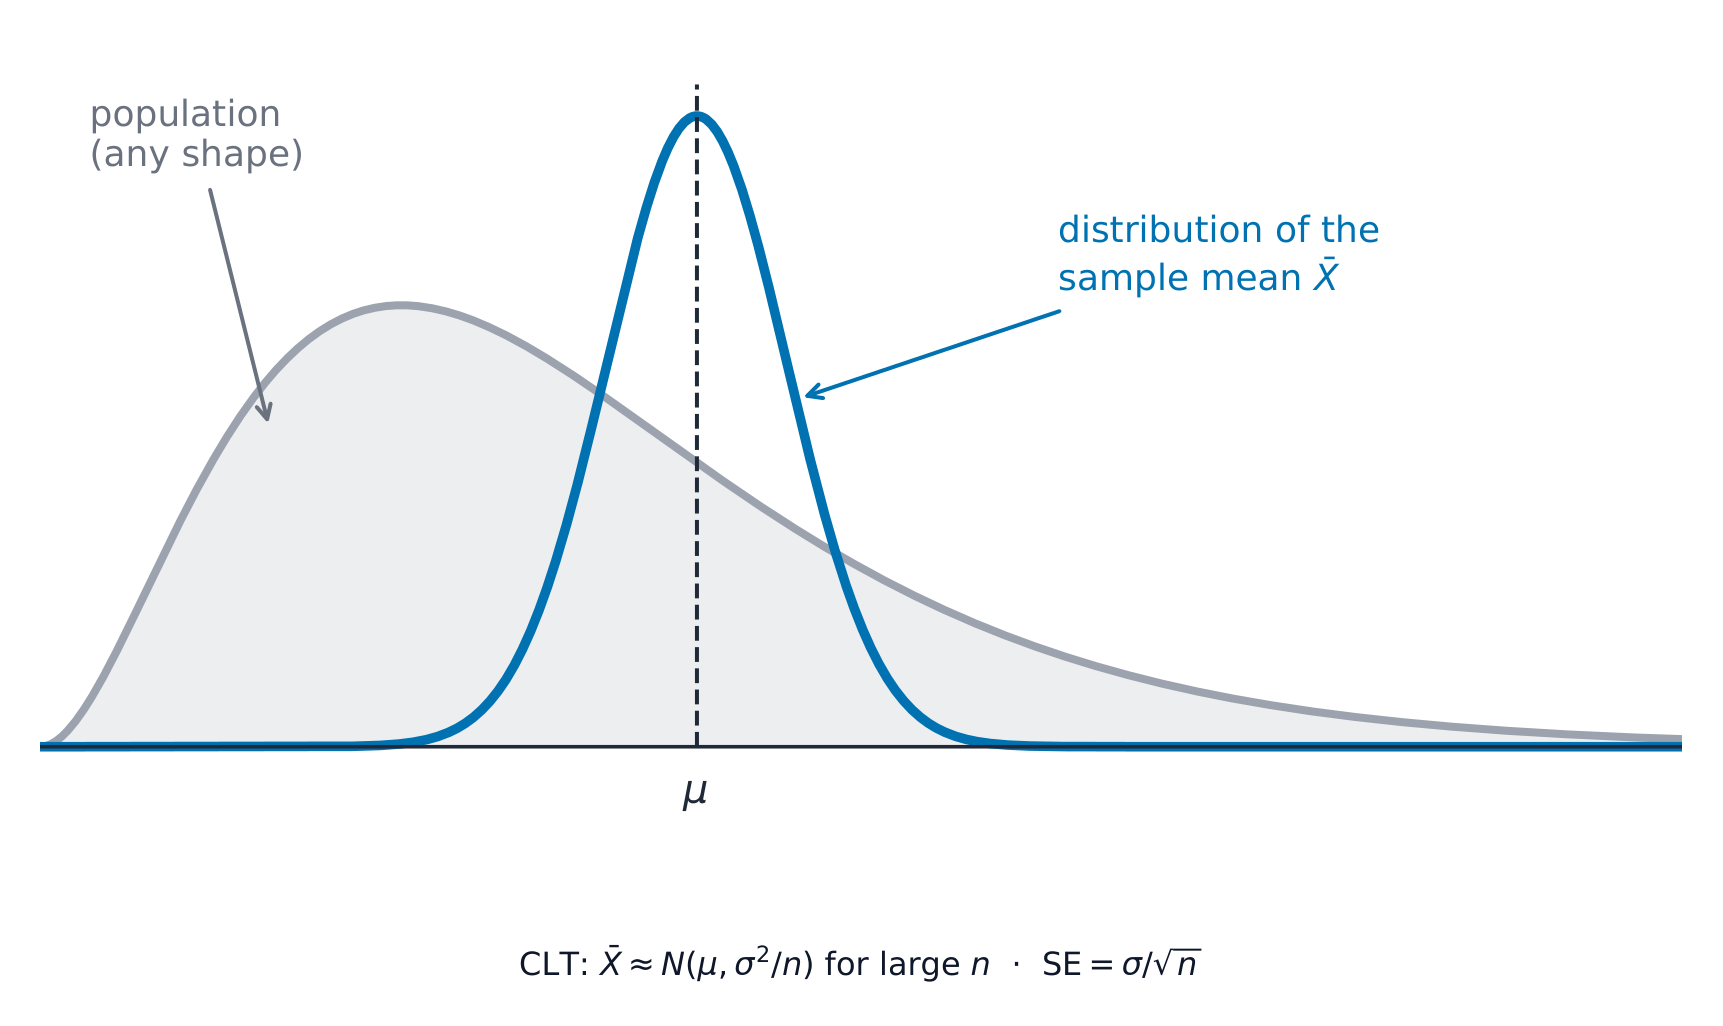
The sample mean is nearly normal whatever the population shape
The sampling distribution
X̄ ~ N(μ, σ²/n)
By the Central Limit Theorem, sample means follow a normal curve — narrower for bigger samples.
A school has 600 boys and 400 girls. A stratified sample of 50 needs how many boys?
Difficulty 2/5 · 140 coins + a small bonus on first completion today
(600/1000) × 50 = 30 boys.
The sampling distribution 抽样分布 of the mean
- The sample mean $\bar{X}$ is itself a random variable:
- The standard error 标准误 of the mean is $\dfrac{\sigma}{\sqrt{n}}$ — it shrinks as $n$ grows.

Statistics studies a sample to learn about a whole population
A population has σ = 8. For a sample of n = 64, what is Var(X̄) = σ²/n?
Difficulty 2/5 · 140 coins + a small bonus on first completion today
Var(X̄) = σ²/n = 64/64 = 1.
A population has σ = 10 and n = 25. The standard error σ/√n = ?
Difficulty 2/5 · 140 coins + a small bonus on first completion today
σ/√n = 10/√25 = 10/5 = 2.
Match each sampling idea to its meaning.
Difficulty 2/5 · 140 coins + a small bonus on first completion today
The CLT makes sample means normal; their spread is σ²/n, giving the confidence interval.
The Central Limit Theorem 中心极限定理
- By the Central Limit Theorem, for a large sample ($n \geq 30$), $\bar{X}$ is approximately normal, whatever the population's shape.
- This is one of the most powerful results in all of mathematics — it lets us use the normal distribution even when the data isn't normal.
CLT applies to the mean, not the data. The Central Limit Theorem says the distribution of $\bar{X}$ becomes normal — not the individual data points. The raw data can have any shape.

A 95% confidence interval 置信区间 reaches 1.96 standard errors each side of the sample mean
By the Central Limit Theorem, the sample mean is approximately normal for a large sample, whatever the population shape.
Difficulty 1/5 · 100 coins + a small bonus on first completion today
The CLT makes X̄ approximately normal as the sample size grows.
The Central Limit Theorem says the individual data points become normally distributed for large samples.
Difficulty 1/5 · 100 coins + a small bonus on first completion today
The CLT applies to the sample mean X̄, not the individual data points. The raw data can have any shape.
Confidence intervals
- A confidence interval gives a range that probably contains the true mean.
- For a normal population with known $\sigma$ (or a large sample), a 95% interval is:
- From a random sample find unbiased estimates of the mean and variance ('unbiased' = correct on average), and a confidence interval for a population proportion; random numbers help choose the sample.
A sample of n = 64 has σ = 8. What is the margin 1.96 × σ/√n for a 95% interval? (2 dp)
Difficulty 2/5 · 140 coins + a small bonus on first completion today
1.96 × 8/√64 = 1.96 × 8/8 = 1.96.
You've got it
- $E(\bar{X}) = \mu$, $\text{Var}(\bar{X}) = \dfrac{\sigma^2}{n}$; CLT makes $\bar X$ ≈ normal for large $n$
- a 95% confidence interval: $\bar{x} \pm 1.96\dfrac{\sigma}{\sqrt{n}}$
- good sampling needs randomness