Aggregate Demand and Aggregate Supply
Introduced| English | Meaning |
|---|---|
| price level/praɪs ˈlevl/ | A measure of the average level of prices across an economy. |
| aggregate demand/ˈæɡrɪɡeɪt dɪˈmænd/ | Total planned spending on an economy's goods and services at different general price levels. |
| aggregate supply/ˈæɡrɪɡeɪt səˈplaɪ/ | The total output firms are willing and able to produce at different general price levels over a specified period. |
| consumption/kənˈsʌmpʃn/ | The use or purchase of goods and services to satisfy needs and wants. |
| investment/ɪnˈvestmənt/ | Spending on assets intended to provide future returns or increase productive capacity. |
| government spending/ˈɡʌvənmənt ˈspendɪŋ/ | Expenditure by government on goods, services, transfers and other activities. |
| net exports/net ˈekspɔːts/ | The value of exports minus the value of imports over a period. |
The supply and demand of a whole economy
- Zoom out from one market to the entire economy, and the same logic scales up: total demand and total supply set the overall price level 价格水平 and output.
- Aggregate demand 总需求 (AD) and aggregate supply 总供给 (AS) are the master diagram of macroeconomics.
Aggregate demand
- AD is total planned spending in the economy:
- C consumption 消费, I investment 投资, G government spending 政府支出, (X − M) net exports 净出口. The AD curve slopes down against the price level.

Real GDP swinging around its long-run trend
Aggregate demand & supply
AD and AS cross at the price level and national output.
If C = 600, I = 200, G = 300, X = 150, M = 100, what is AD = C + I + G + (X − M)?
Difficulty 2/5 · 140 coins + a small bonus on first completion today
600 + 200 + 300 + (150 − 100) = 1100 + 50 = 1150.
Which is NOT a component of aggregate demand?
Difficulty 1/5 · 100 coins + a small bonus on first completion today
AD = C + I + G + (X − M); saving is a withdrawal, not a component of AD.
In AD = C + I + G + (X − M), the term (X − M) is called net ______.
Difficulty 1/5 · 100 coins + a small bonus on first completion today
Exports minus imports = net exports.
Aggregate supply and equilibrium
- AS is total planned output; it slopes up (higher prices reward more production).
- Where AD meets AS sets the equilibrium price level and real GDP.
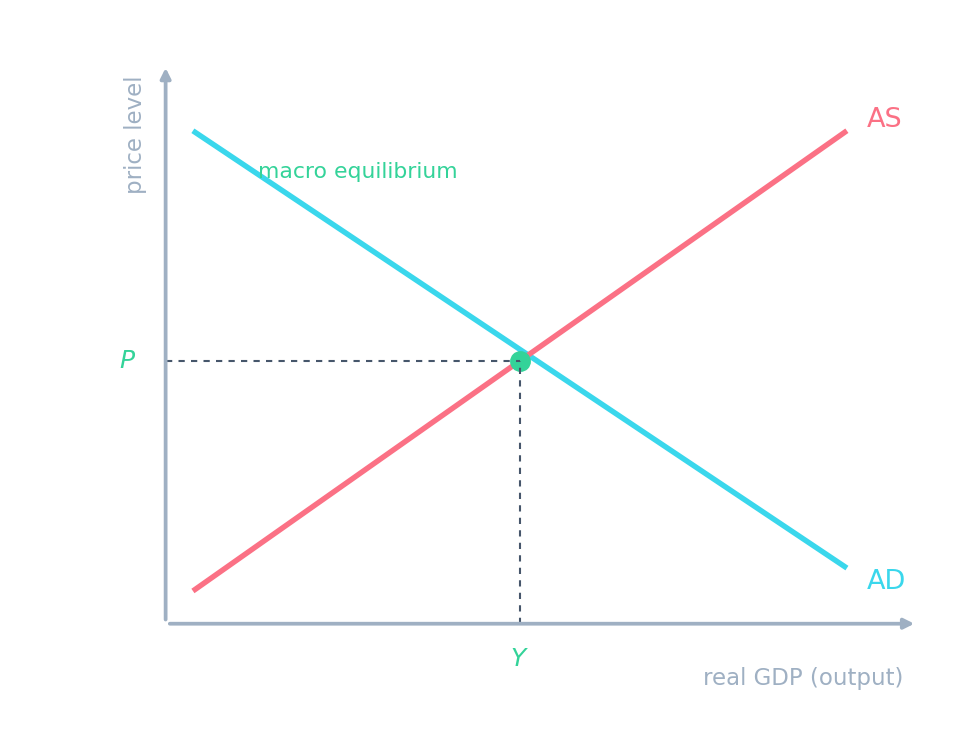
AD and AS cross to set the economy's price level (P) and real output (Y).
Worked example. If C = 600, I = 200, G = 300, X = 150 and M = 100, then AD = 600 + 200 + 300 + (150 − 100) = 1150.
The equilibrium price level and real output are set where AD meets AS.
Difficulty 1/5 · 100 coins + a small bonus on first completion today
Their intersection determines the macro equilibrium.
Shifts
- AD shifts with confidence, interest rates, government policy, or the exchange rate.
- A rightward AD shift raises both output and the price level (if AS slopes up).

Demand-pull and cost-push inflation on the AD-AS diagram
A rise in consumer confidence shifts AD right, which (with an upward AS) raises:
Difficulty 1/5 · 100 coins + a small bonus on first completion today
A rightward AD shift along an upward AS raises real GDP and the price level.
You've got it
- AD $= C + I + G + (X - M)$, slopes down; AS slopes up
- they cross to set the equilibrium price level and real GDP
- a rightward AD shift raises output and the price level
Write from aggregate demand of 500
- Consumption is 300, investment is 80 and government spending is 100.
- Exports are 70 and imports are 50.
What is aggregate demand?
AD equals C plus I plus G plus exports minus imports.
What is aggregate demand?
Difficulty 1/5 · 100 coins + a small bonus on first completion today
Net exports are 20, and the domestic parts sum to 480.