Correlation and elasticity
Introduced| English | Meaning |
|---|---|
| correlation/ˌkɒrɪˈleɪʃn/ | A statistical association between variables, which does not by itself establish causation. |
| scatter graph/ˈskætə ɡræf/ | scatter graph |
| positive/ˈpɒzɪtɪv/ | positive |
| negative/ˈneɡətɪv/ | negative |
| causation/kɔːˈseɪʃn/ | A relationship in which a change or event helps bring about another change or event. |
| income elasticity/ˈɪŋkʌm ɪlæˈstɪsɪti/ | The percentage change in quantity demanded divided by the percentage change in income, other factors unchanged. |
| promotional/prəˈməʊʃənl/ | promotional |
Does spending more actually sell more?
- A firm doubles its advertising — do sales follow? To answer, it looks for a relationship between the two.
- Correlation 相关性 measures how strongly two variables move together.
If sales rise as advertising rises, the two show:
Difficulty 1/5 · 100 coins + a small bonus on first completion today
Both moving up together is positive correlation.
A graph that plots paired data points to show a relationship is a ______ graph.
Difficulty 1/5 · 100 coins + a small bonus on first completion today
A line of best fit summarises the correlation.
Scatter graphs 散点图 and correlation
- A scatter graph plots paired data (e.g. advertising vs sales).
- Positive 正相关 correlation: both rise together. Negative 负相关: one rises as the other falls. None: no pattern.
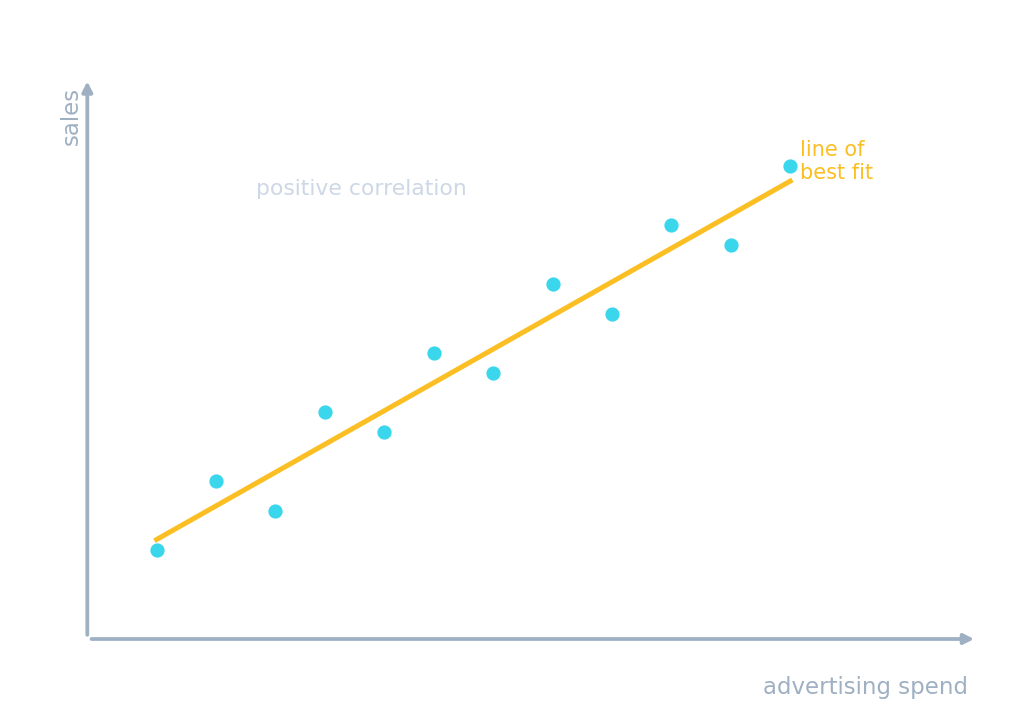
A line of best fit summarises the relationship — here, positive correlation.
Correlation
r measures the link
Correlation r shows how closely two variables move together — but it isn't causation.
A strong correlation between two variables:
Difficulty 1/5 · 100 coins + a small bonus on first completion today
Correlation is not causation — a third factor may explain it.
Two variables can be strongly correlated because of a third, hidden factor.
Difficulty 1/5 · 100 coins + a small bonus on first completion today
A lurking variable can drive both.
Correlation is not causation 因果关系
- A strong correlation does not prove one thing causes the other.
- A third factor, or coincidence, may explain it — always think about why.
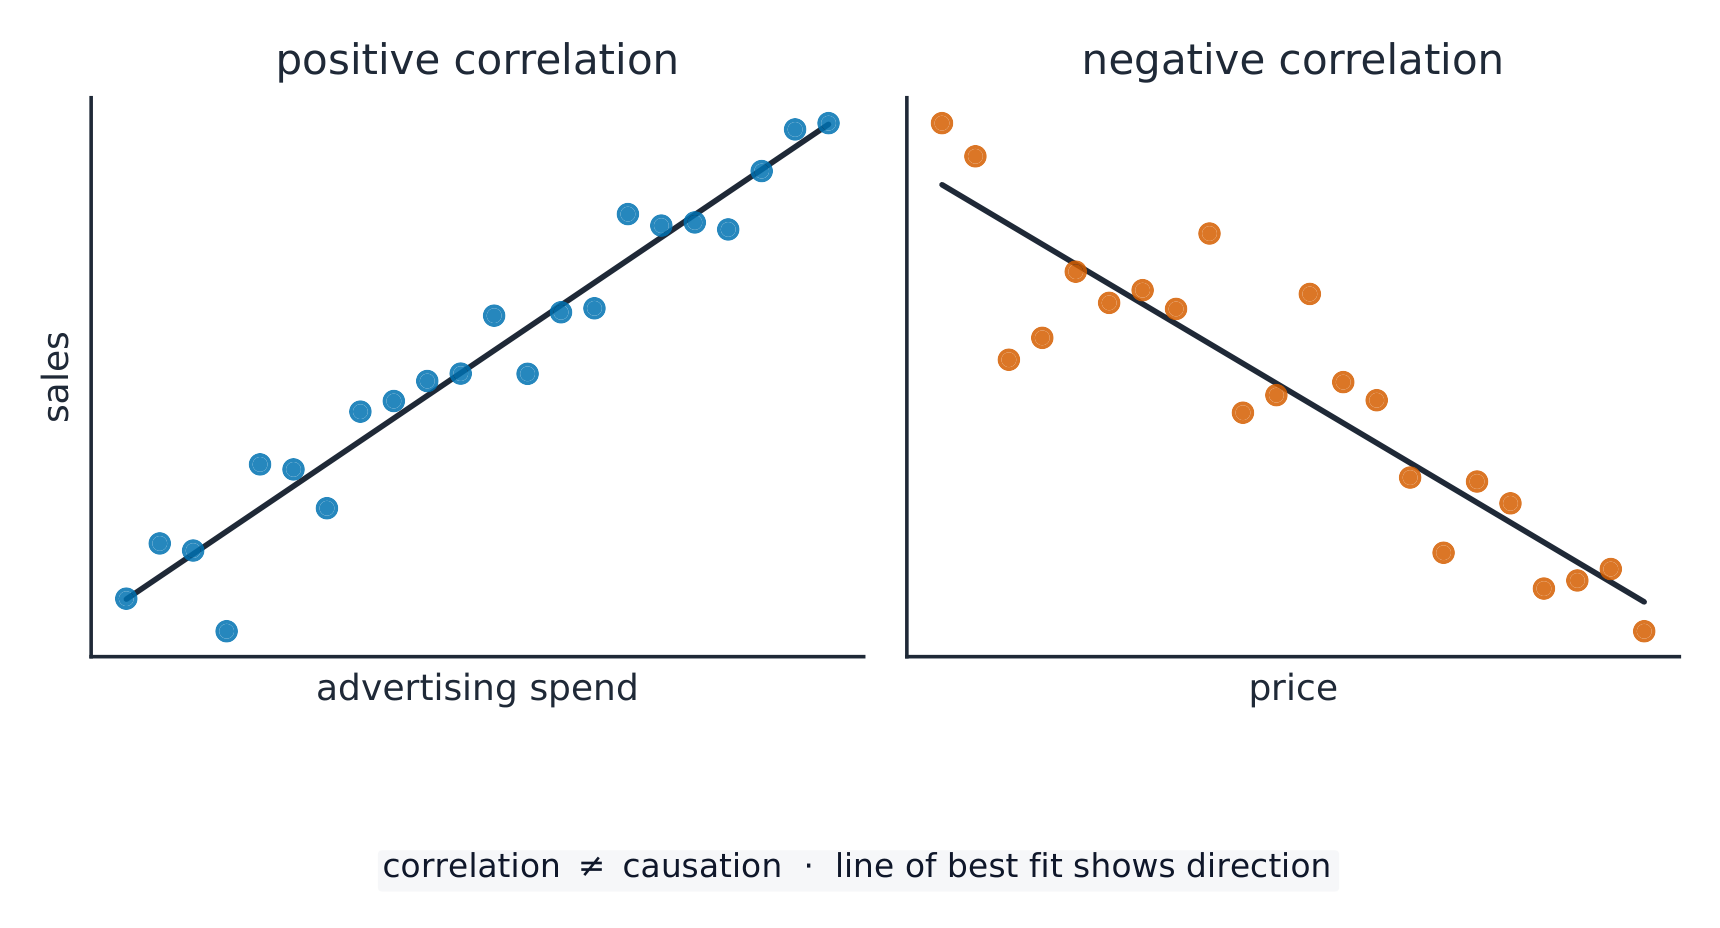
Positive and negative correlation between two variables
Income elasticity of demand measures how demand responds to a change in:
Difficulty 1/5 · 100 coins + a small bonus on first completion today
Income elasticity relates demand to income.
Other elasticities
- Income elasticity 收入弹性: how demand responds to a change in income.
- Promotional 促销 (advertising) elasticity: how demand responds to a change in promotion spend.
Correlation ≠ causation. Ice-cream sales and drownings both rise in summer, but ice cream doesn't cause drowning — hot weather drives both. Never assume a relationship is causal without good reason.

Elastic demand is flat; inelastic demand is steep
Worked examples
1. Formula: $\text{YED} = \dfrac{\%\text{ change in quantity demanded}}{\%\text{ change in income}}$. Incomes rise 4% and restaurant meals sold rise 8%: $\text{YED} = 8/4 = +2$. Positive and above 1, so this is a normal, income-elastic (luxury) good.
2. Incomes rise 5% and bus journeys fall 2%: $\text{YED} = -2/5 = -0.4$. Negative, so buses are an inferior good: as people get richer, some switch to cars.
Advertising spend rises by 10 percent and sales rise by 5 percent. What is the promotional elasticity, and does a positive scatter prove that the adverts caused the sales?
5 divided by 10 is 0.5.
What is the promotional elasticity?
Difficulty 1/5 · 100 coins + a small bonus on first completion today
The sales response divided by the advertising change is 0.5. Other options — 2 (the advertising change divided by the sales change); A proven cause (because the scatter slopes upward).
You've got it
- a scatter graph shows positive, negative or no correlation
- correlation does not prove causation — a third factor may be at work
- income and promotional elasticity measure demand's response to income and advertising
Write from a promotional elasticity of 0.5
- Advertising spend rises by 10 percent and sales rise by 5 percent.
- Find the promotional elasticity, and say what a scatter of the two series cannot prove.