- use quantitative marketing analysis: sales forecasting, time-series analysis (moving averages, trend, seasonal variation), correlation
- explain elasticity (price, income, cross) and its use in marketing decisions
Marketing (A Level)
A-Level Business · Topic 8
 8:06
8:06
Marketing (A Level)
Every shop is running on numbers. How much to order. What price to charge. Which new product to try. Get those wrong, and food goes in the bin, or the shelves…
English narration · English + 中文 subtitles burned in
8.1
Marketing analysis

Syllabus
Source: Cambridge International syllabus
Marketing analysis 营销分析 means using data to understand the market and to make better marketing decisions. At A Level you study some numbers tools: sales forecasting, time-series analysis, correlation, and elasticity.
Vocabulary
Train
| English |
|---|
| marketing analysis/ˈmɑːkɪtɪŋ əˈnæləsɪs/ |
8.1
Sales forecasting and time-series analysis

Sales forecasting 销售预测 is predicting future sales from past data and market knowledge. Good forecasts help a firm plan production, staff, stock and cash.
Time-series analysis 时间序列分析 studies past sales recorded over time to find a pattern. It has two main parts:
- the trend 趋势 — the general direction of sales over the long run (up, down or flat).
- the seasonal variation 季节性波动 — the regular rise and fall within a year (e.g. ice cream sells more in summer).
To find the trend, firms use a moving average 移动平均, which smooths the ups and downs by averaging several periods in a row. The seasonal variation is then how far the actual figure sits above or below the trend:
$$\text{seasonal variation} = \text{actual value} - \text{trend value}$$
A forecast extends the trend into the future (called extrapolation 外推) and then adds the usual seasonal variation. This works only if past patterns continue, so forecasts are never certain.
Explore
Sales forecast lab
sales = trend + seasonal effect
Move along a sales trend and see how forecast and actual can separate.
Vocabulary
Train
| English |
|---|
| sales forecasting/seɪlz ˈfɔːkæstɪŋ/ |
| time-series analysis/taɪm ˈsɪəriːz əˈnæləsɪs/ |
| trend/trɛnd/ |
| seasonal variation/ˈsiːzənl ˌveərɪˈeɪʃn/ |
| moving average/ˈmuːvɪŋ ˈævrɪdʒ/ |
| extrapolation/ekˈstræpəleɪʃn/ |
8.1
Correlation
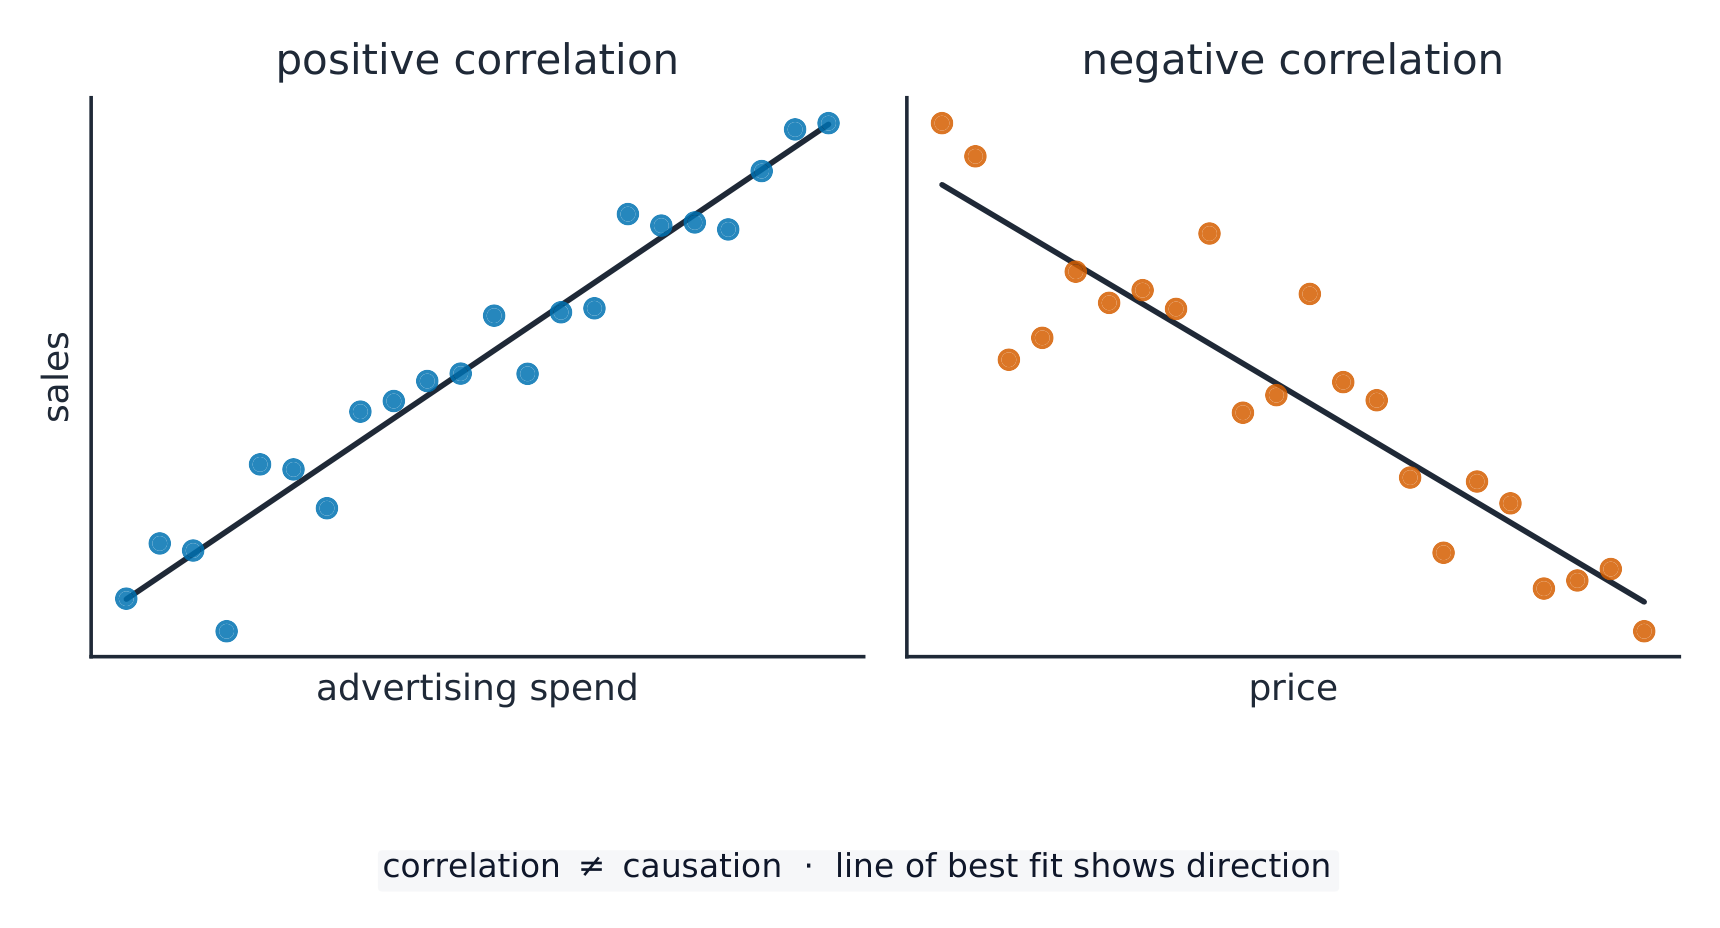
Correlation 相关性 measures how strongly two things move together — for example, advertising spending and sales.
- positive correlation 正相关 — when one rises, the other rises too.
- negative correlation 负相关 — when one rises, the other falls.
Strong correlation helps a firm predict, but it does not prove that one thing causes the other. Other factors may be at work.
Explore
Correlation and the line of best fit
Change the strength of the relationship. A line of best fit lets a business spot a trend and forecast from it.
Vocabulary
Train
| English |
|---|
| correlation/ˌkɒrɪˈleɪʃn/ |
| positive correlation/ˈpɒzɪtɪv ˌkɒrɪˈleɪʃn/ |
| negative correlation/ˈneɡətɪv ˌkɒrɪˈleɪʃn/ |
8.1
Using elasticity in marketing decisions

Elasticity 弹性 measures how much demand reacts to a change. Three types guide marketing decisions.
- price elasticity of demand 需求价格弹性 (PED) — for a price elastic 富有弹性 product, cutting the price raises total revenue; for a price inelastic 缺乏弹性 product, raising the price raises total revenue.
- income elasticity of demand 需求收入弹性 (YED) — tells a firm how sales will change as incomes rise or fall, which helps plan for booms and recessions.
- cross elasticity of demand 需求交叉弹性 (XED) — tells a firm how a rival's price change, or the price of a partner product, will affect its own sales.
So elasticity helps a firm set prices, choose products, and predict the effect of a competitor's move.
Worked example. Quarterly sales run Q1 100, Q2 140, Q3 180, Q4 120, then next Q1 108. Find the four-quarter moving-average trend centred on Q3, and the seasonal variation for Q3. Average the first four quarters: $(100 + 140 + 180 + 120) \div 4 = 135$. Average the next four: $(140 + 180 + 120 + 108) \div 4 = 137$. A four-period average falls between quarters, so centre the two: $(135 + 137) \div 2 = 136$, the trend at Q3. The seasonal variation is actual minus trend: $180 - 136 =$ +44, so Q3 runs about 44 units above trend, and next year's Q3 forecast is the projected trend plus 44. The centring step is the one most answers drop: with an even number of periods the average lands between two quarters and must be centred before it can be compared with an actual figure.
Vocabulary
Train
| English |
|---|
| elasticity/ɪlæˈstɪsɪti/ |
| price elasticity of demand/praɪs ɪlæˈstɪsɪti ɒv dɪˈmænd/ |
| price elastic/praɪs ɪˈlæstɪk/ |
| price inelastic/praɪs ɪnɪˈlæstɪk/ |
| income elasticity of demand/ˈɪŋkʌm ɪlæˈstɪsɪti ɒv dɪˈmænd/ |
| cross elasticity of demand/krɒs ɪlæˈstɪsɪti ɒv dɪˈmænd/ |
8.2
Marketing planning and strategy

Syllabus
- explain marketing planning and marketing strategy (Ansoff's matrix, product portfolio analysis)
- explain how marketing strategy is adapted for entering international markets
Source: Cambridge International syllabus
A marketing strategy 营销战略 is the long-term plan for how marketing will meet the firm's objectives. Marketing planning 营销规划 is the work of setting that plan: studying the market, choosing target customers, and deciding the marketing mix. Two tools shape strategy: Ansoff's matrix and product portfolio analysis.
Explore
Ansoff strategy lab
Sort growth choices by product and market risk.
Vocabulary
Train
| English |
|---|
| marketing strategy/ˈmɑːkɪtɪŋ ˈstrætədʒi/ |
| marketing planning/ˈmɑːkɪtɪŋ ˈplænɪŋ/ |
8.2
Ansoff's matrix

Ansoff's matrix 安索夫矩阵 shows four ways to grow, by mixing existing or new products with existing or new markets. The risk rises as you move away from what you know.
| Existing products | New products | |
|---|---|---|
| Existing markets | market penetration 市场渗透 (sell more to current buyers) | product development 产品开发 (new products for current buyers) |
| New markets | market development 市场开发 (current products to new buyers) | diversification 多元化 (new products and new markets) |
Market penetration is the safest; diversification is the riskiest because both the product and the market are new.
Vocabulary
Train
| English |
|---|
| Ansoff's matrix/ˈænsɒfs ˈmeɪtrɪks/ |
| market penetration/ˈmɑːkɪt ˌpenɪˈtreɪʃn/ |
| product development/ˈprɒdʌkt dɪˈveləpmənt/ |
| market development/ˈmɑːkɪt dɪˈveləpmənt/ |
| diversification/daɪˌvɜːsɪfɪˈkeɪʃn/ |
8.2
Product portfolio analysis
Product portfolio analysis 产品组合分析 looks at the firm's whole range of products together, using a tool like the Boston Matrix. It checks the balance: a firm needs some steady earners to fund its risky new products. The aim is a healthy mix, so the firm is not left with only ageing products.
Explore
Balance the product portfolio
Drag each product's share and growth — a healthy portfolio keeps a cash cow funding the stars and question marks that will replace it.
Vocabulary
Train
| English |
|---|
| product portfolio analysis/ˈprɒdʌkt pɔːtˈfəʊlɪəʊ əˈnæləsɪs/ |
8.2
Entering international markets

To grow, many firms sell abroad. Globalisation 全球化 (the world becoming more connected) has made this easier. A firm can enter a new country by exporting 出口, by setting up a joint venture 合资企业 with a local partner, or by opening its own branch there.
But a strategy that works at home may need changes. Localisation 本地化 means adapting the marketing mix to the new market — for example, changing the product, the language, the price, or the way it is sold to suit local tastes, laws and incomes.
Explore
International market lab
See how access to world markets changes quantity and price pressure.
Vocabulary
Train
| English |
|---|
| globalisation/ˌɡləʊbəlaɪˈzeɪʃn/ |
| exporting/ekˈspɔːtɪŋ/ |
| joint venture/dʒɔɪnt ˈventʃə/ |
| localisation/ˌləʊkəlaɪˈzeɪʃn/ |
8.2
Exam tips
- Read time-series data: separate the underlying trend from seasonal variation, and extrapolate with caution.
- Interpret correlation (strength and direction) but never assume it proves causation.
- Use Ansoff's matrix to classify a growth strategy and judge its risk (diversification is riskiest).
- Use elasticity values to justify a pricing or promotion decision numerically.
Interactive lessons on this topic
Work through it step by step, with instant-check exercises.