| English | 의미 |
|---|---|
| correlation/ˌkɒrɪˈleɪʃn/ | 상관관계 |
| scatter graph/ˈskætə ɡræf/ | 산점도 |
| positive/ˈpɒzɪtɪv/ | 양(正)의 상관관계 |
| negative/ˈneɡətɪv/ | 음(陰)의 상관관계 |
| causation/kɔːˈseɪʃn/ | 인과관계 |
| income elasticity/ˈɪŋkʌm ɪlæˈstɪsɪti/ | 소득 탄력성 |
| promotional/prəˈməʊʃənl/ | 마케팅促销 |
Does spending more actually sell more?
- A firm doubles its advertising — do sales follow? To answer, it looks for a relationship between the two.
- Correlation 相关性 measures how strongly two variables move together.
If sales rise as advertising rises, the two show:
난이도 1/5 · 100 코인 + 오늘 첫 완료 시 소액 보너스
Both moving up together is positive correlation.
A graph that plots paired data points to show a relationship is a ______ graph.
난이도 1/5 · 100 코인 + 오늘 첫 완료 시 소액 보너스
A line of best fit summarises the correlation.
Scatter graphs 散点图 and correlation
- A scatter graph plots paired data (e.g. advertising vs sales).
- Positive 正相关 correlation: both rise together. Negative 负相关: one rises as the other falls. None: no pattern.
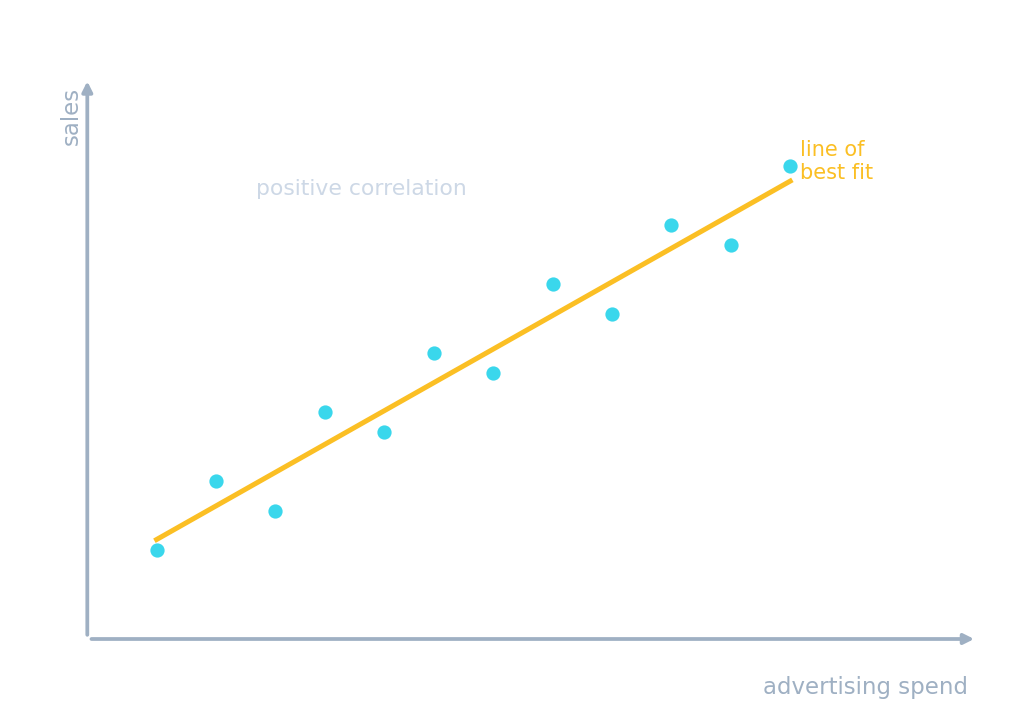
A line of best fit summarises the relationship — here, positive correlation.
Correlation
r measures the link
Correlation r shows how closely two variables move together — but it isn't causation.
A strong correlation between two variables:
난이도 1/5 · 100 코인 + 오늘 첫 완료 시 소액 보너스
Correlation is not causation — a third factor may explain it.
Two variables can be strongly correlated because of a third, hidden factor.
난이도 1/5 · 100 코인 + 오늘 첫 완료 시 소액 보너스
A lurking variable can drive both.
Correlation is not causation 因果关系
- A strong correlation does not prove one thing causes the other.
- A third factor, or coincidence, may explain it — always think about why.
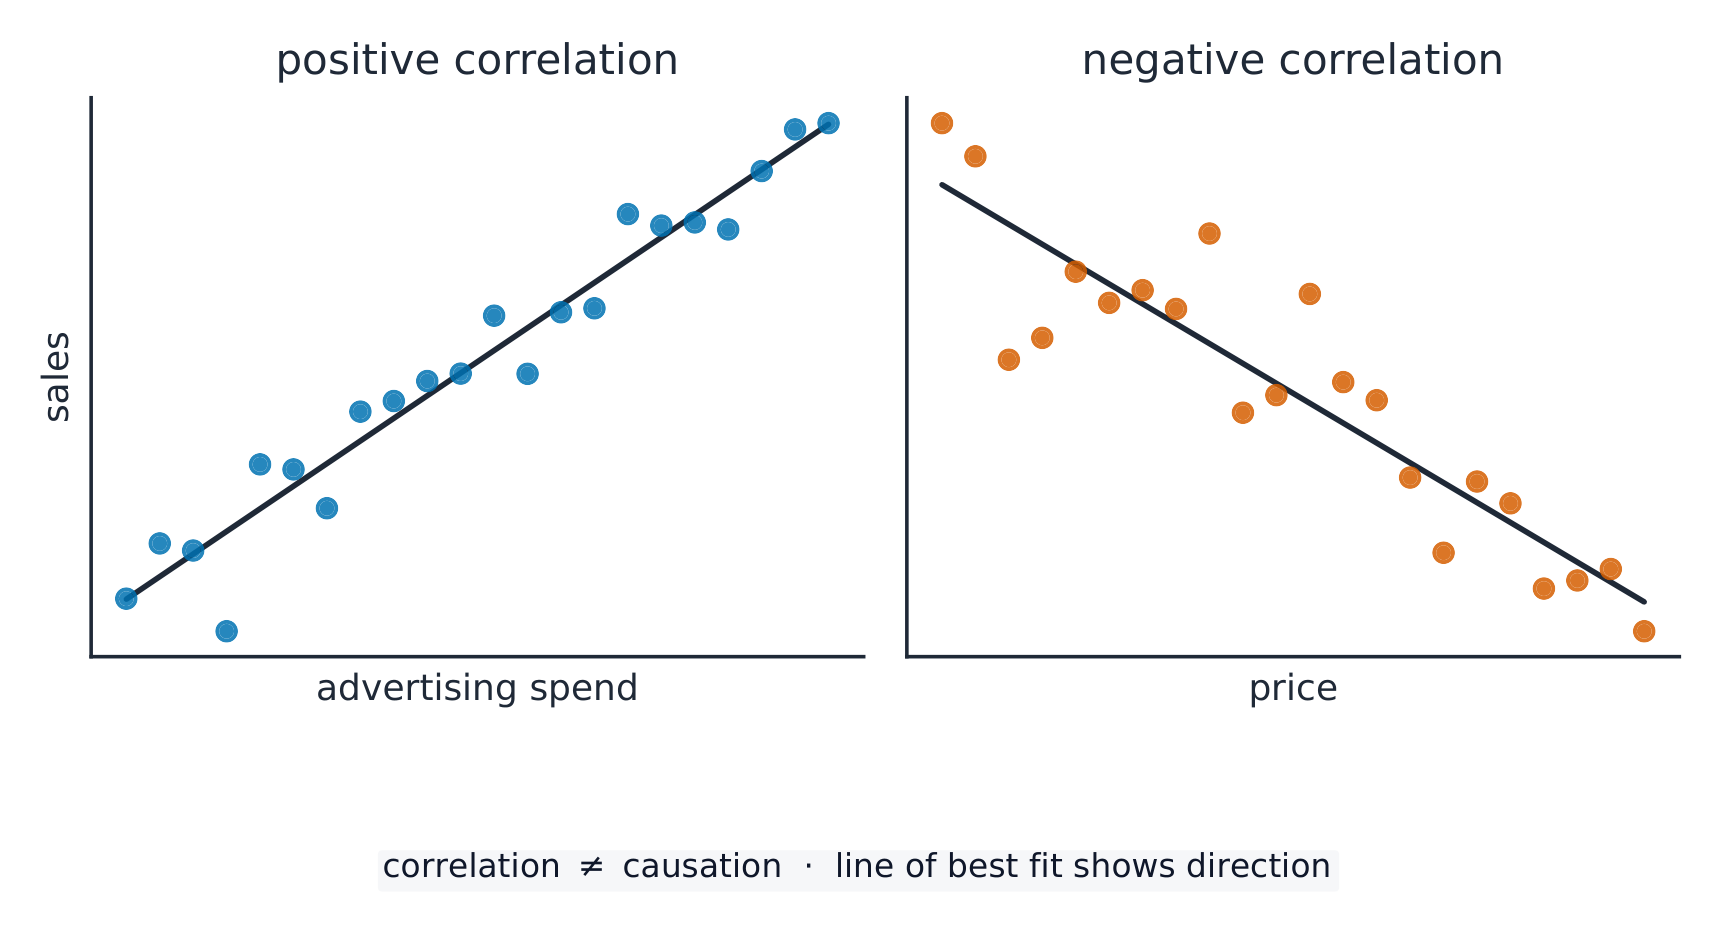
Positive and negative correlation between two variables
Income elasticity of demand measures how demand responds to a change in:
난이도 1/5 · 100 코인 + 오늘 첫 완료 시 소액 보너스
Income elasticity relates demand to income.
Other elasticities
- Income elasticity 收入弹性: how demand responds to a change in income.
- Promotional 促销 (advertising) elasticity: how demand responds to a change in promotion spend.
Correlation ≠ causation. Ice-cream sales and drownings both rise in summer, but ice cream doesn't cause drowning — hot weather drives both. Never assume a relationship is causal without good reason.

Elastic demand is flat; inelastic demand is steep
You've got it
- a scatter graph shows positive, negative or no correlation
- correlation does not prove causation — a third factor may be at work
- income and promotional elasticity measure demand's response to income and advertising