| English | 意味 |
|---|---|
| tally table/ˈtælɪ ˈteɪbl/ | 計数表 |
| two-way table/tuː weɪ ˈteɪbl/ | 二重表 |
| correlation/ˌkɒrɪˈleɪʃn/ | 相関 |
| causation/kɔːˈseɪʃn/ | 因果関係 |
| qualitative/ˈkwɒlɪteɪtɪv/ | 定性的 |
| quantitative/ˈkwɒntɪteɪtɪv/ | 定量的 |
| discrete/dɪˈskriːt/ | 離散的 |
| continuous/kənˈtɪnjuːəs/ | 連続的 |
"Statistics" — the word that means both data and lies
- "There are three kinds of lies: lies, damned lies, and statistics." — often attributed to Mark Twain.
- Good statistics tells the truth about data. Bad statistics misleads. The skill is telling them apart.
データ処理サイクル
統計的質問から収集まで表示に至る一連の手順に従う。
Tally tables 计数表 and two-way tables 双向表
- A tally table records each value with a mark ($\mid$), grouping them in fives for easy counting.
- A two-way table sorts data by two features at once (e.g. boys/girls against walk/bus/car).
A two-way table of 60 students by gender and transport might show: 15 boys walk, 10 boys take the bus; 12 girls walk, 23 girls take the bus. Each cell is a count.

Data is collected from people, a sample drawn from a population
2方向表は、一度にいくつの特徴によってデータを分類するか?
難易度 1/5 · 100 コイン + 今日初回完了時に小ボーナス付与
2方向表は2つの特徴を交差比較する(例:性別対交通手段)。
各値に対してチェックを入れ、その後数える表は ______ 表である。
難易度 1/5 · 100 コイン + 今日初回完了時に小ボーナス付与
tally表は、数える前に各値に対してチェックを入れる。
Reading data honestly
- Only draw conclusions the data actually supports.
- Don't assume a trend that isn't shown, or causes that aren't proven.
- Correlation 相关性 is not causation 因果: two things can rise together without one causing the other.
Check the axes. A graph with a truncated $y$-axis can make small differences look huge. Always check the scale before drawing conclusions.

A Galton board shows how data piles up into a distribution
データが実際に支持する結論のみを下すべきである。
難易度 1/5 · 100 コイン + 今日初回完了時に小ボーナス付与
データを超える過度な主張は、避けるべき一般的な試験の誤りである。
2つの量がともに増加する場合、一方が他方を引き起こす必要があるわけではない。
難易度 1/5 · 100 コイン + 今日初回完了時に小ボーナス付与
相関は因果関係を示すものではありません。両方とも第三の要因によって影響を受けている可能性があります。
Types of data
- Qualitative 定性 (categorical): colours, opinions, brands.
- Quantitative 定量 (numerical): height, age, score.
- Quantitative data is discrete 离散的 (counted: number of siblings) or continuous 连续的 (measured: height, time).
ある学生の兄弟姉妹の数はどのような種類のデータか?
難易度 1/5 · 100 コイン + 今日初回完了時に小ボーナス付与
兄弟姉妹の数は数えるものであり(測るものではない)、離散型定量データである。
身長は ______ 定量データの一例である。
難易度 1/5 · 100 コイン + 今日初回完了時に小ボーナス付与
身長は測るものであり(数えるものではない)、連続型である。
Why data matters
- Governments use census data to plan schools and hospitals. Companies use sales data to decide what to stock. Medical researchers use trial data to approve new drugs.
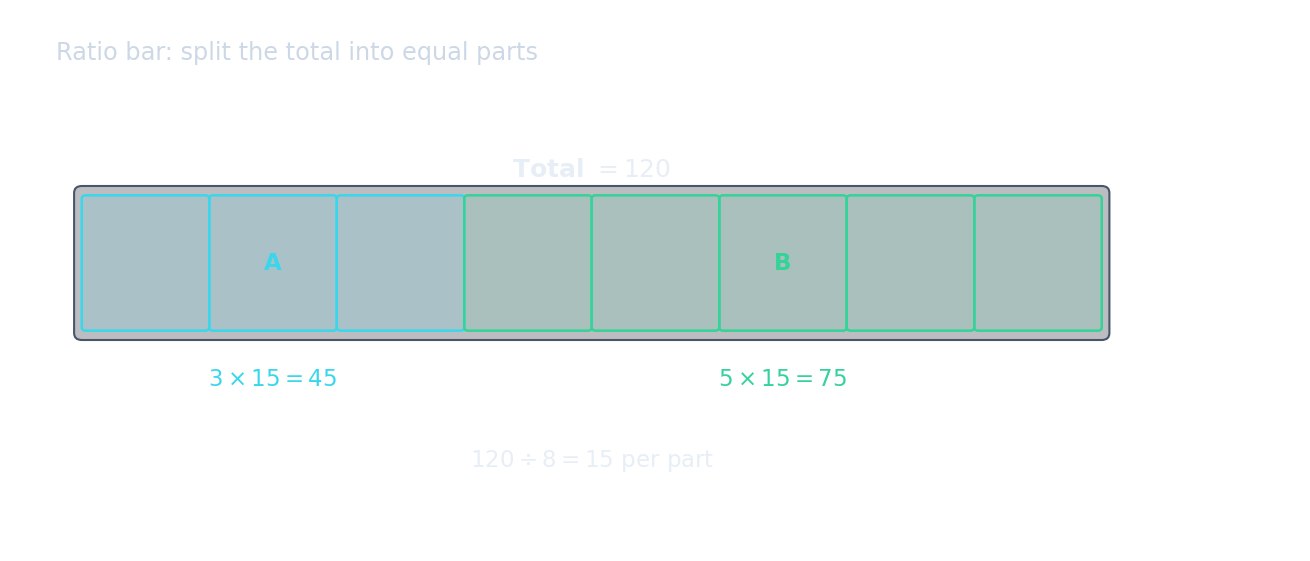
Two-way tables split data into parts, just like a bar model splits a total into proportional sections.
Complete and interpret a two-way table
- In a survey, junior bus 6, junior walk 4, senior bus 3 and senior walk 7 give row totals 10,10; column totals 9,11; grand total 20. Check totals in both directions.
- To compare two samples, use both an average and a spread. Scores A: $4,6,8$ and B: $5,6,7$ have equal means 6 but ranges 4 and 2. B is more consistent in this sample; three scores per group cannot establish a general population claim.
アンケート結果は、中学生バス通学 6、中学生徒歩通学 4、高校生バス通学 3、高校生徒歩通学 7 である。徒歩通学の総数を求めよ。
難易度 2/5 · 140 コイン + 今日初回完了時に小ボーナス付与
walk列を追加する:4 + 7 = 11。
You've got it
- a tally table counts values with marks; a two-way table sorts by two features at once
- only conclude what the data actually shows — correlation $\neq$ causation
- data types: qualitative (categories) or quantitative (numbers: discrete or continuous)