Mesure, conception de recherche et inférence statistique
Introduit| English | Sens |
|---|---|
| reliability/rɪˌlaɪəˈbɪlɪti/ | fiabilité |
| validity/væˈlɪdɪti/ | validité |
| random assignment/ˈrændəm əˈsaɪnmənt/ | affectation aléatoire |
Consistency is only one question
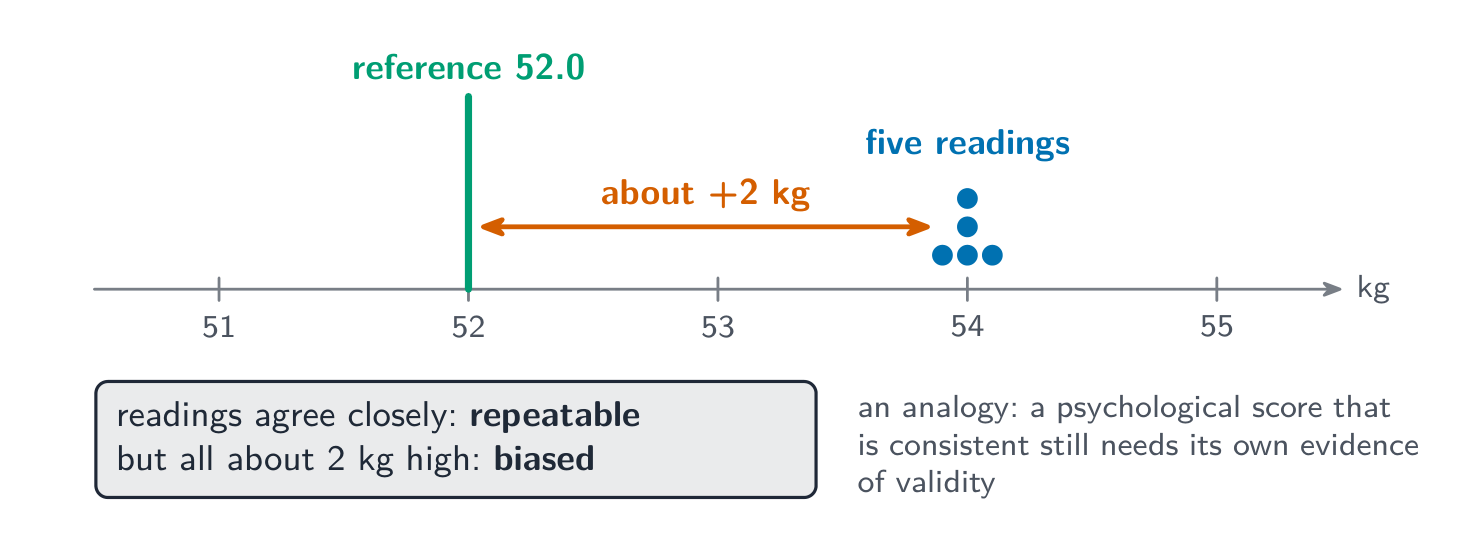
- A fictional scale gives nearly identical readings when the same object is weighed repeatedly. Every reading is about 2 kg above a suitable reference measurement. Its repeatability can be high while its readings are biased for the intended weight measurement.
- Reliability 信度 concerns consistency or precision under specified repeated measurements. Validity 效度 concerns evidence for a proposed interpretation and use. Neither word alone settles whether a study's design, analysis or decision is justified.
Match evidence to the proposed interpretation
- Test–retest, inter-rater, parallel-form and internal-consistency evidence concern different sources of score variation. State what changes between measurements. A large Cronbach's alpha alone does not establish one dimension or the intended meaning of a score.
- Content coverage, relationships with relevant criteria, and convergent or discriminant patterns can support an interpretation. Precision must be adequate for the proposed use, but reliability alone cannot establish validity or fairness. An analogy about scales is not a complete model of psychological measurement.
De quoi ce témoignage fait-il l'objet ?
Sépare les preuves de cohérence des preuves d'interprétation.
A high internal-consistency coefficient alone establishes that a score has the intended meaning for every use.
Difficulté 1/5 · 100 pièces + un petit bonus lors de la première réussite aujourd'hui
Internal consistency concerns a source of score variation. Interpretation, dimensionality, population and use need additional relevant evidence.
Define the measure and the population
- An operational definition states how a construct is measured or manipulated. “Stress” might be a questionnaire score or a specified task condition; these are related research choices, not interchangeable definitions of every aspect of stress.
- Probability sampling selects people from a defined population. It can support population estimates with an appropriate analysis, but coverage, non-response and setting still limit generalisation. Sampling people and assigning them to conditions answer different questions.
Worked distinction. Researchers recruit volunteers from one school, then allocate them randomly to two study routines. Allocation can strengthen the comparison within those volunteers. It does not turn the volunteers into a random sample of all students.
One school’s volunteers are randomly assigned to two routines. Which statement is justified?
Difficulté 1/5 · 100 pièces + un petit bonus lors de la première réussite aujourd'hui
Random allocation and population sampling are separate processes. Neither perfect balance nor universal generalisation follows.
Random allocation supports a comparison
- Random assignment 随机分配 allocates units to conditions by chance. Proper implementation prevents systematic selection into groups through that allocation process; chance baseline differences can remain. It does not guarantee identical starting groups or remove every later bias.
- Describe who is masked to the allocation rather than relying only on “double-blind”. Masking can reduce expectancy or assessment effects where feasible. Missing outcomes, unequal additional help, non-adherence and unsuitable measurement can still weaken a causal interpretation.
Worked design check. Two randomised groups differ slightly in prior scores. That alone does not prove that randomisation failed. Check how allocation was generated and concealed, describe the starting values, and examine later departures from the planned comparison.
Which design feature most directly strengthens a comparison between conditions by preventing systematic selection through allocation?
Difficulté 1/5 · 100 pièces + un petit bonus lors de la première réussite aujourd'hui
Proper random assignment removes systematic selection through the allocation process and supports causal comparisons with other design assumptions. Chance baseline differences and later biases can remain. Random sampling concerns population selection.
Any numerical baseline difference proves that a properly implemented random allocation failed.
Difficulté 1/5 · 100 pièces + un petit bonus lors de la première réussite aujourd'hui
Chance differences can occur. Examine allocation implementation and report the relevant starting information rather than assuming exact equality.
Protect participants and the evidence
- Research ethics includes voluntary informed consent, appropriate protection of privacy, proportionate risk assessment and review under the applicable rules. A participant must be able to decline or withdraw without improper pressure; a large sample does not excuse harmful procedures.
- Deception is not justified merely because it produces an interesting result. Where permitted, it needs the relevant ethical justification and safeguards, followed by appropriate debriefing. Ethical review and scientific design are related responsibilities; approval alone does not prove that a causal claim is correct.
A study’s scientific interest alone justifies deceiving participants.
Difficulté 1/5 · 100 pièces + un petit bonus lors de la première réussite aujourd'hui
Applicable ethics requirements, justification, safeguards and appropriate debriefing matter; scientific interest alone is insufficient.
Choose summaries for the question
- The median is less sensitive to extreme values than the mean, but skewness does not automatically make the mean useless. Choose according to the quantity of interest, inspect the distribution and report useful spread. An average total cost and a typical person's cost can call for different summaries.
- For a normal distribution, about 68%, 95% and 99.7% lie within one, two and three SDs of the mean. A z score, $z=(X-M)/S$, only expresses distance in SD units; normal-curve percentages need the distribution assumption.
Worked summaries. For five fictional waiting times of 2, 3, 4, 5 and 26 minutes, the median is 4 minutes and the mean is $(2+3+4+5+26)/5=8$ minutes. The median describes the middle wait; the mean also reflects the long wait and links the total 40 minutes to the five observations. Neither summary tells the whole distribution.
IQ has mean 100 and SD 15. What is the z-score of 130?
Difficulté 2/5 · 140 pièces + un petit bonus lors de la première réussite aujourd'hui
z = (130 − 100)/15 = 2. The score is two SDs above the reference mean. No normality assumption is needed for this conversion alone.
Correlation describes linear association
- Pearson's $r$ ranges from $-1$ to $1$ when defined and describes linear association. Inspect the plot for curvature, unusual observations and restricted ranges. Zero correlation can coexist with a strong nonlinear relationship.
- In simple least-squares regression of an outcome on one predictor with an intercept, $R^2=r^2$ is the fraction of the sample's centred outcome sum of squares accounted for by that fitted line. If $r=0.6$, it is $0.36$, or 36%. “Accounted for” here is statistical, not causal.

These constructed points follow $y=x^2$. The fitted straight line is flat; it misses the curve even though the nonlinear rule is exact.
In a simple least-squares regression with an intercept and one predictor, Pearson correlation is $r=0.6$. What percentage of the sample outcome sum of squares is accounted for by the fitted line?
Difficulté 2/5 · 140 pièces + un petit bonus lors de la première réussite aujourd'hui
Under the stated model, R² = r² = 0.6² = 0.36, or 36%. This describes the linear fit to these data; it does not establish causal explanation or guaranteed prediction in a new population.
For the five constructed points $x=-2,-1,0,1,2$ et $y=x^2$, Pearson correlation is zero. What follows?
Difficulté 1/5 · 100 pièces + un petit bonus lors de la première réussite aujourd'hui
Symmetry gives zero centred cross-product here, but the U-shaped rule is exact. Pearson correlation describes linear association.
Read a p-value under its model
- A p-value is the probability, under the specified null model and its assumptions, of a test statistic at least as extreme as the observed one. The statistic and the choice of one or two tails matter. It is not the probability that the null is true, nor the probability of the exact observed data.
- A small p-value can indicate incompatibility with that model, but does not identify which assumption failed or establish the size or importance of an effect. Report design, analysis choices and all relevant results; selecting only a favourable analysis changes what the reported evidence means.
Worked interpretation. With a prespecified test and its assumptions satisfied, $p=0.03$ means the model assigns 3% probability to the defined set of equally or more extreme statistics. It does not assign a 97% probability to the researcher's explanation.
$p = 0.03$ means there is a 3% chance the null hypothesis is true.
Difficulté 1/5 · 100 pièces + un petit bonus lors de la première réussite aujourd'hui
The p-value concerns equally or more extreme test statistics under a specified null model and assumptions. It does not give a posterior probability that the null hypothesis is true.
Errors and power describe repeated decisions
- A Type I error rejects a true null. A calibrated level-$\alpha$ procedure controls that rejection probability at or below $\alpha$ under its null assumptions. A Type II error fails to reject when a specified alternative holds; failure to reject is not proof that the null is true.
- Power is $1-\beta$, the rejection probability for a specified alternative under a specified design and test. It depends on effect size, sample size, variability and the decision rule. Power of 80% is not an 80% probability that the next significant result is correct.
Worked distinction. A design has power 0.80 for a stated mean difference. Under that alternative and the stated assumptions, its Type II error probability is $1-0.80=0.20$. This does not give the probability of error after seeing one particular p-value.
Quelle inférence est justifiée ?
Distinguer les preuves conditionnelles, les erreurs de décision et les affirmations probabilistes non fondées.
A Type I error is
Difficulté 1/5 · 100 pièces + un petit bonus lors de la première réussite aujourd'hui
A Type I error is a false positive: rejecting a null hypothesis that is actually true. Missing a real effect is a Type II error.
Under a specified alternative and design, Type II error probability is 0.15. What is power as a proportion?
Difficulté 2/5 · 140 pièces + un petit bonus lors de la première réussite aujourd'hui
Power = 1 − β = 1 − 0.15 = 0.85 for that stated alternative and procedure.
Effect size and importance need context
- Report an effect estimate and relevant uncertainty, not just whether a threshold was crossed. For one common two-group standardised difference, Cohen's $d$ divides a mean difference by a specified pooled SD. Other designs use other definitions; name the scale and convention.
- Statistical significance alone does not establish practical importance. A small precise effect can cross a threshold; a substantial but imprecisely estimated effect may not. Repeated studies, design quality and consequences matter alongside the estimate.
Worked calculation. Two independent groups have means 18 and 15 with a pooled SD of 6. Under this stated convention, $d=(18-15)/6=0.5$. The standardised difference does not tell us whether three original-scale points matter in this setting.
Using the stated two-group convention, the means are 24 and 20 and the pooled SD is 8. What is the standardised difference $d$, first group minus second?
Difficulté 2/5 · 140 pièces + un petit bonus lors de la première réussite aujourd'hui
d = (24 − 20)/8 = 0.5. Interpret the original four-point difference in context and report uncertainty.
A randomised study reports $p=0.02$ and a mean difference of one point. It concludes that randomisation made the groups identical and that the effect must be important. Identify two unsupported claims and name useful further evidence.
L'allocation aléatoire permet des différences initiales dues au hasard et ne supprime pas les biais ultérieurs. Une valeur p n'établit pas l'importance pratique. Examinez la mise en œuvre de l'allocation, les caractéristiques initiales, les résultats manquants et l'adhésion, ainsi que l'échelle, l'estimation de l'incertitude et un contexte justifié pour une différence significative.
Recap
- Match measurement evidence to the interpretation, use and source of variation.
- Separate sampling from allocation; randomisation permits chance imbalance.
- Choose summaries for the question and inspect the data.
- Distinguish linear association, model-based inference and causal explanation.
- State the alternative for power and the scale for an effect size.
- reliability: Consistency or precision under specified repeated measurements.
- validity: Support from evidence and theory for a proposed score interpretation and use.
- random assignment: Allocating units to conditions by chance, without guaranteeing identical starting groups.
A volunteer survey finds $r=0.6$ between study hours and scores, with $p=0.01$. A report claims that an extra hour causes a 36% score increase for all students. Explain three errors in that conclusion.
L'association est observationnelle, donc des alternatives causales telles qu'une préparation préalable ou la motivation subsistent. Le carré de r explique 36 % de la variation centrée du résultat par un ajustement linéaire simple avec ordonnée à l'origine, et non une augmentation de score de 36 % ou un effet par heure. Un échantillon de volontaires n'établit pas la généralisation à tous les étudiants. La seule valeur p ne comble aucun de ces écarts ; inspectez la conception, la pente ajustée, l'incertitude et la pertinence pour la population.