Representación de datos
Introducido| English | Significado |
|---|---|
| stem-and-leaf/stem ænd liːf/ | diagrama de tallo y hoja |
| box-and-whisker/bɒks ænd ˈwɪskə/ | diagrama de caja y bigotes |
| quartile/ˈkwɔːtaɪl/ | cuartil |
| histogram/ˈhɪstəɡræm/ | histograma |
| cumulative frequency/ˈkjuːmjʊlətɪv ˈfriːkwənsi/ | frecuencia acumulada |
| median/ˈmiːdiːən/ | mediana |
| interquartile range/ˌɪntəˈkwɔːtaɪl reɪndʒ/ | rango intercuartílico |
| frequency density/ˈfriːkwənsi ˈdensɪti/ | densidad de frecuencia |
| mean/miːn/ | media |
| mode/məʊd/ | moda |
| standard deviation/ˈstændəd ˌdiːvɪˈeɪʃn/ | desviación estándar |
| variance/ˈveərɪəns/ | varianza |
| outlier/ˈaʊtlaɪə/ | valor atípico |
The diagram that changed history
- In 1854, John Snow mapped cholera deaths in London and spotted a cluster around one water pump. That diagram saved lives.
- Choosing the right statistical diagram is a skill — it reveals patterns that raw numbers hide.
Statistical diagrams
- Choose a diagram to suit the data:
- Stem-and-leaf 茎叶图 (keeps the values, shows shape),
- Box-and-whisker 箱线图 (lowest, three quartiles 四分位数, highest),
- Histogram 直方图 (grouped data — bar area = frequency),
- Cumulative frequency 累积频数 (running totals → median 中位数 and quartiles).
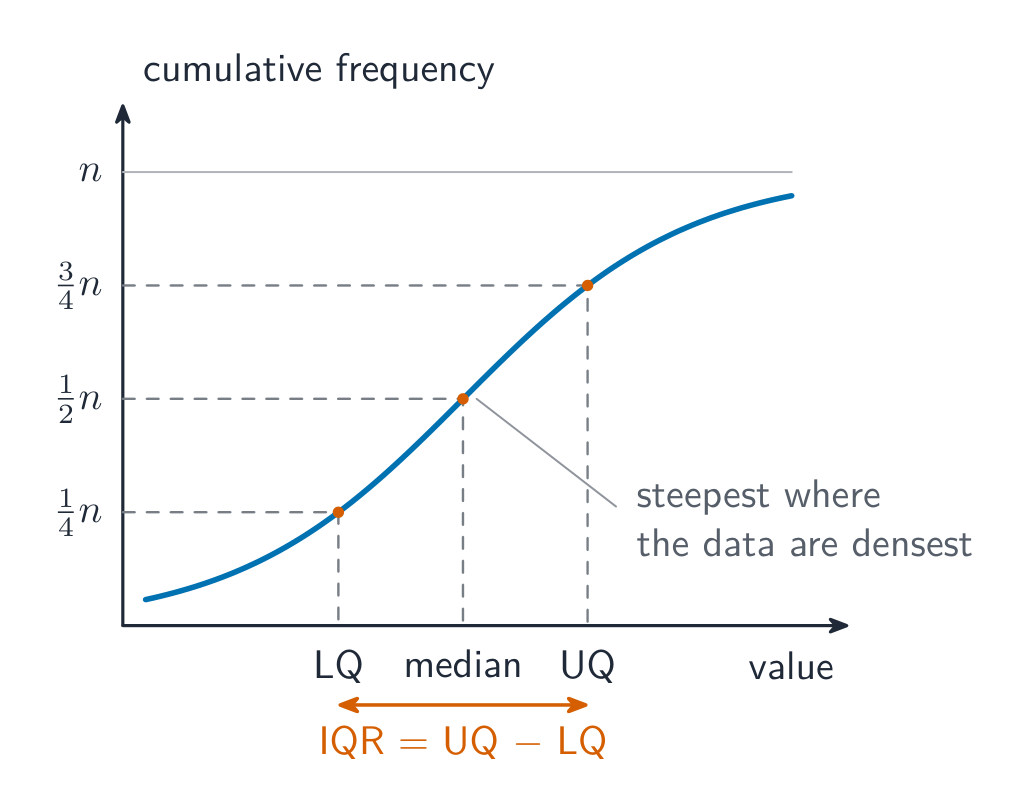
A cumulative frequency curve: read the median across from half the total, and the quartiles from a quarter and three-quarters
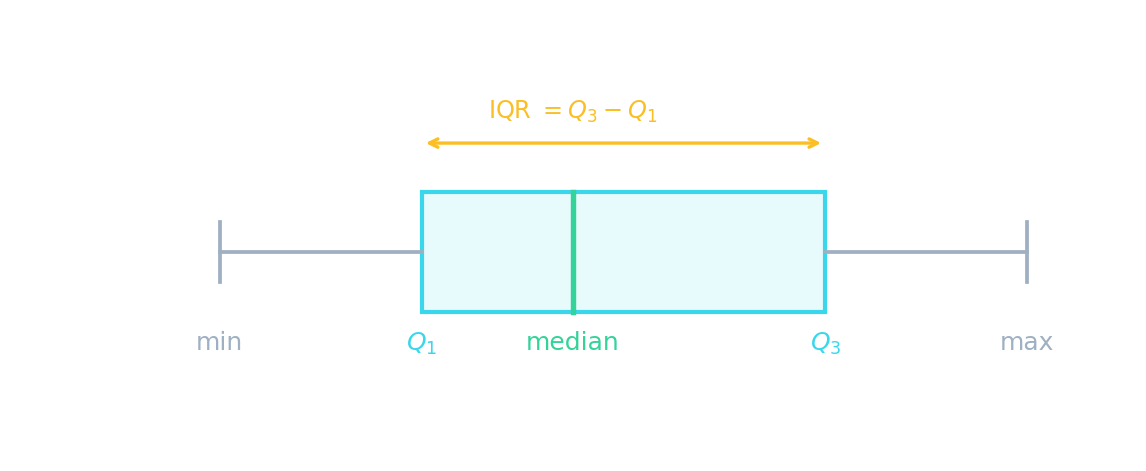
A box plot shows the five-number summary; the box spans the interquartile range 四分位距, IQR = Q₃ − Q₁.
Histogram vs bar chart. In a histogram, bars can have different widths and the area (not height) represents frequency. Frequency density 频率密度 $= \dfrac{\text{frequency}}{\text{class width}}$.
Histogram area = frequency, not height. When class widths are unequal, the vertical axis shows frequency density, not frequency. A tall narrow bar may represent fewer data points than a short wide one.
Dispersión y la campana
P(−k < Z < k)
La dispersión se mide en desviaciones estándar: aproximadamente el 68% de los datos se encuentran dentro de 1 desviación estándar, el 95% dentro de 2.
En un histograma de datos agrupados, la frecuencia está representada por:
Dificultad 1/5 · 100 monedas + un pequeño bono en el primer intento de hoy
En un histograma, el área de cada barra representa la frecuencia.
En un histograma con anchos de clase desiguales, la altura de cada barra equivale a la frecuencia.
Dificultad 1/5 · 100 monedas + un pequeño bono en el primer intento de hoy
Con anchos desiguales, la altura muestra la densidad de frecuencia (frecuencia/ancho), no la frecuencia. El área representa la frecuencia.
Empareja cada diagrama estadístico con lo que mejor muestra.
Dificultad 2/5 · 140 monedas + un pequeño bono en el primer intento de hoy
Un diagrama de caja muestra cuartiles y dispersión; un histograma usa el área de las barras para la frecuencia; la frecuencia acumulada da la mediana/cuartiles; la hoja de tallo y hoja mantiene los valores de los datos.
Averages and spread
- Central tendency: mean 平均数 $\bar{x} = \dfrac{\sum x}{n}$, median (middle), mode 众数 (most common).
- Spread: range, interquartile range, and standard deviation 标准差 $\sigma = \sqrt{\dfrac{\sum x^2}{n} - \bar{x}^2}$.
- Variance 方差 = $\sigma^2$.
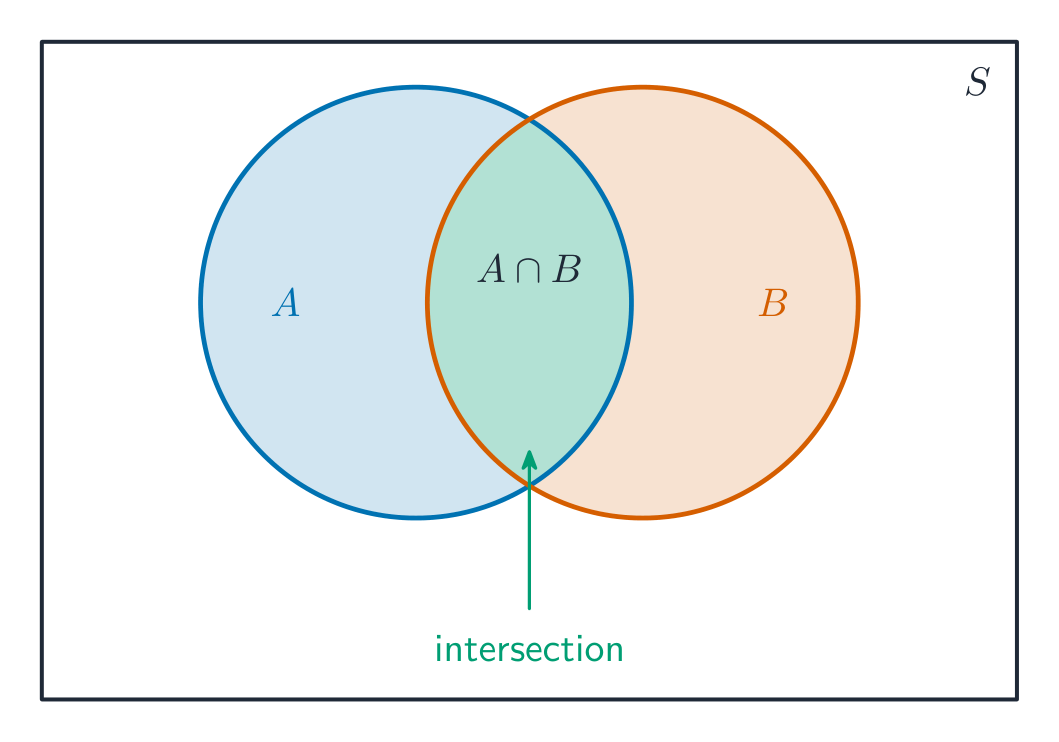
A Venn diagram: the overlap is the intersection of two events
Para 10 valores con Σx = 50, ¿cuál es la media?
Dificultad 2/5 · 140 monedas + un pequeño bono en el primer intento de hoy
Media = Σx / n = 50 / 10 = 5.
Para 10 valores, Σx = 50 y Σx² = 300. ¿Cuál es la desviación estándar? (√(Σx²/n − x̄²))
Dificultad 2/5 · 140 monedas + un pequeño bono en el primer intento de hoy
σ = √(300/10 − 5²) = √(30 − 25) = √5 ≈ 2.24.
Para los datos 2, 4, 4, 4, 5, 5, 7, 9, ¿cuál es la mediana?
Dificultad 2/5 · 140 monedas + un pequeño bono en el primer intento de hoy
Con 8 valores, la mediana es el promedio del 4º y 5º valor: (4 + 5)/2 = 4.5.
Si la desviación estándar es 3, ¿cuál es la varianza?
Dificultad 2/5 · 140 monedas + un pequeño bono en el primer intento de hoy
Varianza = σ² = 3² = 9.
Worked example — standard deviation
- Data: 2, 4, 4, 4, 5, 5, 7, 9. $n = 8$, $\sum x = 40$, $\sum x^2 = 232$.
- Mean $\bar{x} = \dfrac{40}{8} = 5$.
- Variance $= \dfrac{232}{8} - 5^2 = 29 - 25 = 4$.
- Standard deviation $\sigma = \sqrt{4} = 2$.
Choosing the right average
- Mean: uses all data, but affected by outliers 离群值.
- Median: not affected by outliers — good for skewed data (like salaries).
- Mode: useful for categorical data (most popular colour, most common shoe size).
- Display data with stem-and-leaf diagrams, box-and-whisker plots and cumulative frequency graphs, and measure its variation (spread).
You've got it
- diagrams: stem-and-leaf, box plot, histogram (area = frequency), cumulative frequency
- averages: mean, median, mode; spread: range, IQR, standard deviation
- $\sigma = \sqrt{\dfrac{\sum x^2}{n} - \bar{x}^2}$, and variance $= \sigma^2$
Write from the data: find the mean
- The values are 4, 4, 8 and 12. A class of width 4 has frequency 12.
- Find the mean, the median and the frequency density.
Para 4, 4, 8 y 12, ¿cuáles son la media y la mediana? ¿Cuál es la densidad de frecuencia de una clase de amplitud 4 con frecuencia 12?
28 dividido por 4 es 7. El promedio de los dos valores centrales es 6.
¿Cuál es la media?
Dificultad 1/5 · 100 monedas + un pequeño bono en el primer intento de hoy
28 dividido por 4 es 7. Otras opciones — 5 (la media de la lección); 3 (la densidad de frecuencia).