Skip to content

IGCSE Physics · November 2023 · Paper 62 · Difficulty 3 · Standard

Question 1

1

A student investigates the period of a pendulum.

Fig. 1.1 shows the set-up.

Fig. 1.1
(a)

The distance $d$ is measured from the bottom of the clamp to the centre of the bob.

The student adjusts the length of the pendulum until $d = 50.0\text{ cm}$.

He displaces the bob slightly and releases it so that it swings.

He uses a stop-watch to measure the time $t$ for 10 complete oscillations.

Fig. 1.2
(i)

Fig. 1.2 shows the reading on the stop-watch.

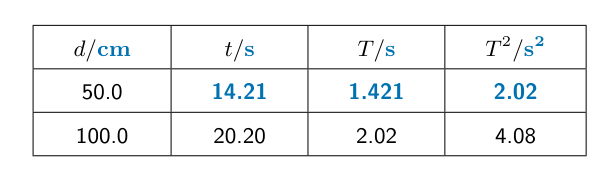
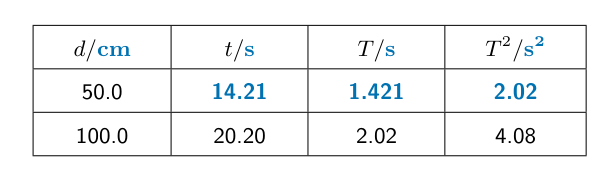
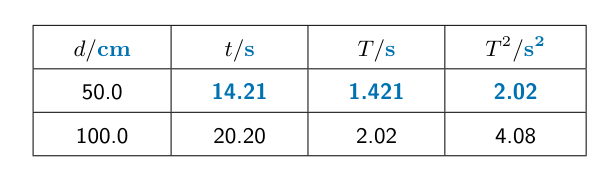
Record, in Table 1.1, the time $t$ for 10 complete oscillations.[1]

(ii)

Calculate and record in Table 1.1, the period $T$ of the pendulum. The period is the time for one complete oscillation.[1]

(iii)

Calculate $T^2$ and record your value in Table 1.1.[1]

(iv)

Write the units in the column headings.[2]

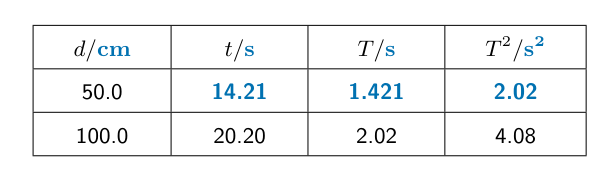
$d/$$t/$$T/$$T^2/$
50.0
100.020.202.024.08

Table 1.1

(b)

The student repeats the procedure in (a) using $d = 100.0\text{ cm}$. The readings and results are shown in Table 1.1.

Another student suggests that $T^2$ is directly proportional to $d$.

Explain briefly how to test the suggestion using the results in Table 1.1.[2]

(c)

The procedure can be repeated to plot a graph.

Suggest additional values of $d$ that are suitable for the experiment.[1]

(d)

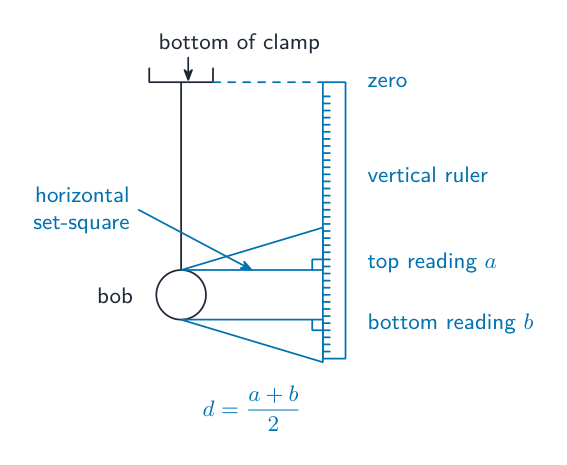
Explain how you would measure the distance $d$ as accurately as possible. Draw a diagram to help your explanation.[2]

(e)

Explain why timing 10 oscillations gives a more accurate result for the period $T$ than timing one oscillation.[1]

[Total: 11]
Show the mark scheme

These are the official mark-scheme rows. Each point that matches your answer earns a mark.

Tap the mark scheme to open it full size.

Show a worked answer

How to reach each mark, step by step. Try the question yourself first.

1(a)(i)

  • Read the stopwatch: $t = \mathbf{14.21}\,\mathrm{s}$.
Worked answer drawing

1(a)(ii)

  • Use $T = t/10$, since the time is for 10 oscillations.
  • $T = 14.21\,\mathrm{s}/10 = \mathbf{1.421}\,\mathrm{s}$.
Worked answer drawing

1(a)(iii)

  • Square the period: $T^2 = (1.421\,\mathrm{s})^2 = \mathbf{2.02}\,\mathrm{s^2}$.
Worked answer drawing

1(a)(iv)

  • Use the headings $d/\mathrm{cm}$, $t/\mathrm{s}$, $T/\mathrm{s}$ and $T^2/\mathrm{s^2}$.
Worked answer drawing

1(b)

  • Use $T^2/d$ for each row. The values are $2.02\,\mathrm{s^2}/50.0\,\mathrm{cm} = 0.0404\,\mathrm{s^2/cm}$ and $4.08\,\mathrm{s^2}/100.0\,\mathrm{cm} = 0.0408\,\mathrm{s^2/cm}$.
  • The ratios are close, so the results support direct proportionality within experimental uncertainty.

1(c)

  • Use, for example, $d = \mathbf{20.0}$, $\mathbf{40.0}$, $\mathbf{60.0}$ and $\mathbf{80.0}\,\mathrm{cm}$ to spread the readings over the range.

1(d)

  • Place a vertical ruler beside the bob, with zero at the bottom of the clamp. Use a horizontal set-square to read the top and bottom of the bob.
  • The distance to the centre is $\mathbf{d=(a+b)/2}$, where $a$ and $b$ are the two readings.
Worked answer drawing

1(e)

  • The start and stop reaction-time errors are spread over 10 oscillations, so their percentage effect on the period is smaller.
Original question

Log in or create account

IGCSE, A-Level & AP