Skip to content

IGCSE Physics · November 2023 · Paper 33 · Difficulty 3 · Standard

Question 1

1

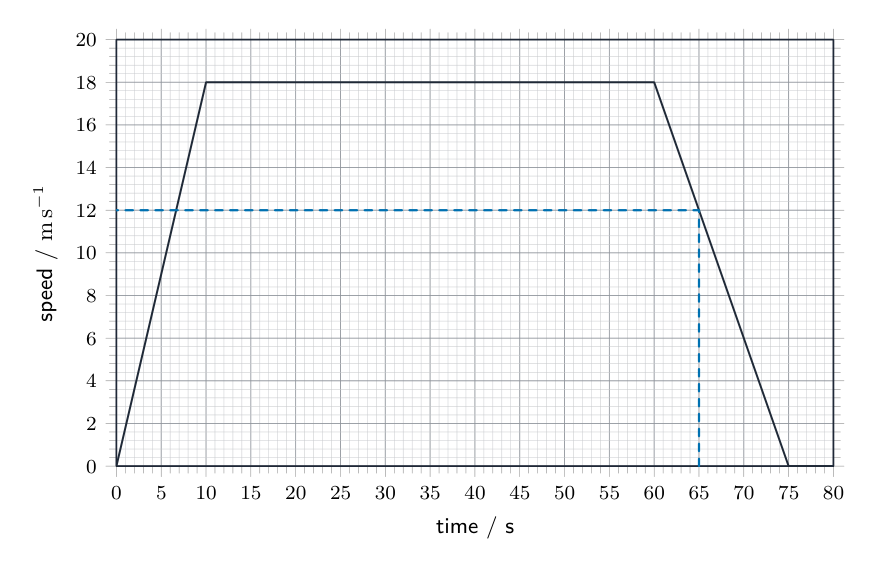
Fig. 1.1 shows the speed–time graph for a bus journey.

Fig. 1.1
(a)

Using the information in Fig. 1.1, determine:

(i)

the maximum speed of the bus during the journey

maximum speed = m/ s[1]

(ii)

the speed of the bus at time = 65s. On Fig. 1.1, show how you obtained this information.

speed = m/s[2]

(b)

Describe how the speed of the bus changes between time = 60s and time = 80s.

[2]

(c)

Determine the distance travelled by the bus between time = 0 and time = 10s.

distance travelled = m[3]

(d)

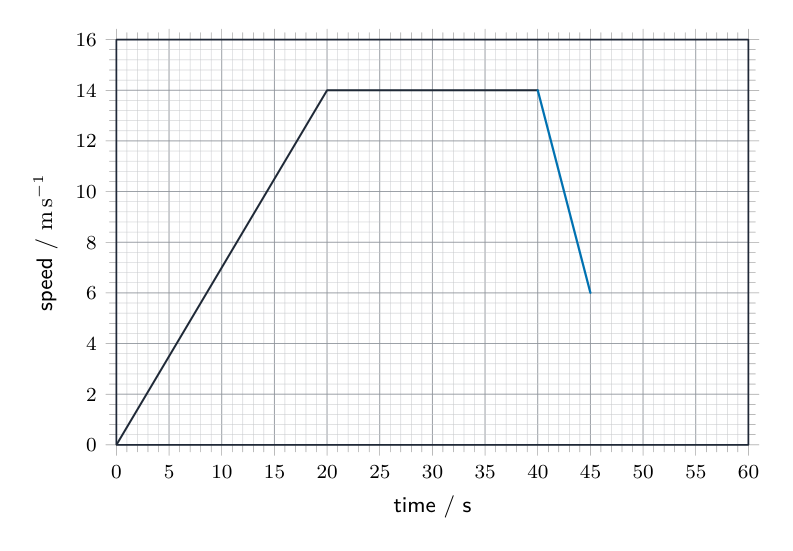
Fig. 1.2 shows the speed–time graph for another bus journey.

The driver sees a hazard ahead and applies the brakes at time = 40s.

The bus reduces its speed from 14.0m/s to 6.0m/s in a time of 5.0s.

On Fig. 1.2, draw the speed–time graph for the bus as it reduces its speed.[2]

[Total: 10]
Show the mark scheme

These are the official mark-scheme rows. Each point that matches your answer earns a mark.

Tap the mark scheme to open it full size.

Show a worked answer

How to reach each mark, step by step. Try the question yourself first.

1(a)(i)

  • The highest point on the graph gives $\mathbf{18}\,\mathrm{m/s}$.

1(a)(ii)

  • Draw a line up from $65\,\mathrm{s}$ to the graph, then across to the speed axis: $\mathbf{12}\,\mathrm{m/s}$.
Worked answer drawing

1(b)

  • The bus slows down and then stops.

1(c)

  • Distance is the area under the speed–time graph. Use the triangle area $d = \frac12 bh$.
  • $d = \frac12(10\,\mathrm{s})(18\,\mathrm{m/s}) = \mathbf{90}\,\mathrm{m}$.

1(d)

  • Start at $(40\,\mathrm{s}, 14.0\,\mathrm{m/s})$ and draw a line to $(45\,\mathrm{s}, 6.0\,\mathrm{m/s})$.
Worked answer drawing
Original question

Log in or create account

IGCSE, A-Level & AP