Skip to content

IGCSE Physics · November 2020 · Paper 52 · Difficulty 3 · Standard

Question 1

1

In this experiment, you will investigate the stretching of a spring.

Carry out the following instructions, referring to Fig. 1.1.

(a)

The metre rule is clamped in position near to the spring. Do not change the position of the metre rule.

(i)

Use the set square provided to take readings from the metre rule to determine the unstretched length L of the coiled part of the spring. Record the value of L.

L = mm[1]

(ii)

Draw a diagram to show clearly how you used the set square to obtain an accurate reading from the metre rule.[1]

(b)

• Suspend a load P = 0.20 N on the spring. Record in Table 1.1 the new length l of the spring.

  • Repeat the procedure using loads P = 0.40 N, 0.60 N, 0.80 N and 1.00 N. [2]

Table 1.1

P/Nl/mm
0.20
0.40
0.60
0.80
1.00
(c)

Plot a graph of l/mm (y-axis) against P/N (x-axis). Start both axes at the origin (0,0).[4]

(d)

The intercept on the y-axis of the graph is numerically equal to the length l$_0$ of the spring when P = 0. Determine the value of l$_0$. Show clearly on the graph how you obtained the necessary information.

l$_0$ = [2]

(e)

Calculate L – l$_0$.

L – l$_0$ = [1]

[Total: 11]
Show the mark scheme

These are the official mark-scheme rows. Each point that matches your answer earns a mark.

Tap the mark scheme to open it full size.

Show a worked answer

How to reach each mark, step by step. Try the question yourself first.

1(a)(i)

  • Use a set square to read the positions of the top and bottom of the coils. Do not include the hooks.
  • Use $L = r_{\mathrm{bottom}} - r_{\mathrm{top}}$. Record $L$ in $\mathrm{mm}$. The actual spring must be measured; Fig. 1.1 has no numbered scale.

1(a)(ii)

  • Draw the set square with one edge horizontal from the end of the spring to the metre rule. This lets you read the height at the same level.

1(b)

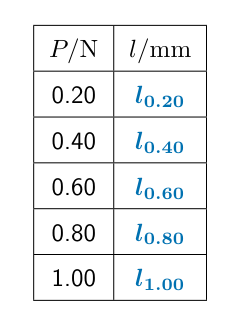
  • For each load, measure the length of the coiled part, using the same endpoints as for $L$. Record each length in $\mathrm{mm}$ in the table below.
  • Here $l_{0.20}$ means your measured length at $0.20\,\mathrm{N}$, and so on. The lengths should increase as the load increases, and all should be greater than $L$.
  • The table in the question is blank, so there are no numerical lengths to copy or calculate.
Worked answer drawing

1(c)

  • Put $P/\mathrm{N}$ on the horizontal axis and $l/\mathrm{mm}$ on the vertical axis. Start both axes at zero and choose scales that use the grid well.
  • Plot each measured pair to within half a small square. Draw a thin, continuous best-fit line through the trend of the points.

1(d)

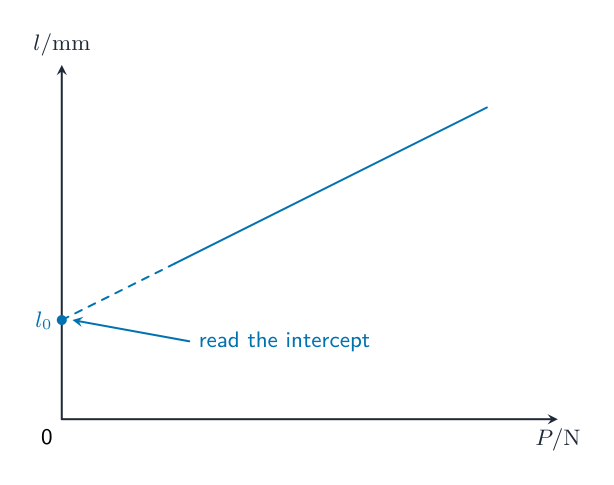
  • Extend your best-fit line back to $P = 0$. Mark where it meets the vertical axis, as shown in the method sketch below.
  • Read this intercept to within half a small square and record $l_0$ in $\mathrm{mm}$. Your measured graph is needed for a numerical answer; the sketch has no numerical scale.
Worked answer drawing

1(e)

  • Subtract the graph intercept from the measured unstretched length: $L-l_0$. Both are lengths of the spring at zero load, so the difference should be about $\mathbf{0}\,\mathrm{mm}$, within $2\,\mathrm{mm}$.
Original question

Log in or create account

IGCSE, A-Level & AP