A student investigates the forces supporting a metre ruler to determine the weight of the metre ruler.
He uses the apparatus shown in Fig. 1.1. The scale of the metre ruler faces upwards.

The student ensures that the metre ruler is horizontal.
Briefly describe how to check that the ruler is horizontal. You may draw a diagram.[1]
The student adjusts distance d between the 0.0 cm mark and the 1.50 N load, as shown in Fig. 1.1. He moves the thread supporting the 1.50 N load so that it is at the mark on the metre ruler shown in Fig. 1.2.

The metre ruler is not drawn to scale.
Record the distance d indicated on Fig. 1.2.
d = cm[1]
The reading on force meter X is shown in Fig. 1.3.

Record $F_X$, the reading on force meter X shown in Fig. 1.3.
$F_X$ = N[1]
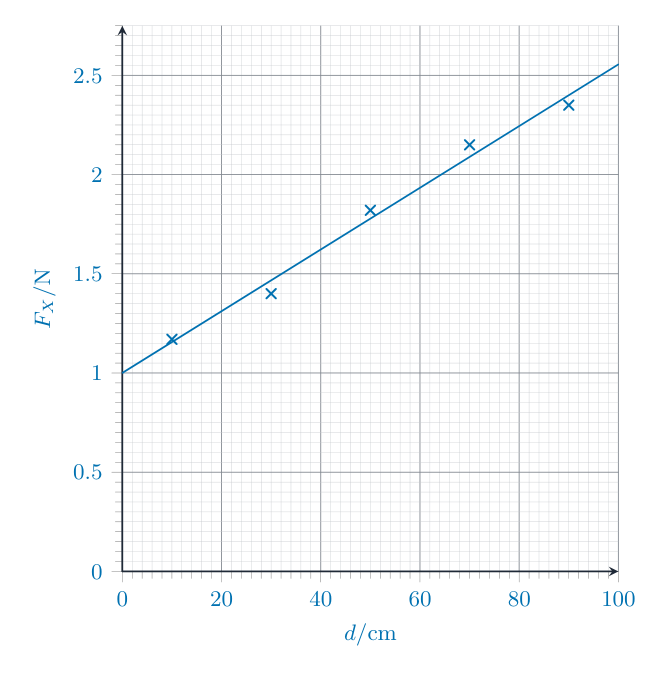
The student moves the 1.50 N load to distances d = 10.0 cm, 30.0 cm, 50.0 cm, 70.0 cm and 90.0 cm. For each distance d, he reads the value $F_X$ on force meter X.
His readings are shown in Table 1.1.
| d/cm | $F_X$/N |
| 10.0 | 1.17 |
| 30.0 | 1.40 |
| 50.0 | 1.82 |
| 70.0 | 2.15 |
| 90.0 | 2.35 |
Plot a graph of $F_X$/N (y-axis) against d/cm (x-axis). Start the axes at the origin (0,0).
Draw a best-fit straight line.[4]

From your graph, determine $F_0$, the value of $F_X$ when d = 0.0 cm.
$F_0$ =
Calculate the weight $W_R$ of the metre ruler, using the equation $W_R = 2 \times F_0$.
$W_R$ = N[2]
State and explain whether your plots made it easy to choose the best-fit line. Justify your answer with reference to your plots.
statement
explanation [1]
Another student does the experiment with the same equipment. He reads values of $F_X$ which are all higher than those in Table 1.1 by 0.05 N.
Suggest one reason for this difference. Assume that the values in Table 1.1 are accurate.[1]
[Total: 11]