A student determines the internal diameter $d$ of a test-tube.
The apparatus is assembled as shown in Fig. 1.1.

The student:
- fills a measuring cylinder with water up to the $100\text{ cm}^3$ mark
- pours some water from the measuring cylinder into the test-tube.
A full-size diagram of the bottom part of the test-tube is shown in Fig. 1.2.

On Fig. 1.2, measure the height $h$ in centimetres to the nearest millimetre.
Record your result in the top row of Table 1.1 on page 4.[1]
Fig. 1.3 shows the volume of water remaining in the measuring cylinder.

Take the reading $R$ of the volume of water remaining in the measuring cylinder.
Record your result in the top row of Table 1.1.[1]
Calculate the volume $V$ of water poured into the test-tube.
Use the equation:
Record your result in Table 1.1.[1]
Table 1.1
| $h/\text{cm}$ | $R/\text{cm}^3$ | $V/\text{cm}^3$ |
| 5.0 | 84 | 16 |
| 7.6 | 75 | 25 |
| 10.3 | 64 | 36 |
| 13.6 | 53 | 47 |
The student:
- adds more water from the measuring cylinder into the test-tube
- measures the new height $h$ of the water in the test-tube
- measures the new reading $R$ of the water remaining in the measuring cylinder
- calculates the volume of water $V$ in the test-tube
- repeats the procedure for three more values of $h$, $R$ and $V$.
The student’s results are shown in Table 1.1.
It is important to avoid line-of-sight (parallax) errors when reading the scale of the measuring cylinder.
Describe how such errors are avoided. You may draw a diagram.[1]
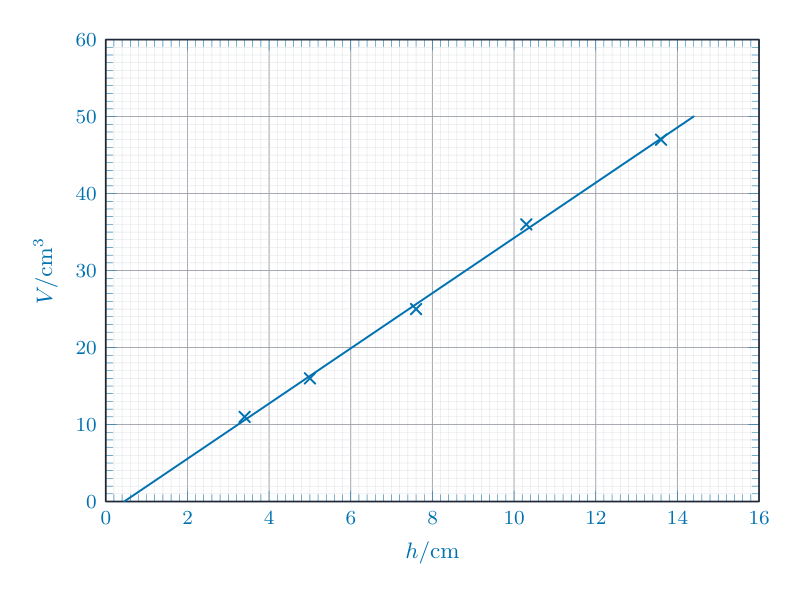
Plot a graph of $V/\text{cm}^3$ ($y$-axis) against $h/\text{cm}$ ($x$-axis). Start your axes at the origin $(0,0)$.
Draw the best-fit straight line.

[4]
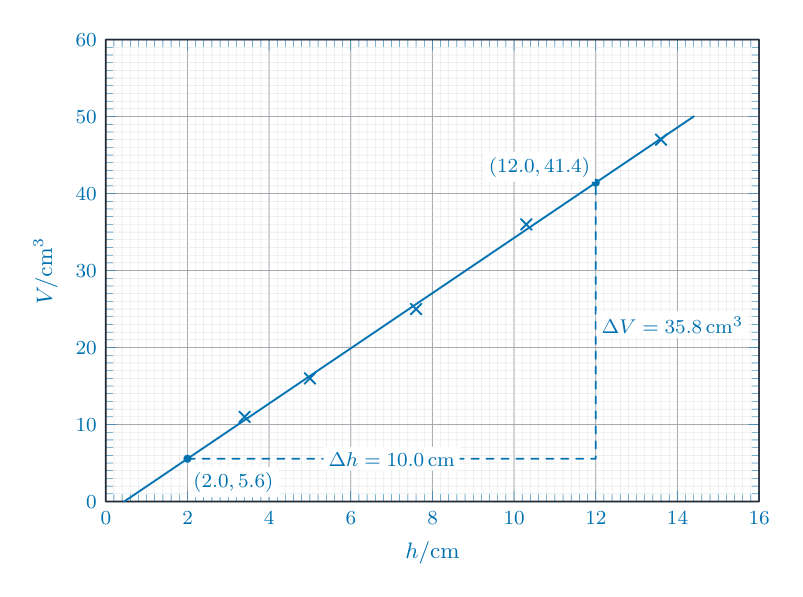
Determine the gradient $G$ of your line. Show all working and indicate on the graph the values you use.
$G =$ [1]
The internal diameter $d$ of a cylinder is given by the equation $d = k\sqrt{G}$, where $k = 1.13\text{ cm}$.
Calculate $d$ for the test-tube.
$d =$ cm[1]
Suggest one reason why your calculated value for $d$ is only approximate.[1]
[Total: 11]