Skip to content

IGCSE Physics · June 2025 · Paper 42 · Difficulty 4 · Challenging

Question 1

1

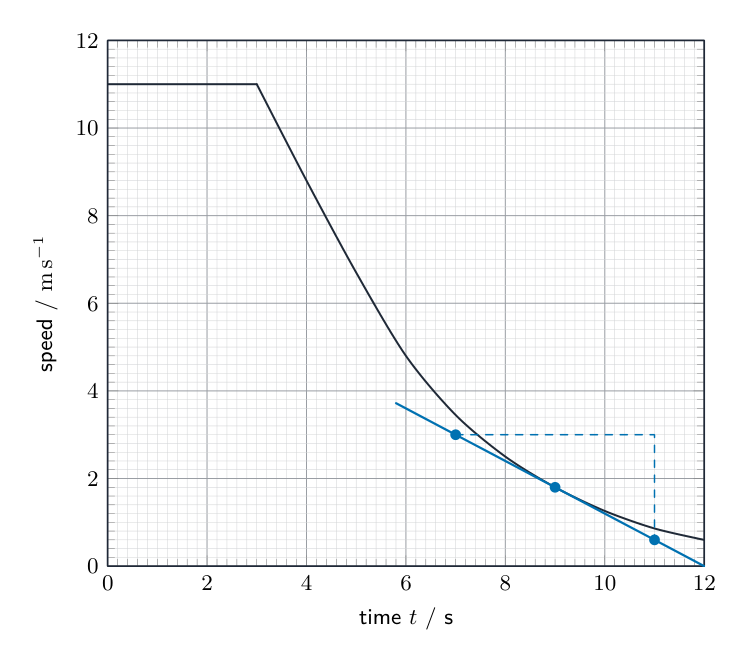
Fig. 1.1 is a speed–time graph for an ice skater.

Fig. 1.1
(a)

Describe the motion of the skater between $t = 0$ and $t = 3.0\text{ s}$.[1]

(b)

Calculate the distance travelled by the skater between $t = 0$ and $t = 3.0\text{ s}$.

distance = [2]

(c)
(i)

State what is meant by deceleration.[1]

(ii)

Draw a tangent to the graph at $t = 9.0\text{ s}$.

Use the tangent to calculate the deceleration of the skater at $t = 9.0\text{ s}$.

deceleration = [3]

[Total: 7]
Show the mark scheme

These are the official mark-scheme rows. Each point that matches your answer earns a mark.

Tap the mark scheme to open it full size.

Show a worked answer

How to reach each mark, step by step. Try the question yourself first.

1(a)

  • The skater moves at a constant speed.

1(b)

  • Use distance $s = vt$, the area under the speed–time graph.
  • $s = (11\,\mathrm{m/s})(3.0\,\mathrm{s}) = \mathbf{33}\,\mathrm{m}$.

1(c)(i)

  • Deceleration is the rate of decrease of velocity.

1(c)(ii)

  • Draw the tangent at $t = 9.0\,\mathrm{s}$, as shown below.
  • Two points on the tangent are $(7.0\,\mathrm{s}, 3.0\,\mathrm{m/s})$ and $(11.0\,\mathrm{s}, 0.6\,\mathrm{m/s})$.
  • Its gradient is $a = \dfrac{0.6-3.0}{11.0-7.0} = -0.60\,\mathrm{m/s^2}$.
  • The deceleration is $\mathbf{0.60}\,\mathrm{m/s^2}$.
Worked answer drawing
Original question

Log in or create account

IGCSE, A-Level & AP