A student investigates the behaviour of a spring, and then uses the spring to determine the mass of an object.
The apparatus is shown in Fig. 1.1.

The student suspends a mass $m = 100\text{g}$ from the spring.
She measures, and records in Table 1.1, the stretched length $l$ of the spring, as indicated in Fig. 1.1.
Describe two techniques for measuring the length of the spring, to ensure an accurate reading. You may draw a diagram.[2]
1
2
She repeats step (a) for values of $m = 200\text{g}$, $m = 300\text{g}$, $m = 400\text{g}$ and $m = 500\text{g}$.
Her readings are shown in Table 1.1.
| m/g | l / cm |
| 100 | 6.0 |
| 200 | 9.2 |
| 300 | 13.6 |
| 400 | 16.8 |
| 500 | 21.0 |
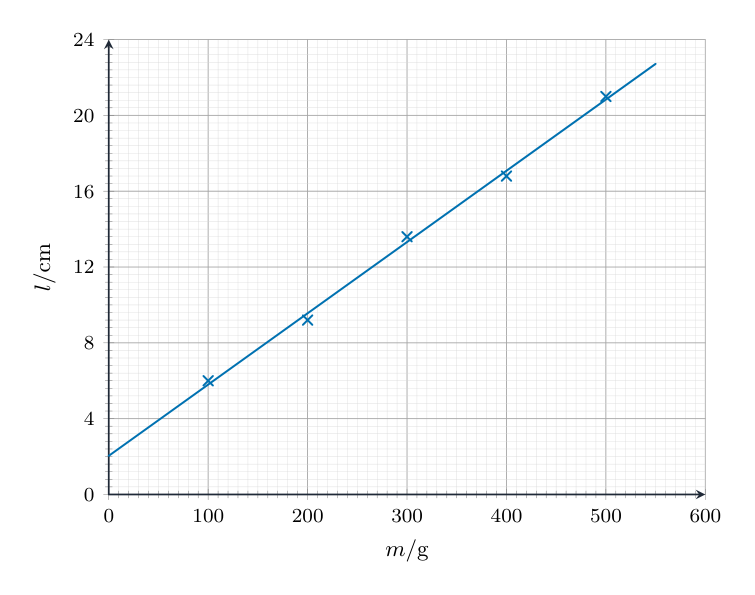
Plot a graph of $l /\text{cm}$ ($y$-axis) against $m/\text{g}$ ($x$-axis).
Start the axes from the origin (0,0).
Draw a best-fit straight line. The line might not go through the origin.[4]

Use your graph to determine the length $l_0$ of the spring with no load on it.
$l_0 =$ $\text{cm}$[1]

An object X is suspended from the spring.
On Fig. 1.2, measure the stretched length $l_X$ of the spring.
$l_X =$ [1]
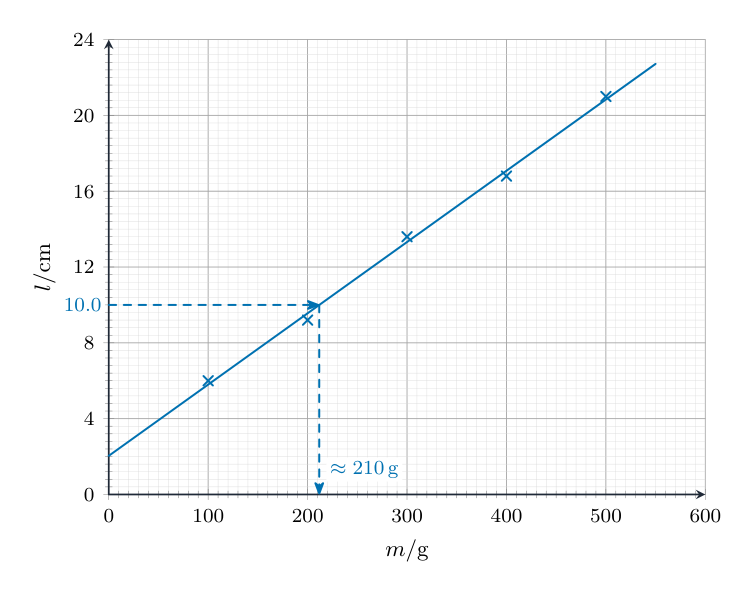
Use the graph and your reading from (d)(i), to determine the mass $m_X$ of object X.
Show clearly on the graph how you obtained your answer.
$m_X =$ $\text{g}$[2]
Two students measure the mass of another object using the same method and apparatus.
One student records the mass as $132.6\text{g}$. The other student records the mass as $130\text{g}$.
State and explain which answer has the more suitable number of significant figures for this experiment.
statement
explanation [1]
[Total: 11]