Graphs in practical situations
مُقدَّم| English | المعنى |
|---|---|
| gradient/ˈɡreɪdɪənt/ | الميل |
| acceleration/əkˌseləˈreɪʃn/ | التسارع |
| conversion graph/kənˈvɜːʃn ɡræf/ | منحنى التحويل |
Reading the story in a graph
- A distance–time graph is not just a line — it's a story of a journey. A steep section means fast travel; a flat section means stopped.
- Every graph tells a story through its shape and gradient 斜率.
Distance–time graphs
- Gradient = speed (distance ÷ time).
- Steeper line = faster speed.
- Flat line = stationary (not moving).
- Curved line = changing speed (accelerating or decelerating).
A car travels 60 km in 2 hours, stops for 30 minutes, then returns in 1.5 hours. The graph has three sections: slope up, flat, slope down.
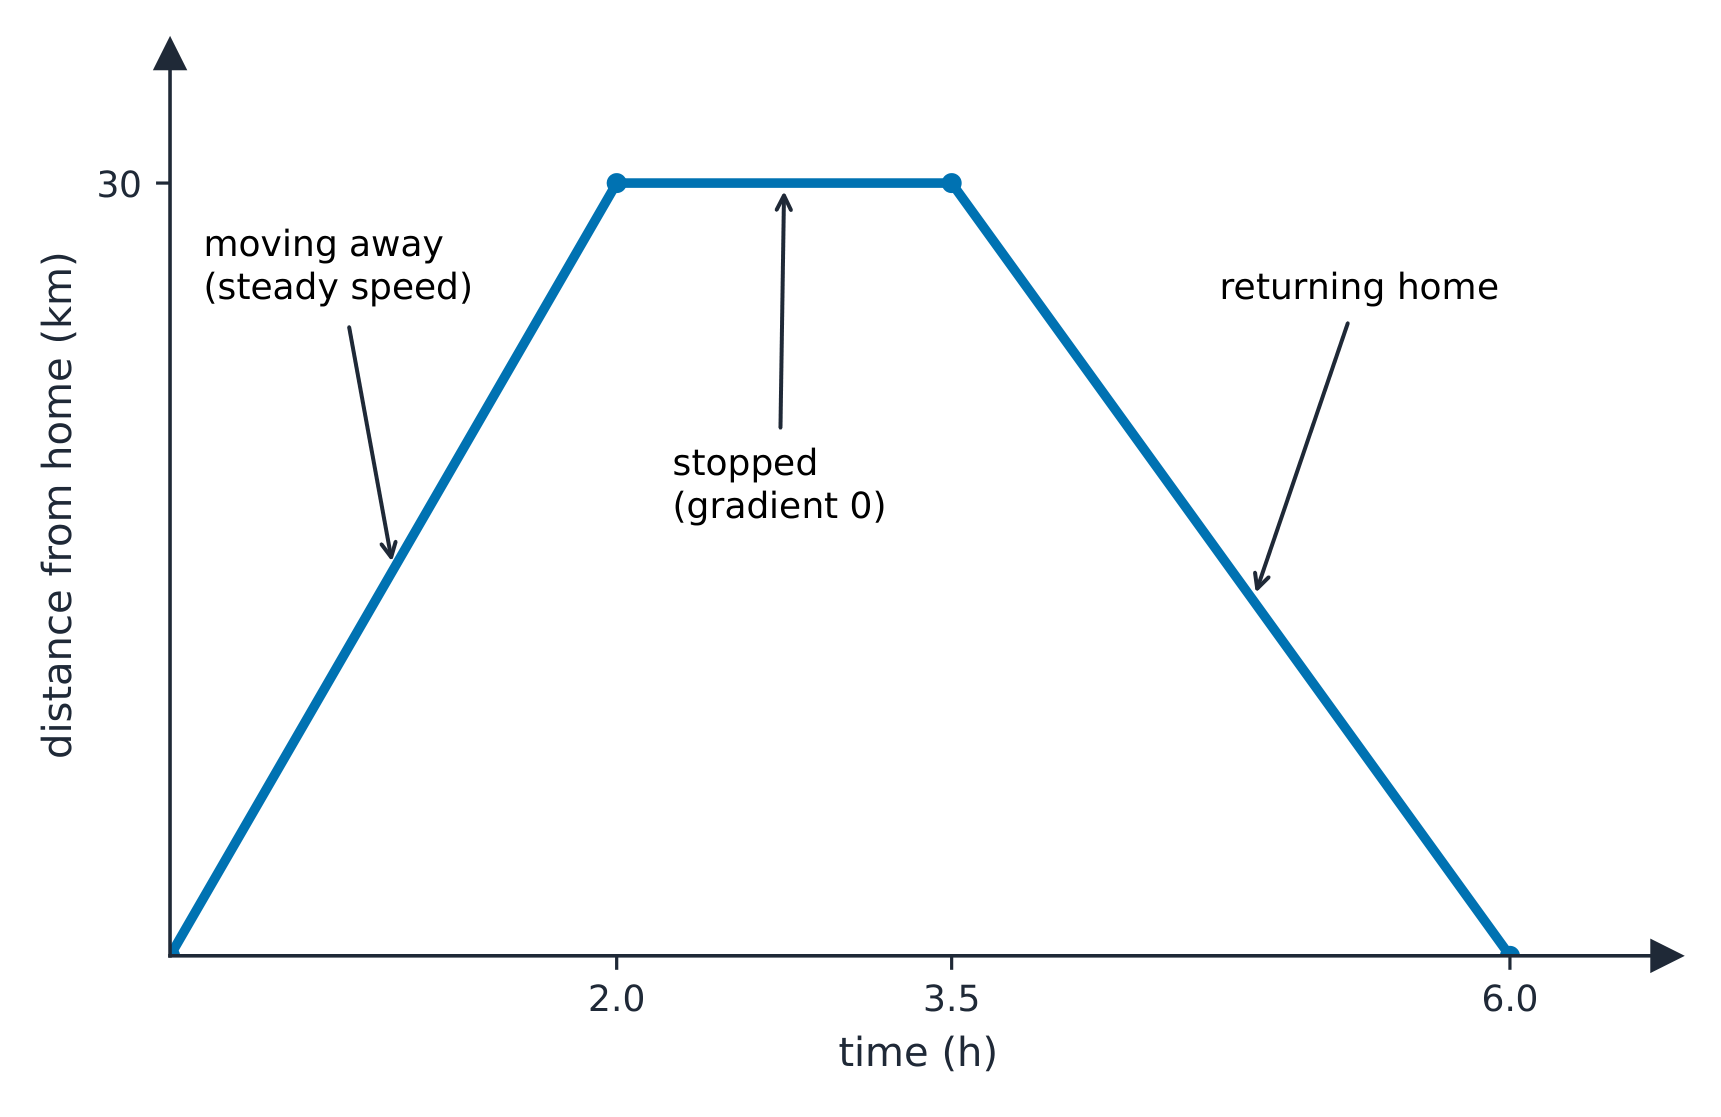
On a distance-time graph the gradient is the speed; a flat section means the object has stopped
الرسوم البيانية الحقيقية
y = ax + b
A distance–time or cost graph is read from its الميل and its المقطع.
On a distance–time graph, the gradient represents the:
الصعوبة 1/5 · 100 عملة + مكافأة صغيرة عند الإنجاز الأول اليوم
Distance ÷ time = speed, which is the gradient.
On a distance–time graph, a flat (horizontal) section means the object is stationary.
الصعوبة 1/5 · 100 عملة + مكافأة صغيرة عند الإنجاز الأول اليوم
A flat section has gradient 0, meaning distance is not changing — the object is not moving.
Speed–time graphs (Extended)
- Gradient = acceleration 加速度 (change in speed ÷ time).
- Area under the graph = total distance travelled.

The area under a speed–time graph gives the distance: triangle $+$ rectangle $= 80 + 240 = 320$ m.
Area, not height. The distance is the area under the graph, not the speed reading. A car going 20 m/s for 12 s covers $20 \times 12 = 240$ m — the rectangle's area.
A car speeds up from rest to 20 m/s in 8 s. What is the acceleration (m/s²)?
الصعوبة 2/5 · 140 عملة + مكافأة صغيرة عند الإنجاز الأول اليوم
acceleration = 20/8 = 2.5 m/s² (the gradient of the speed–time graph).
On a speed–time graph, the ______ under the graph gives the distance travelled.
الصعوبة 1/5 · 100 عملة + مكافأة صغيرة عند الإنجاز الأول اليوم
The area under a speed-time graph equals distance (speed × time, integrated over the duration).
Worked example
- A car accelerates from rest to 20 m/s in 8 s, then travels at 20 m/s for 12 s.
- Acceleration $= \dfrac{20}{8} = 2.5$ m/s² (the gradient of the first section).
- Distance $= \dfrac{1}{2}(8)(20) + (12)(20) = 80 + 240 = 320$ m (area of triangle + rectangle).
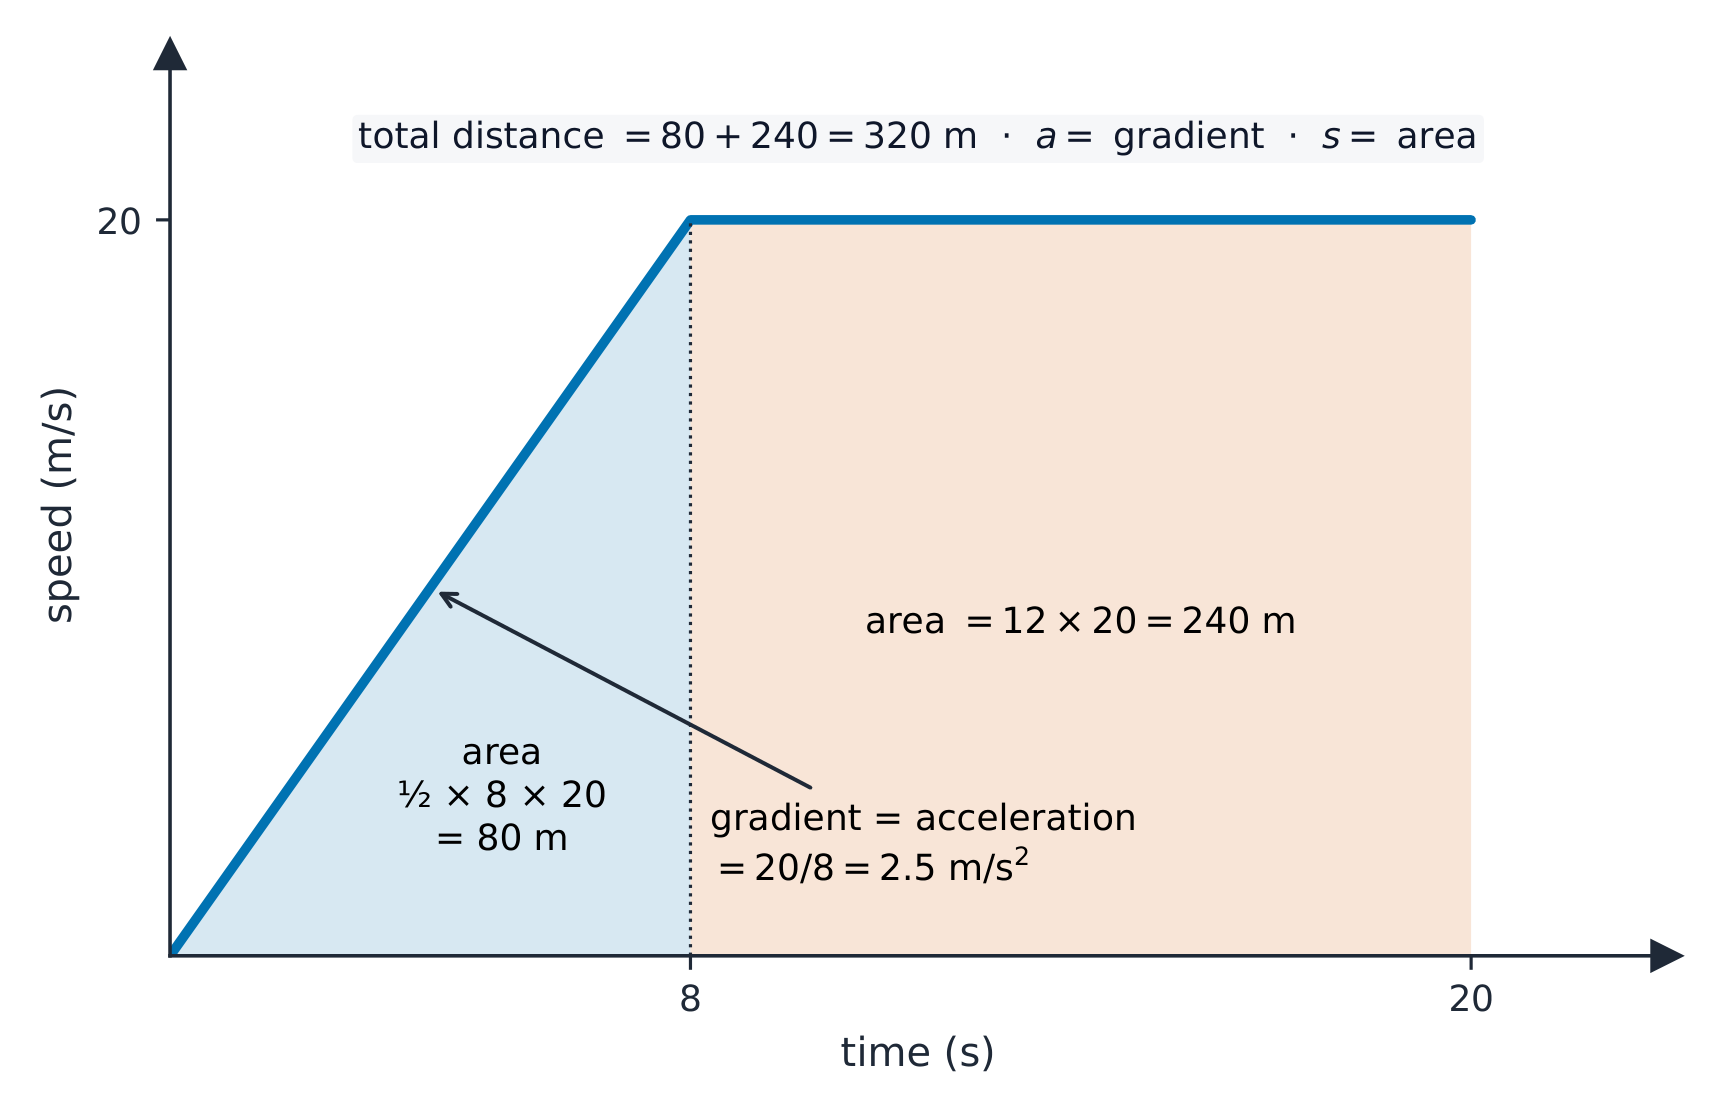
On a speed-time graph the gradient is the acceleration and the area underneath is the distance travelled
Then it stays at 20 m/s for 12 s. Total distance = ½(8)(20) + 12(20). What is it (m)?
الصعوبة 2/5 · 140 عملة + مكافأة صغيرة عند الإنجاز الأول اليوم
Area = triangle 80 + rectangle 240 = 320 m.
Conversion graphs 换算图
- A conversion graph is a straight line that converts between two units.
- Miles to km: draw a line through $(0, 0)$ and $(5, 8)$ (5 miles ≈ 8 km).
- Read across from one axis, up/down to the line, then across to the other axis.
A conversion graph passes through (0, 0) and (5, 8) for miles to km. How many km is 10 miles?
الصعوبة 2/5 · 140 عملة + مكافأة صغيرة عند الإنجاز الأول اليوم
Gradient = 8/5 = 1.6 km per mile. 10 miles = 10 × 1.6 = 16 km.
Worked example: a journey with a stop
A cyclist rides 12 km from home in 40 minutes, stops for 20 minutes, then rides the same 12 km back home in 30 minutes.
- Outward speed $= \dfrac{12}{40 \div 60} = \dfrac{12}{\frac{2}{3}} = 18$ km/h. Change minutes to hours first.
- On the distance–time graph, the stop is a flat line for 20 minutes, and the return is a line sloping down to 0 km.
- Return speed $= \dfrac{12}{0.5} = 24$ km/h: that line is steeper.
- Average speed for the whole trip $= \dfrac{\text{total distance}}{\text{total time}} = \dfrac{24}{1.5} = 16$ km/h. The stop counts in the total time.
A bus travels 30 km in 45 minutes, waits 15 minutes, then travels 20 km in 30 minutes. Find its average speed for the whole journey, in km/h.
الصعوبة 2/5 · 140 عملة + مكافأة صغيرة عند الإنجاز الأول اليوم
Total distance 50 km. Total time 45 + 15 + 30 = 90 min = 1.5 h. 50 ÷ 1.5 = 33.3 km/h. The wait counts.
On a distance–time graph, what does a horizontal line show?
الصعوبة 1/5 · 100 عملة + مكافأة صغيرة عند الإنجاز الأول اليوم
The distance does not change, so the speed is zero.
You've got it
- distance–time: gradient $=$ speed; flat $=$ stationary
- speed–time: gradient $=$ acceleration; area $=$ distance
- a conversion graph converts between two units via a straight line
Write from the data: find the acceleration
- A car speeds up from rest to 15 metres per second in 5 seconds.
- Find the acceleration.
A car speeds up from rest to 15 metres per second in 5 seconds. What is the acceleration, in metres per second squared?
15 divided by 5 is 3.
What is the acceleration?
الصعوبة 1/5 · 100 عملة + مكافأة صغيرة عند الإنجاز الأول اليوم
Change in speed over time is 3. Other options — 2.5 (the lesson acceleration); 15 (the final speed).