Population patterns and development
引入| English | 释义 | 拼音 |
|---|---|---|
| population distribution/ˌpɒpjʊˈleɪʃn ˌdɪstrɪˈbjuːʃn/ | 人口分布 | rén kǒu fēn bù |
| population density/ˌpɒpjʊˈleɪʃn ˈdensɪti/ | 人口密度 | rén kǒu mì dù |
| development/dɪˈveləpmənt/ | 发展 | fā zhǎn |
| Human Development Index/ˈhjuːmən dɪˈveləpmənt ˈɪndeks/ | 人类发展指数 | rén lèi fā zhǎn zhǐ shù |
| natural increase/ˈnætʃərəl ˈɪŋkriːs/ | 自然增长 | zì rán zēng zhǎng |
Two people per square kilometre, half in one city
- Mongolia has about 3.5 million people in 1.56 million km² — roughly 2 people per km², among the lowest densities on Earth. Yet nearly half of all Mongolians live in one city, Ulaanbaatar, where winter smog from crowded ger districts is among the worst in the world.
- The national figure is true but hides the pattern. Geography asks where people actually are, and why: population distribution 人口分布, not just population density 人口密度.
Why is Mongolia's national density of about 2 per km² misleading?
难度 1/5 · 今日首次完成可获 100 金币及少量额外奖励
The average hides strong clustering.
Density and distribution
- Population density = people ÷ area, in people per km². It is an average over the whole area.
- Distribution describes how people are spread: clustered in valleys, coasts and cities, sparse in deserts, mountains and cold lands.
A district has 60,000 people in 300 km². What is its population density in people per km²?
难度 2/5 · 今日首次完成可获 140 金币及少量额外奖励
60,000 ÷ 300 = 200 per km².
Worked example: one number, two places
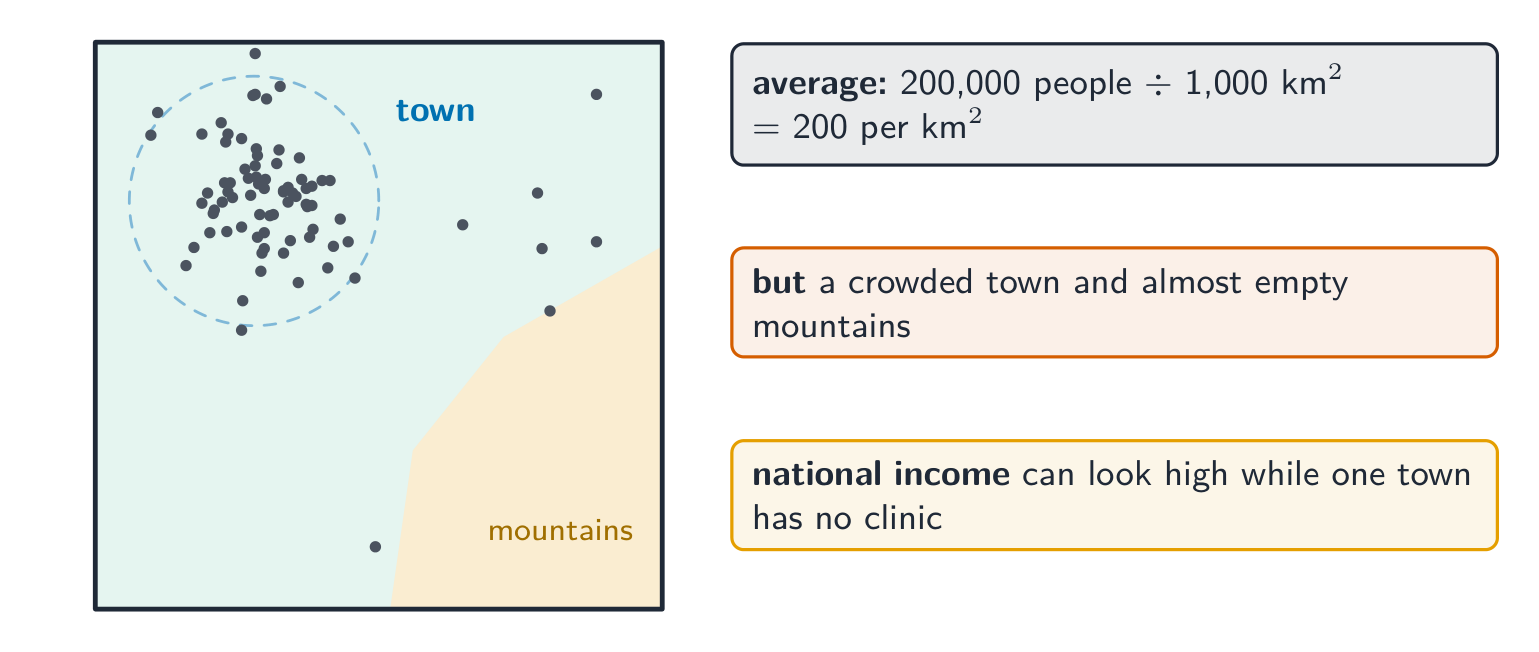
A region has 200,000 people in 1,000 km².
- Average: $\frac{200\,000}{1\,000} = 200$ people per km².
- Pattern: 180,000 people live in a town of 40 km² ($\frac{180\,000}{40} = 4\,500$ per km²); the other 20,000 live across 960 km² of mountains (about 21 per km²).
- Meaning: planning by the average would put too few buses and schools in the town and too many services in the mountains. The map of distribution, not the average, guides decisions.
In the worked example, what is the density of the town in people per km²?
难度 2/5 · 今日首次完成可获 140 金币及少量额外奖励
180,000 ÷ 40 = 4,500 per km².
Measuring development
- Development 发展 includes income, health, education and choice. GNI per capita measures average income; the Human Development Index 人类发展指数 (HDI) combines income, life expectancy and years of schooling.
- Like density, national averages hide inequality: a country's income can look high while a remote town has no clinic.
Which does the Human Development Index combine?
难度 2/5 · 今日首次完成可获 140 金币及少量额外奖励
Density is not part of HDI.
Population change
- Population grows through natural increase 自然增长 (births minus deaths) and net migration. The demographic transition model shows death rates falling first, then birth rates, as countries develop.
- Ageing populations (Japan, Italy) and youthful ones (Niger) face different challenges: pensions and care versus schools and jobs.
What is natural increase?
难度 1/5 · 今日首次完成可获 100 金币及少量额外奖励
Net migration is the other part of population change.
Explaining patterns
- Physical factors: water, relief, climate, soil. Human factors: jobs, transport, history, government policy.
- Ulaanbaatar grew because harsh winters (dzud) killed herds and pushed herders towards jobs and services in the capital.
Classify each factor.
难度 2/5 · 今日首次完成可获 140 金币及少量额外奖励
Patterns have physical and human causes.
A national average is not a description of the country. "Mongolia is empty" is wrong for half of its people. Always ask how the population or income is distributed inside the area.
A national average describes how people live everywhere in a country.
难度 1/5 · 今日首次完成可获 100 金币及少量额外奖励
Averages hide distribution.
Population density is an average; distribution shows where people actually live. Development is measured by indicators such as GNI per capita and HDI, which also hide internal inequality. Explain patterns with physical and human factors, and plan from distribution, not averages.
Explain why a country's average income can hide inequality, using an example.
Average, pattern, decision.