| English | 释义 | 拼音 |
|---|---|---|
| data science/ˈdeɪtə ˈsaɪəns/ | 数据科学 | shù jù kē xué |
| descriptive statistics/dɪˈskrɪptɪv stəˈtɪstɪks/ | 描述性统计 | miáo shù xìng tǒng jì |
| visualisation/ˌvɪʒuːəlaɪˈzeɪʃn/ | 可视化 | kě shì huà |
| correlation is not causation/ˌkɒrɪˈleɪʃn ɪz nɒt kɔːˈseɪʃn/ | 相关不等于因果 | xiāng guān bù děng yú yīn guǒ |
Five students answer, but only four give a time
- A fictional commute survey has five rows: 10, 20, 30, 40 and one blank, measured in minutes. Calling the blank zero changes the result.
- Data science 数据科学 combines a question, data preparation, analysis and interpretation. Begin by stating which students and which journey the question concerns.
Check what a suspicious value means
- Inspect units, impossible values, repeated rows and missing fields. A repeated value is not automatically a duplicate person, and an unusual value is not automatically an error.
- Keep a record of each correction or exclusion. If one field is blank, other usable fields in that row may still support a different analysis.
删除任何包含空白字段的行总是中立的清洗决策。
难度 1/5 · 今日首次完成可获 100 金币及少量额外奖励
有用的字段可能会保留,且缺失值可能导致保留的观察产生偏差。
两名受访者可以给出相同的通勤时间,而不会使任何一行成为重复项。
难度 1/5 · 今日首次完成可获 100 金币及少量额外奖励
正确。相等值很常见;在删除任何数据前,应检查身份记录和集合记录。
Use the denominator that matches the question
- Descriptive statistics 描述性统计 summarize the observed data. Here the four recorded times total 100 minutes: mean 25 and median 25, with four valid times from five respondents.
- A visualisation 可视化 should state its units and population. Do not label the mean as the mean for all five students unless the missing value is resolved.
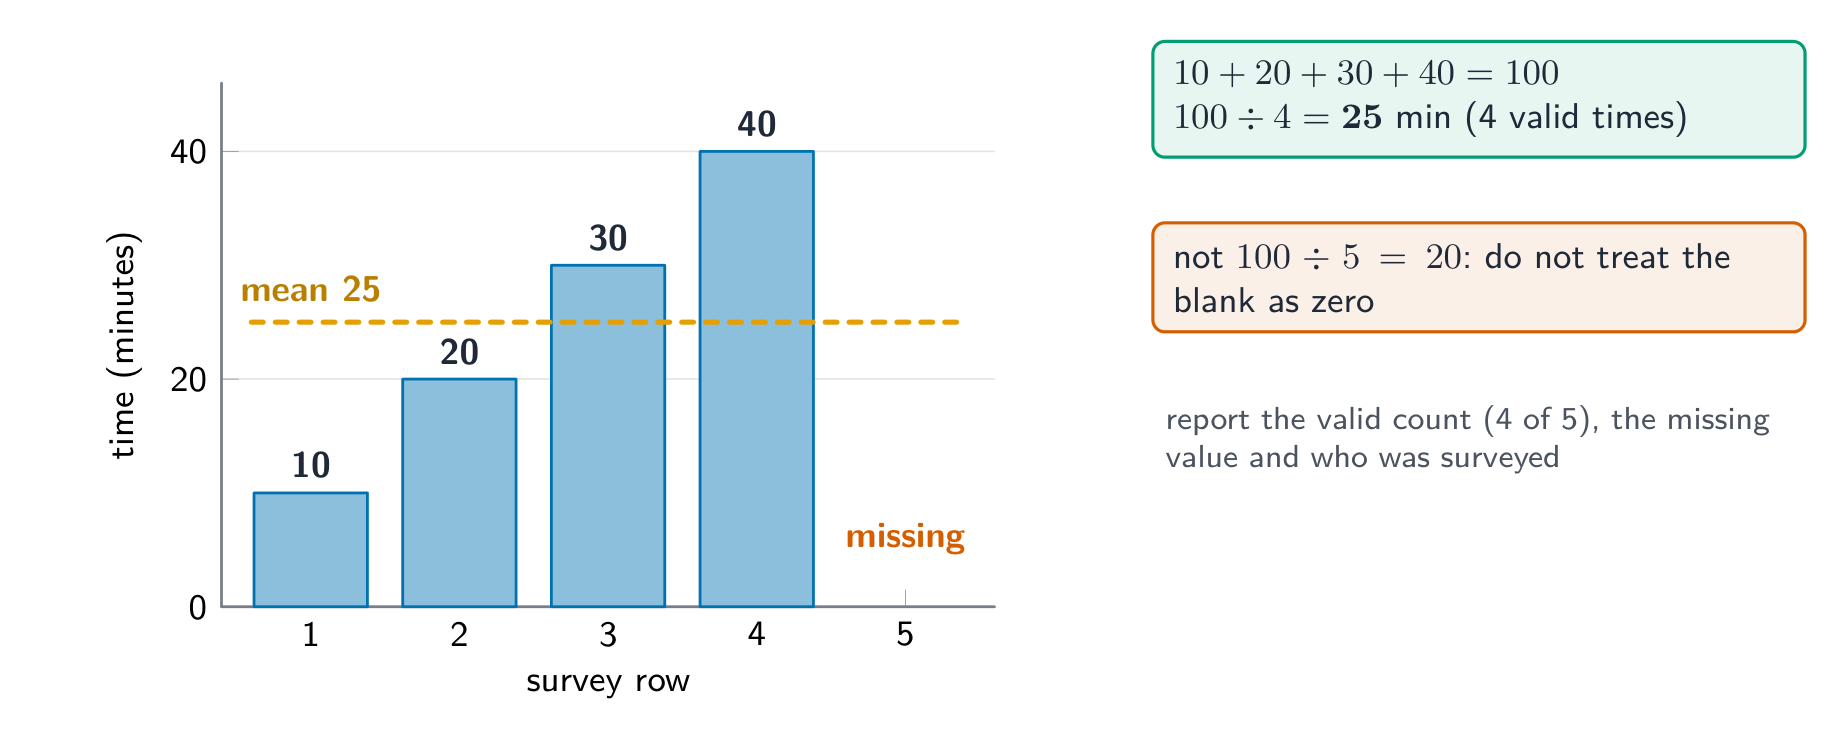
记录的时间为10、20、30和40分钟,另外还有一个空白项。记录时间的平均值是多少?
难度 2/5 · 今日首次完成可获 140 金币及少量额外奖励
总100除以四个有效记录时间,得出25分钟。
Choose the chart for the comparison
- Use a bar chart to compare categories, a line chart for an ordered time series, and a scatter plot to examine two numeric variables together.
- Give the chart a useful title, labelled axes, units and the relevant sample size. A viewer must know what each value represents.
将每个比较项与合适的初始图表进行匹配。
难度 2/5 · 今日首次完成可获 140 金币及少量额外奖励
选择能表达数据关系的图表。
无标签坐标轴仍能可靠地告知读者单位和测量变量。
难度 1/5 · 今日首次完成可获 100 金币及少量额外奖励
提供变量和单位;读者不应猜测。
Separate a pattern from its cause
- Correlation is not causation 相关不等于因果: an observed relationship alone does not show that one variable produced the other. Other factors and the study design matter.
- If a survey finds longer commuters sleep less, describe the association within the respondents. Do not conclude that changing commute time alone will change sleep.
通勤时间较长的受访者报告睡眠较少。哪项结论得到支持?
难度 1/5 · 今日首次完成可获 100 金币及少量额外奖励
该观察未隔离因果效应,也不足以支持更广泛的人群主张。
Report a finding with its limits
- Report: “The four recorded commute times have mean 25 minutes; one of five respondents did not give a time.” Missingness can affect how representative the result is.
- State the sample and collection limits before recommending action. A one-class survey does not establish a result for every student in the city.
Question → checked data → transparent calculation → labelled chart → limited conclusion. Missing values and sample boundaries belong in the explanation.
写出针对60名学生(来自一个班级)的 survey 的一个局限性。
难度 3/5 · 今日首次完成可获 200 金币及少量额外奖励
由于一个班级可能与其他班级不同,因此结果不应自动推广到整个城市。
哪份报告透明地反映了通勤结果?
难度 1/5 · 今日首次完成可获 100 金币及少量额外奖励
指出有效的分母和缺失的数量。