Связь различных представлений пределов
Введено| English | Значение |
|---|---|
| graph/ɡræf/ | График |
| table/ˈteɪbl/ | Таблица |
| formula/ˈfɔːmjʊlə/ | Формула |
| representations/ˌreprɪˈzenteɪʃnz/ | Представления |
One limit, four disguises
- A single limit can appear as a graph, a table, a formula, or a sentence in words.
- $\displaystyle\lim_{x\to2}f(x)=3$ is the same fact whether you see a curve heading to $3$, a table closing in on $3$, an algebra result of $3$, or "$f$ approaches $3$ near $2$."
- Fluency means moving between these four representations 表示 without losing the meaning.
- The exam mixes them on purpose — so practice the translation both ways.
График, таблица, формула и слова — это четыре ____ одного и того же предела.
Сложность 1/5 · 100 монет + небольшой бонус за первое выполнение сегодня
Все они должны рассказывать единую согласованную историю.
Graph ⇄ words
- From a graph 图像: trace both sides toward $c$ and read the shared height.
- Into words: "the left and right limits agree at $3$, so the limit is $3$" — even if the plotted point sits elsewhere.
- A jump on the graph becomes "the one-sided limits differ, so the limit does not exist."
- Practice describing a graph's behavior in one precise sentence.
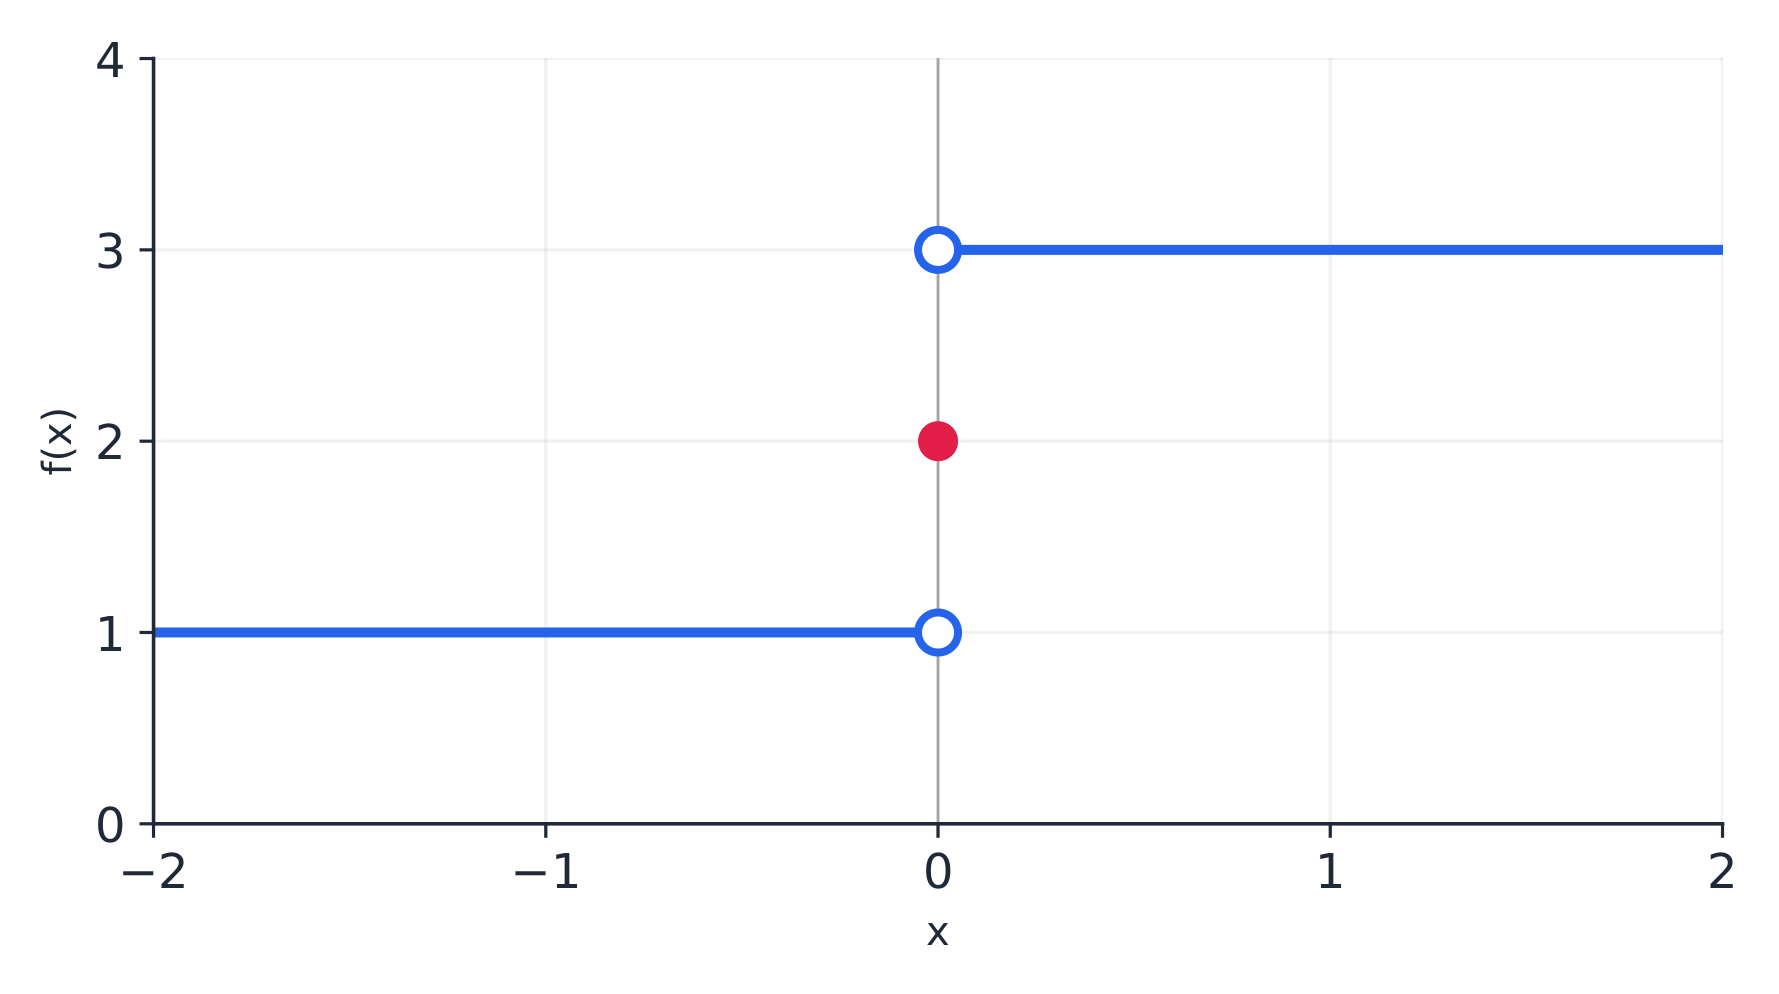
One-sided limits disagree: from the left f approaches 1 and from the right 3 so the limit at 0 does not exist
Графическое представление
y = ax² + bx + c
Эта же кривая может быть представлена в виде таблицы или формулы — изучите её поведение вблизи точки и опишите словами.
На графике кривая стремится к высоте $3$ с обеих сторон от $x=2$, с закрашенной точкой в $(2,7)$. Какое утверждение соответствует графику?
Сложность 1/5 · 100 монет + небольшой бонус за первое выполнение сегодня
Подход кривой дает предел $3$; закрашенная точка задает отдельное значение функции $f(2)=7$.
Table ⇄ formula
- From a table 表格: watch the outputs converge; that shared number is your numerical estimate.
- Confirm it with the formula by factoring or substituting — algebra turns the estimate into certainty.
- If the table and the algebra agree, you have strong, cross-checked evidence.
- If they disagree, recheck your inputs — a table can be fooled, algebra usually cannot.
Таблица показывает значения $f(1.99)=4.98$, $f(2.01)=5.02$. Укажите численную оценку для $\lim_{x\to2}f(x)$.
Сложность 2/5 · 140 монет + небольшой бонус за первое выполнение сегодня
Обе стороны сходятся к значению $5$.
Let representations check each other
- The real skill: use one representation to confirm a limit found from another.
- Found $L$ by algebra? Sketch the graph or build a quick table to sanity-check.
- Read $L$ off a graph? Verify with substitution if a formula is available.
- Choose the most informative representation for the question — sometimes a picture is instant, sometimes algebra is exact.
Хорошая привычка — подтверждать алгебраический предел быстрой таблицей или графиком.
Сложность 1/5 · 100 монет + небольшой бонус за первое выполнение сегодня
Перекрёстная проверка по разным представлениям позволяет выявить ошибки.
Какое представление даёт точный значение предела (а не просто оценку)?
Сложность 1/5 · 100 монет + небольшой бонус за первое выполнение сегодня
Алгебра обеспечивает точность; таблицы и графики дают лишь оценки или иллюстрации.
Если алгебраический расчет показывает предел $4$, но график явно стремится к $2$, что следует сделать?
Сложность 2/5 · 140 монет + небольшой бонус за первое выполнение сегодня
Расхождение означает ошибку — найдите её. Вычисление среднего или выбор простого варианта недопустимы.
The four representations must tell a consistent story. If your algebra says the limit is $4$ but the graph clearly heads to $2$, one of them is wrong — most often a sign slip in the algebra or misreading the graph's open vs. filled dot. Don't ignore the clash; find the error.
Confirm $\displaystyle\lim_{x\to1}\dfrac{x^2+4x-5}{x-1}$ using two representations.
- Analytical: factor $\dfrac{(x-1)(x+5)}{x-1}=x+5$, so the limit is $1+5=6$.
- Numerical: $f(0.99)=5.99$, $f(1.01)=6.01$ — the table closes in on $6$ from both sides.
- The formula gives certainty and the table confirms it: consistent story, answer $6$.
A limit lives in four representations — graph, table, formula, words — and they must agree. Translate fluently between them, and use one to confirm another: algebra for certainty, a graph or table for a fast sanity-check. A disagreement means an error to hunt down.