Photosynthesis and limiting factors
Introduced| English | Meaning |
|---|---|
| photosynthesis/ˌfəʊtəʊˈsɪnθəsɪs/ | The process by which plants and other organisms use light energy to make organic substances from carbon dioxide and water. |
| limiting factor/ˈlɪmɪtɪŋ ˈfæktə/ | A factor whose availability restricts the rate or extent of a process. |
What would explain this observation?
- A brighter lamp does not always produce more oxygen from pondweed. Another factor may limit the process when light is already sufficient.
Build the model
- Photosynthesis 光合作用 transfers energy from light into chemical stores.
- Carbon dioxide and water form carbohydrate, releasing oxygen.
- Chlorophyll absorbs light; light intensity, temperature and carbon dioxide supply can affect rate.
- limiting factor 限制因素: A factor whose shortage restricts rate.
- photosynthesis: Light-driven formation of carbohydrate.

A rate-light graph reaches a plateau. What follows?
Difficulty 1/5 · 100 coins + a small bonus on first completion today
On the plateau, adding more light no longer raises the rate, so light is no longer the limiting factor; another factor such as carbon dioxide or temperature may now limit it. Photosynthesis has not stopped - the rate is constant, not zero.
Match each technical term to its precise meaning.
Difficulty 2/5 · 140 coins + a small bonus on first completion today
Use the definitions to distinguish related quantities and processes.
Choose evidence that can test it
- Change only one factor when testing a limiting factor.
- At low light, extra light may increase rate.
- At a plateau, the changed factor is no longer the main limit in that range; the graph alone does not identify which other factor is limiting.
In the lab: Measure collected gas volume over a fixed time instead of assuming all bubbles have the same volume. Control temperature, plant size and carbon dioxide supply. Allow the plant to adjust before each reading and repeat.
Which two habits make the investigation or model in this case more defensible?
Difficulty 2/5 · 140 coins + a small bonus on first completion today
Stating the conditions and assumptions lets others repeat the work exactly, and recording the supporting evidence lets them check the conclusion. Hiding disagreeing results removes the evidence that could challenge a wrong conclusion, and one measurement can never establish a wider claim.
Work from known quantities
- Known: 6.0 cubic centimetres of gas are collected in 3.0 minutes.
- Use rate = volume/time.
- Rate = 6.0/3.0 = 2.0 cubic centimetres per minute.
- Bubble counts can be a rough proxy, but bubbles of different size make comparisons less reliable.
Your turn: 9.0 cubic centimetres of gas are collected in 3.0 minutes. Find the rate.
A plateau reveals a different limiting factor
When more light no longer increases rate, another factor limits the model.
9.0 cubic centimetres of gas are collected in 3.0 minutes. Find the rate.
Difficulty 2/5 · 140 coins + a small bonus on first completion today
The result is 3 cm³/min. Known: 9.0 cubic centimetres of gas collected in 3.0 minutes. Use rate = volume / time. Rate = 9.0/3.0 = 3.0 cubic centimetres per minute. This is an average rate over the collection interval.
Check the conclusion and its limits
- Moving a lamp changes light and may also change temperature.
- A photosynthesis experiment needs control of heating, not just a ruler.
Not true: All oxygen bubbles have exactly the same volume. Bubbles from pondweed vary in size and composition, so a bubble count is only a rough proxy for gas volume. Measuring collected volume, as in the calculation above, is more reliable.
- Photosynthesis transfers energy from light into chemical stores.
- Change only one factor when testing a limiting factor.
- Watch for: moving a lamp changes light and may also change temperature.
Bubbles from pondweed vary in size and composition, so a bubble count is only a rough proxy for gas volume.
Difficulty 1/5 · 100 coins + a small bonus on first completion today
True. Bubbles from pondweed vary in size and composition, so a bubble count is only a rough proxy for gas volume. Measuring collected volume, as in the calculation above, is more reliable.
A factor whose shortage restricts rate: write the technical term.
Difficulty 1/5 · 100 coins + a small bonus on first completion today
limiting factor means A factor whose shortage restricts rate.
Write from the data given
- 8.0 cubic centimetres of gas are collected in 5.0 minutes.
- Find the rate. Pondweed bubbles are not all the same volume.
8.0 cubic centimetres of gas are collected in 5.0 minutes. What is the rate, and why is a bubble count only an approximate measure?
Rate = volume/time = 8.0/5.0 = 1.6 cubic centimetres per minute. A bubble count hides differences in bubble size and composition, so it is only an approximate measure of gas production.
The SL written case collects 8.0 cubic centimetres of gas in 5.0 minutes. Find rate per minute.
Difficulty 1/5 · 100 coins + a small bonus on first completion today
8.0 divided by 5.0 is 1.6 cubic centimetres per minute. Other options — 3 cubic centimetres per minute (the lesson example's result for 9.0 cubic centimetres in 3.0 minutes); 8.0 cubic centimetres (the volume collected).
Follow matter and energy separately
- Light supplies energy; carbon dioxide supplies carbon for organic compounds. Water supplies electrons and hydrogen in oxygenic photosynthesis, and the oxygen released comes from water. Chlorophyll absorbs light without being used up as a reactant.
- The familiar equation summarizes many reactions, rather than showing one collision or the path of each atom. Plants and algae have chloroplasts; cyanobacteria also release oxygen by photosynthesis but have no chloroplasts. Some other photosynthetic bacteria do not release oxygen.
Distinguish gross production from net exchange
- A leaf can photosynthesize and respire at the same time. Invented gross oxygen production of 15 volume units per hour and oxygen consumption of 3 gives net release of 12. Zero net exchange can therefore occur while both processes continue.
- A dark measurement can estimate respiration, but using it to correct a light measurement assumes respiration is comparable in both conditions. Identify whether a graph reports gross photosynthesis, net oxygen exchange or another proxy before comparing its rates.
An invented leaf produces 15 oxygen-volume units per hour by photosynthesis and consumes 3 by respiration under the same conditions. Find net oxygen release per hour.
Difficulty 2/5 · 140 coins + a small bonus on first completion today
Net release = 15 − 3 = 12 volume units per hour. A net measurement combines simultaneous production and consumption.
Separate pigments by their interactions
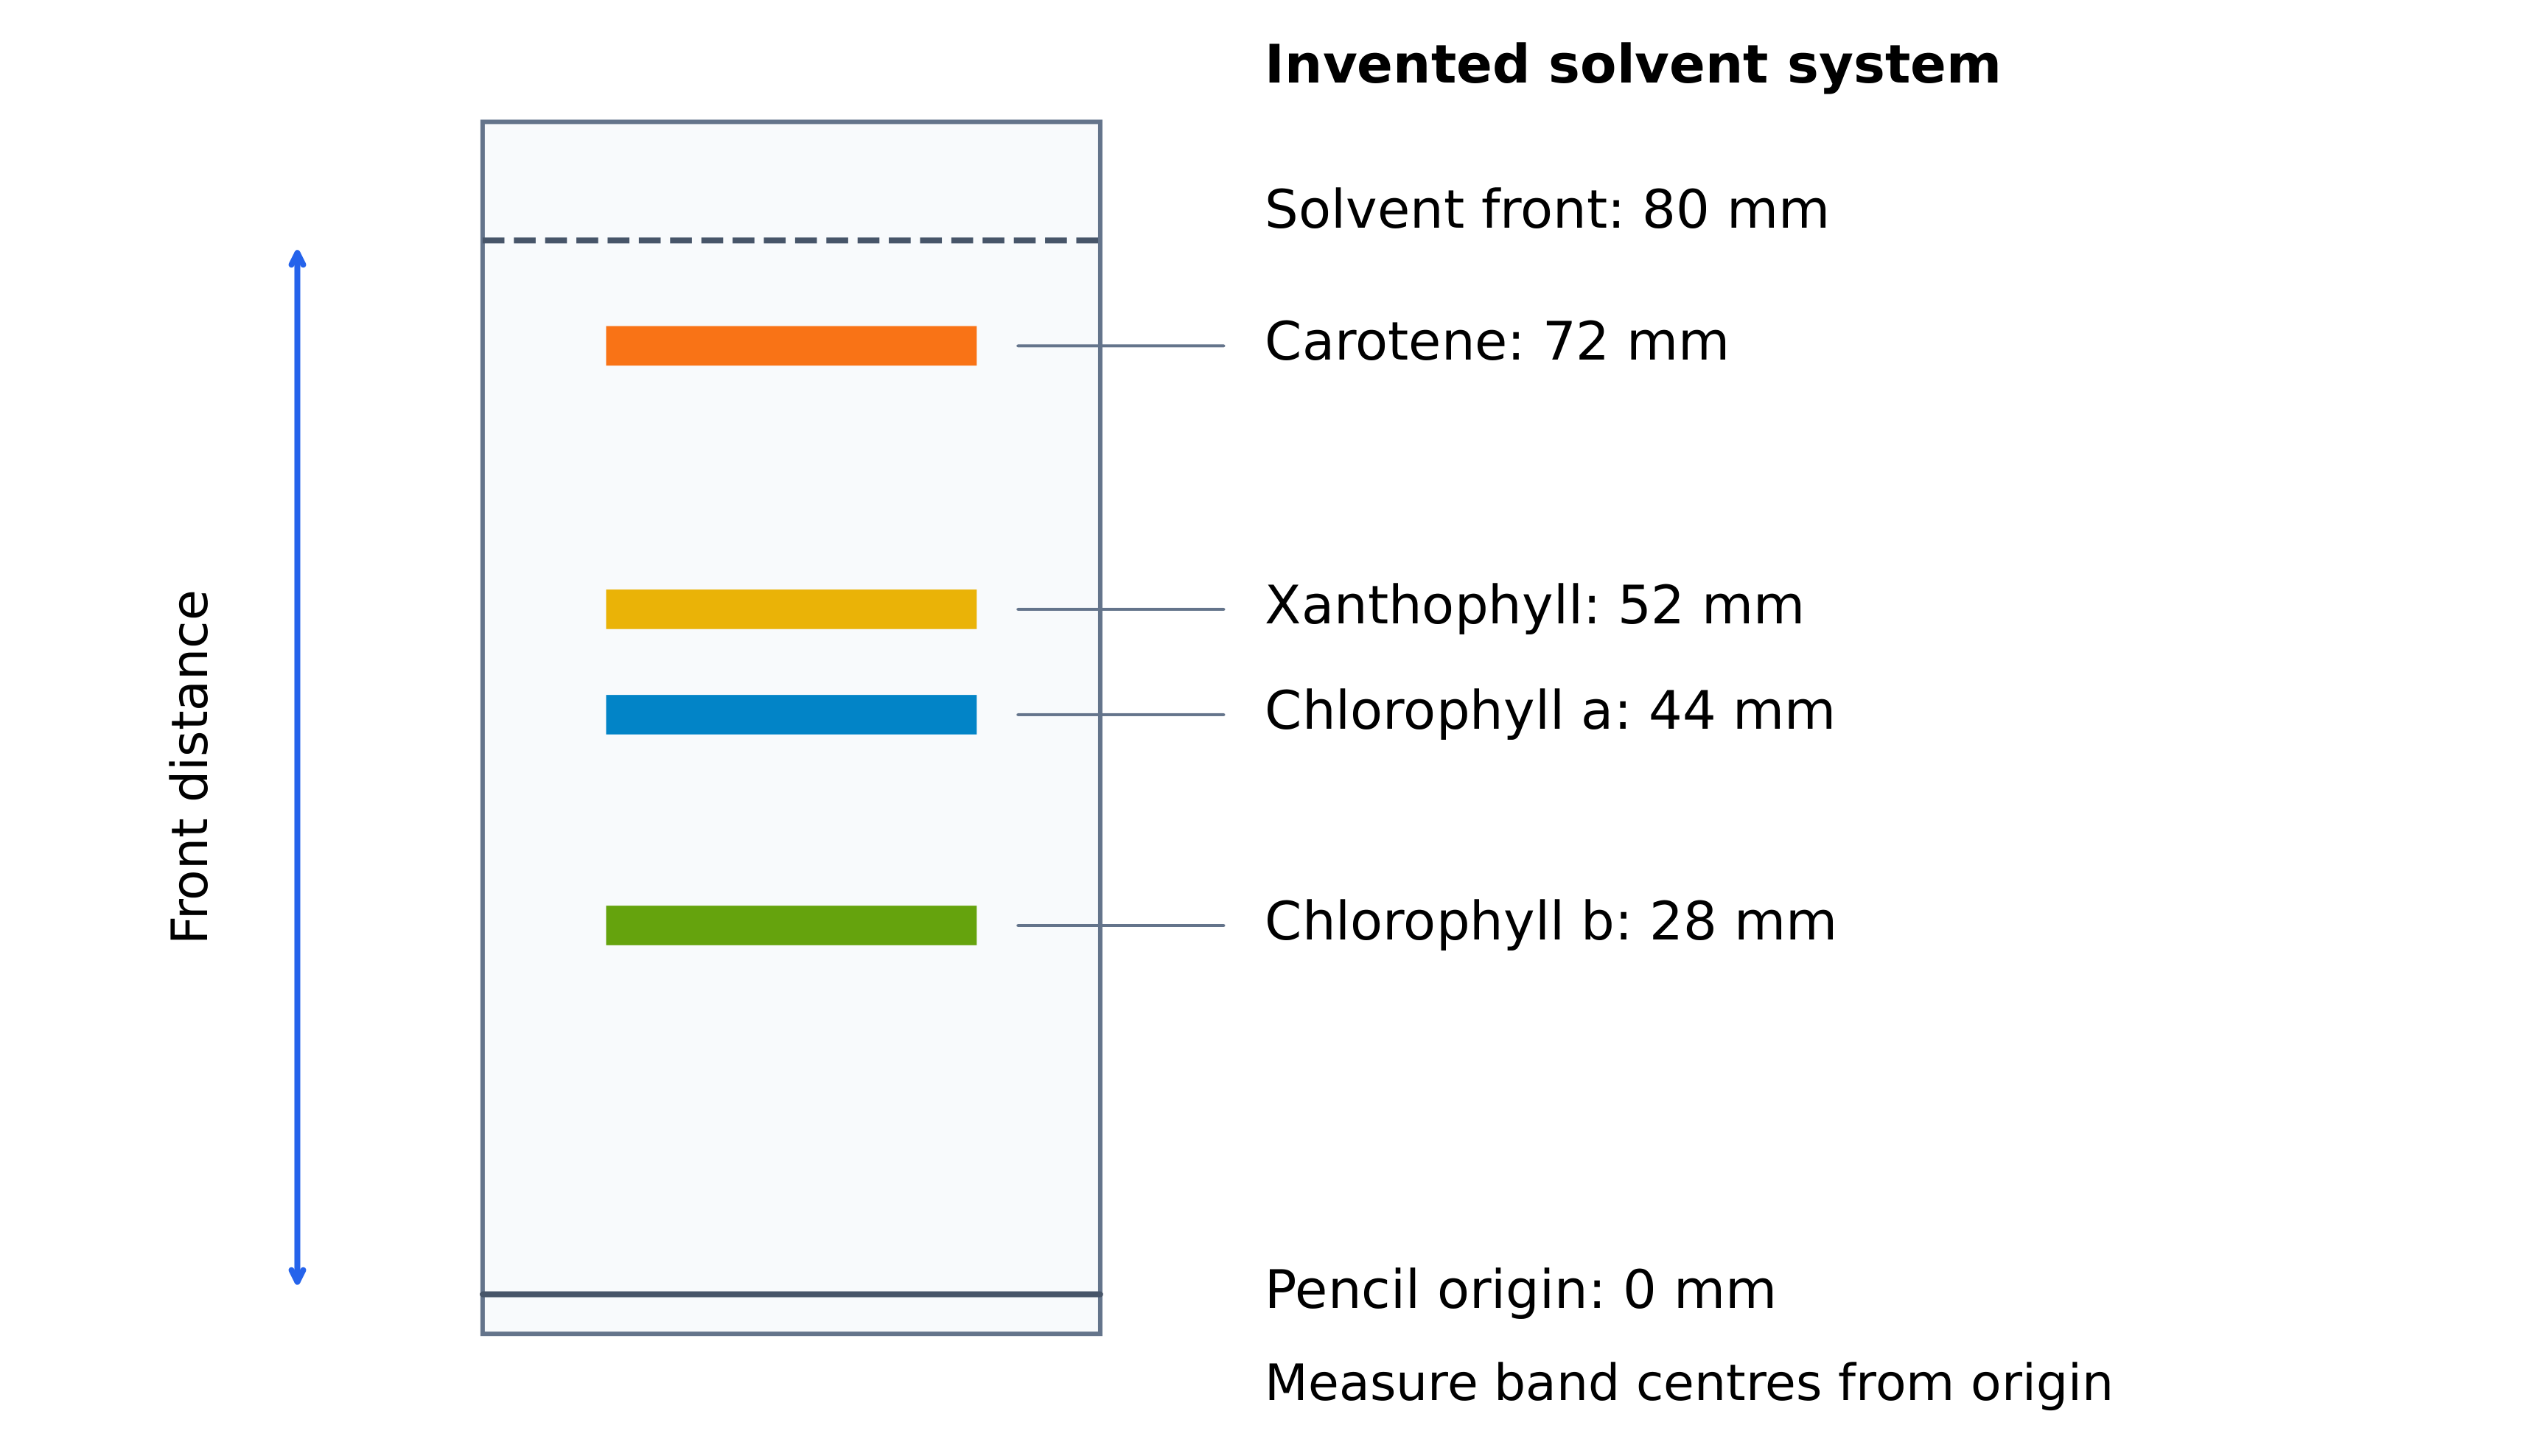
- In paper chromatography, pigments move with the solvent and interact differently with the stationary phase. Chlorophylls and accessory pigments therefore form separated bands. Draw a pencil origin above the initial solvent level, apply a small concentrated spot and mark the solvent front promptly.
- Measure from the same origin to each band's centre and to the solvent front. In this invented run, a band at 52 mm and a front at 80 mm give an Rf of 0.65. The paper's edge is not the solvent front, and the ratio has no unit.
Use chromatography as evidence, not a name label
- Other invented bands at 72, 44 and 28 mm with the same 80 mm front give Rf values 0.90, 0.55 and 0.35. A new band at 56 mm gives 0.70; it does not exactly match any of those reference values.
- Compare standards under the same solvent, stationary phase and conditions. Similar Rf values support an identification but do not prove it: different substances can move together, and changing the solvent can change separation. A missing visible band may be below the detection limit.
An invented chromatogram has a pigment centre 56 mm from the origin and a solvent front 80 mm from the same origin. Calculate Rf.
Difficulty 2/5 · 140 coins + a small bonus on first completion today
Rf = 56/80 = 0.70, with no unit. The paper edge is irrelevant, and this value does not exactly match reference bands at 0.90, 0.65, 0.55 and 0.35.
Connect absorbed light with photosynthetic action
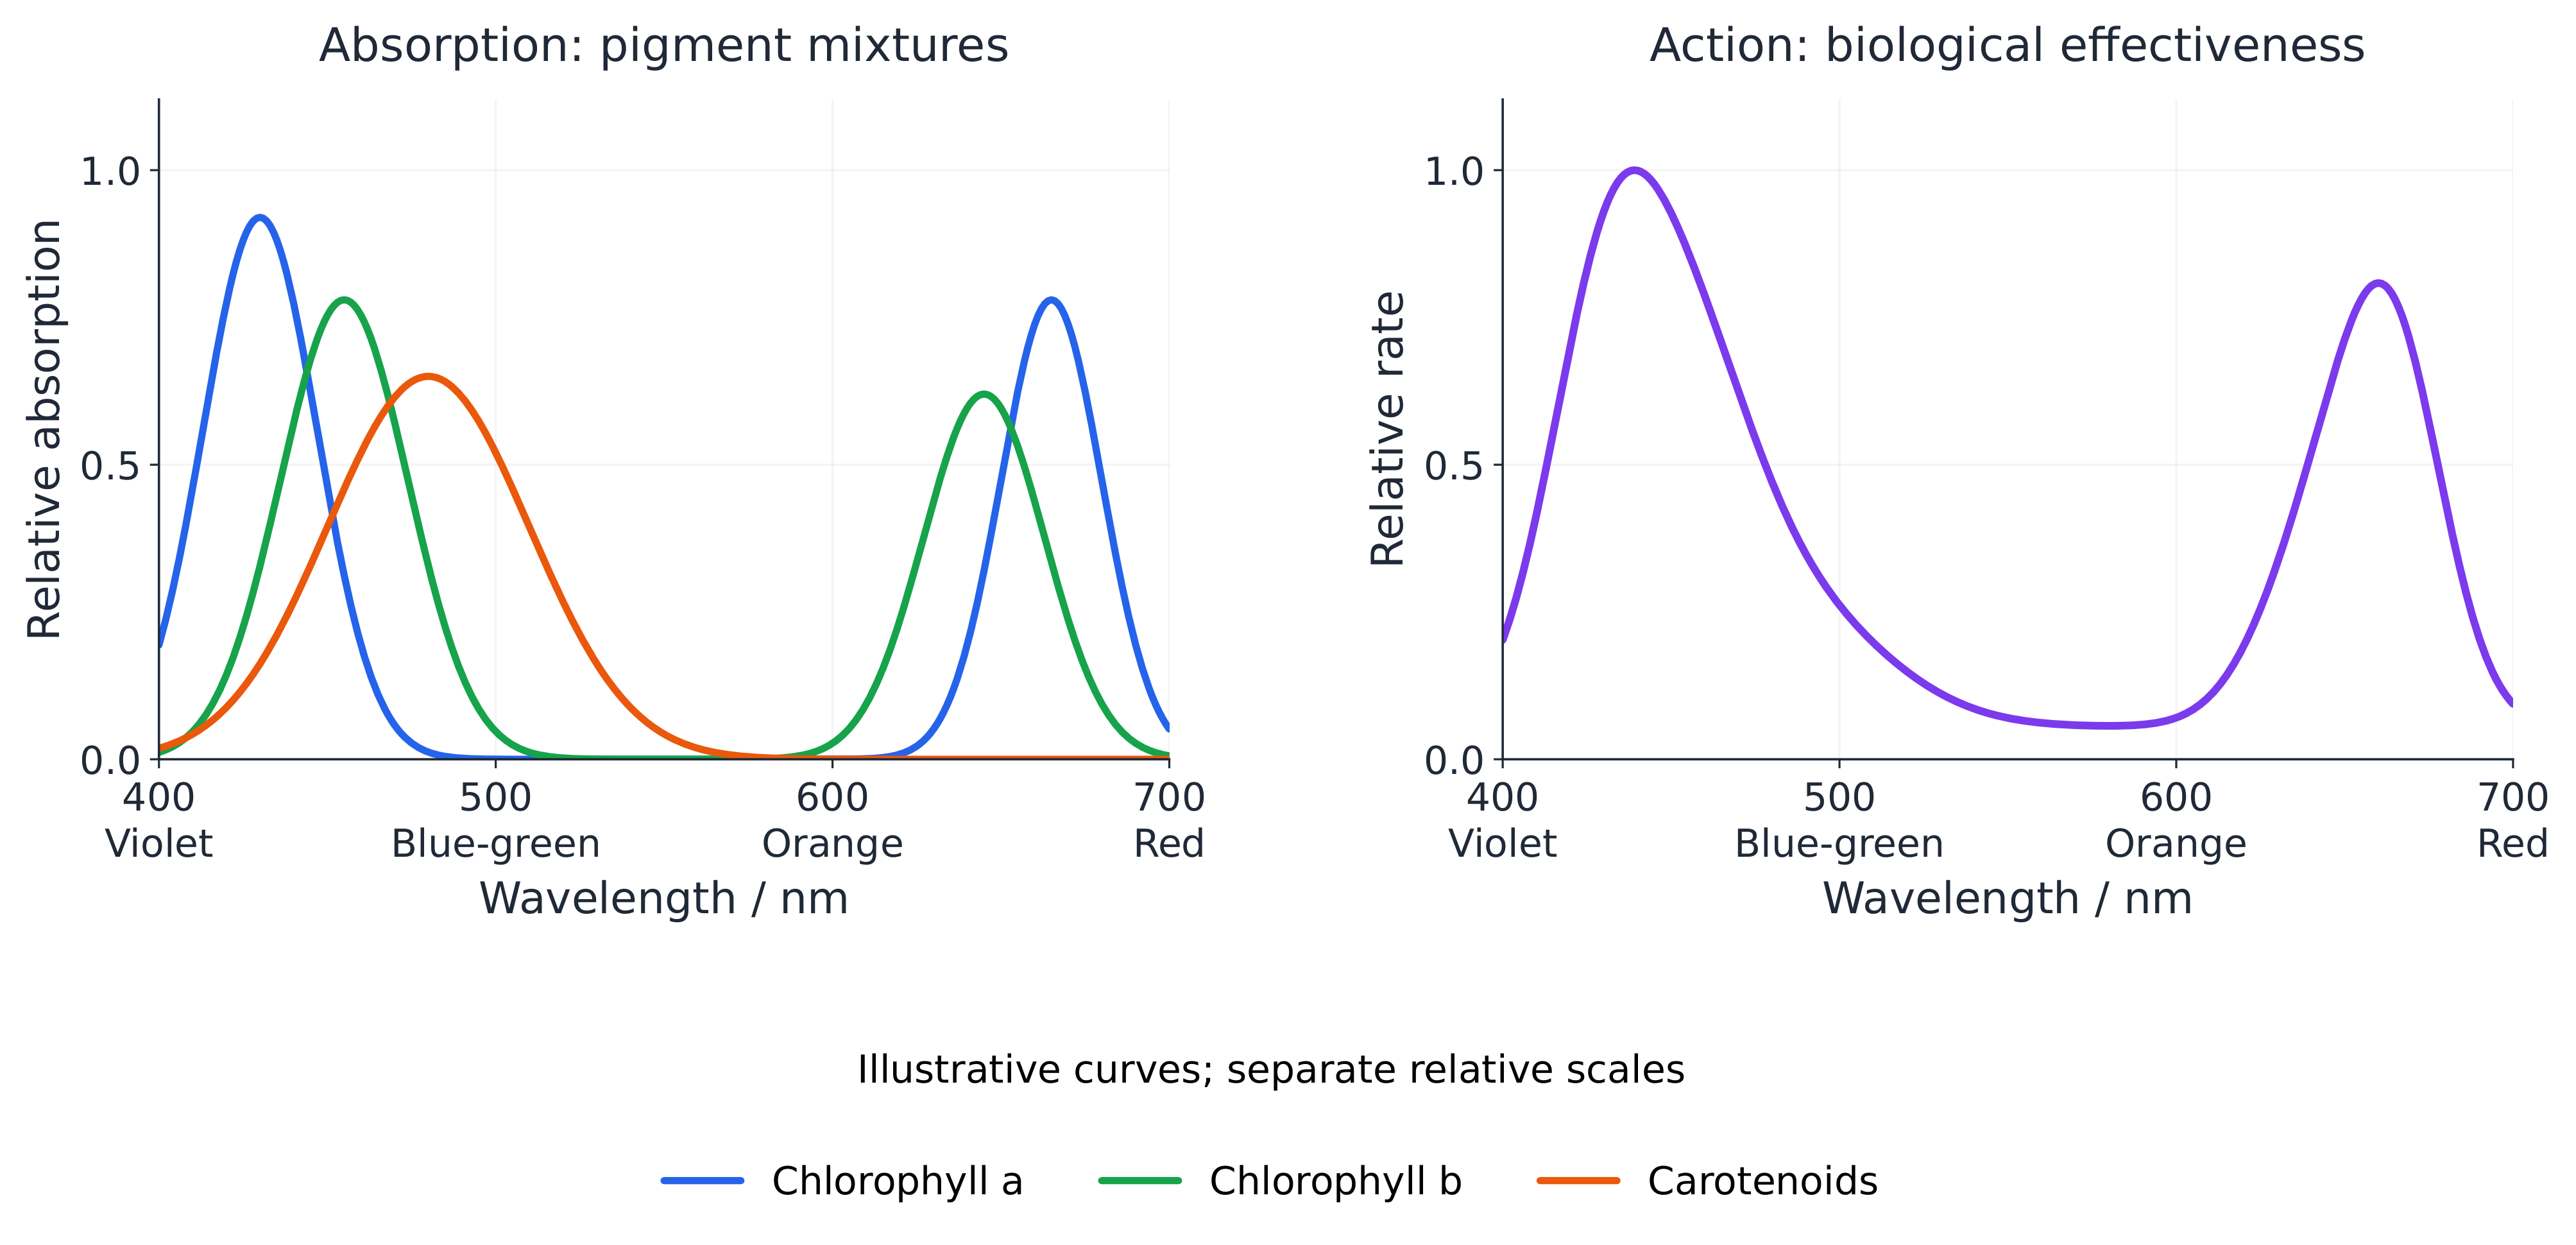
- An absorption spectrum plots how much light a pigment absorbs at each wavelength. An action spectrum plots a biological photosynthetic response. Chlorophyll absorbs strongly in parts of the blue and red regions; a green leaf reflects and transmits relatively more green light, rather than absorbing none of it.
- Accessory pigments broaden light use and can transfer excitation energy. A whole-leaf action spectrum need not match purified chlorophyll exactly: other pigments, internal scattering and other limits matter. Visible light is approximately 400–700 nm; absorption excites electrons, not atomic nuclei.
Compare wavelengths with a fair exposure
- In an invented two-minute test, equal incident photon supplies at 450, 550 and 650 nm produce 4.8, 1.2 and 3.6 cubic centimetres of net oxygen respectively. Average rates are 2.4, 0.60 and 1.8 cubic centimetres per minute. The blue treatment gives four times the green treatment's rate here.
- Keep tissue, temperature, carbon dioxide and exposure time comparable. Equal lamp power does not guarantee equal photon numbers at different wavelengths. Three tested wavelengths identify the greatest tested response, rather than locating an exact spectral peak or proving that green light is useless.
In an invented equal-photon test at 550 nm, 1.2 cubic centimetres net oxygen are collected in two minutes. Find average net collection rate.
Difficulty 2/5 · 140 coins + a small bonus on first completion today
1.2/2 = 0.60 cubic centimetres per minute. A rate must include time; this single wavelength does not identify a precise action-spectrum peak.
Read a limiting-factor plateau conditionally
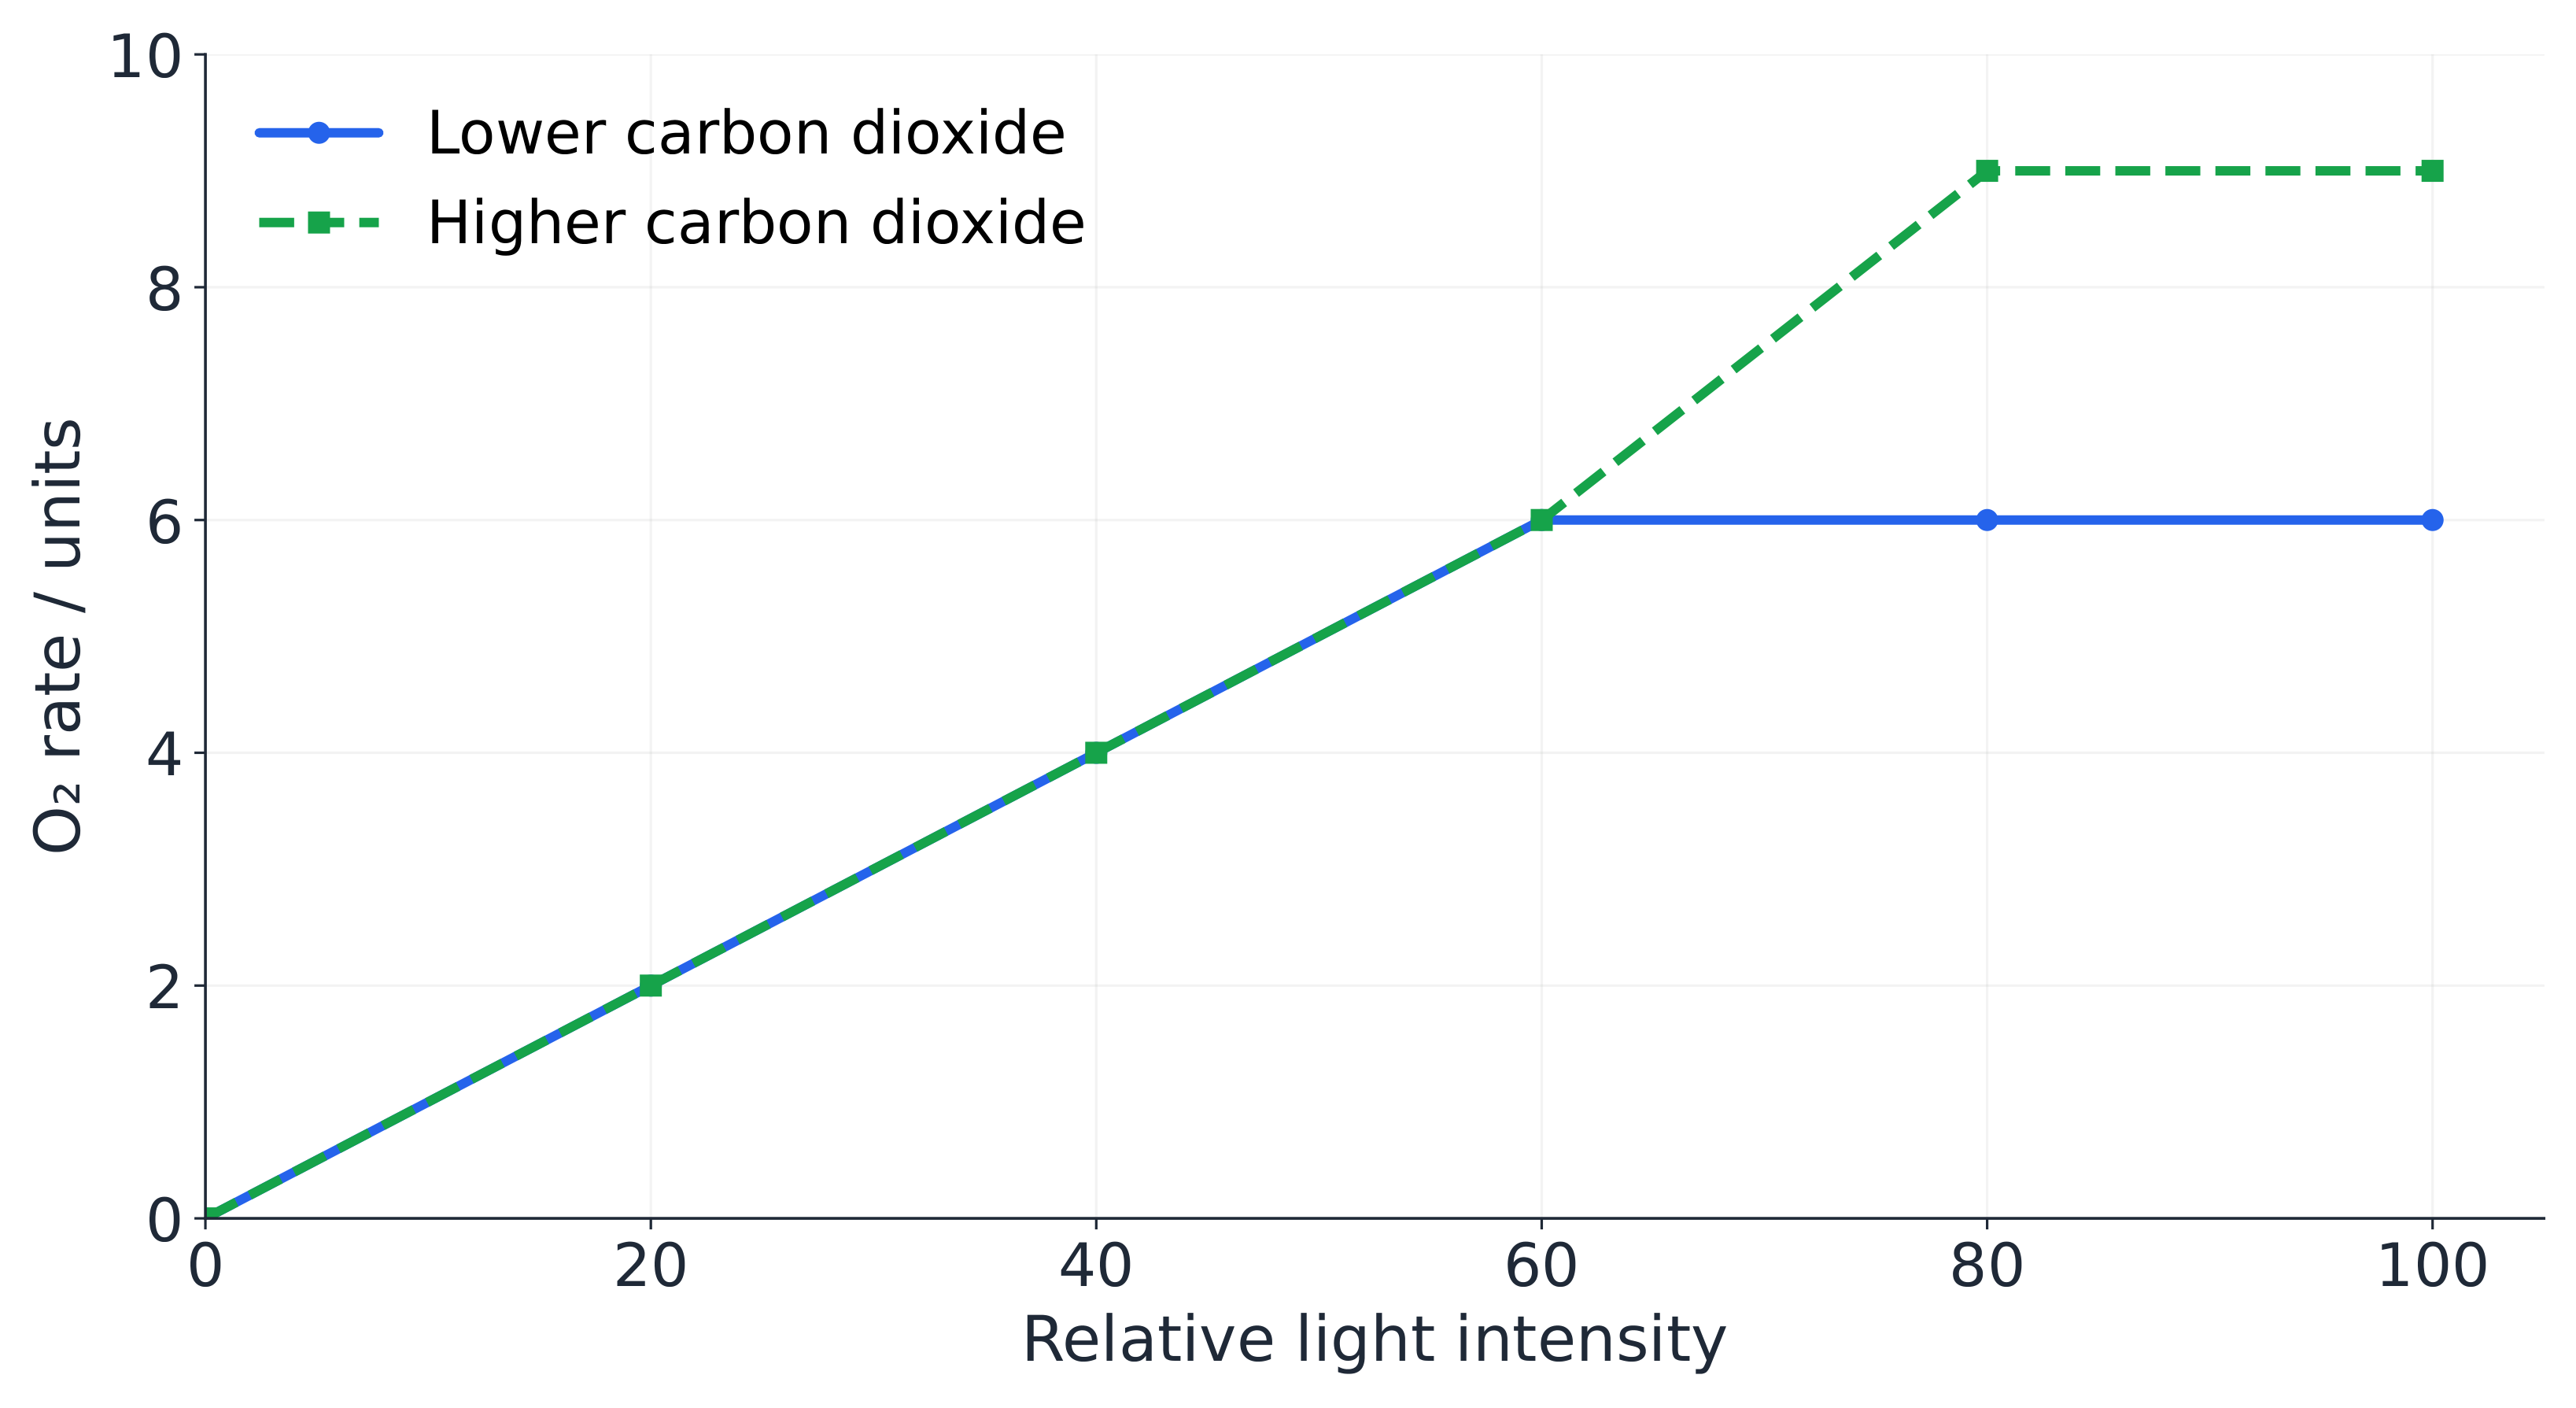
- Invented light settings of 20 and 40 units give rates of 2 and 4; settings of 80 and 100 both give 6. Extra light increases rate in the first comparison, but does not increase it in the second. The plateau alone cannot tell you whether carbon dioxide, temperature or another process restricts the rate.
- At fixed high light, raising carbon dioxide increases rate from 6 to 9: a 50% increase. This supports carbon dioxide limitation under those conditions. It does not establish the same response at low light, or show that carbon dioxide will remain limiting after every further increase.
Control what the lamp changes
- Measure light at the plant where possible. Lamp distance is a useful treatment setting, but an inverse-square model is not automatically accurate for an extended lamp, reflections and a nearby sample. Check water temperature and control heating independently.
- Keep plant species, exposed size, carbon dioxide supply and collection time comparable; allow adjustment before readings. Bicarbonate can change pH as well as carbon dioxide availability, so record or control pH. Randomize treatment order and use independent plant samples to separate treatment effects from damage or time trends.
Turn gas observations into a defensible rate
- An invented collection of 7.2 cubic centimetres over four minutes gives 1.8 cubic centimetres per minute. Bubble number alone loses information about varying bubble volume. Dissolved oxygen, leaks and the identity of collected gas also affect what collection measures.
- Use a calibrated volume method, fixed intervals and repeats, then report the spread. Repeated readings of one plant improve its measurement; they do not provide the same biological replication as independent plants. An oxygen-rate estimate is not automatically a direct measure of biomass gain.
Test carbon dioxide enrichment at crop scale
- Carbon dioxide enrichment can increase photosynthetic rate when carbon supply restricts it, but water, nutrients, temperature and light can alter the response. A short leaf measurement does not by itself establish harvest yield or long-term carbon storage.
- Free-air carbon dioxide enrichment exposes crops in outdoor experimental rings. Replicated treatment and control rings help test a field response. Many leaves sampled within one ring are subsamples, not many independently assigned carbon dioxide treatments; compare the independent experimental units.
Keep yield changes and causal claims separate
- Invented mean dry harvests of 400 and 460 grams per square metre differ by 60, a 15% increase relative to the control. This comparison needs comparable harvest area, crop stage and drying method, together with variation across independent plots or rings.
- A greater dry harvest supports a yield effect in that experiment. It does not imply every species gains 15%, or that all added carbon stays stored indefinitely. Explain the measured outcome before proposing wider benefits or trade-offs.
Invented control and enriched-carbon-dioxide plots give mean dry harvests of 400 and 460 grams per square metre. Find percentage increase relative to the control.
Difficulty 2/5 · 140 coins + a small bonus on first completion today
(460 − 400)/400 × 100 = 15%. The 60 grams per square metre difference is an absolute change, not 60%. Replication and other conditions limit the wider inference.
Design a test and qualify its conclusion
- Choose one factor, a suitable rate measure, a controlled range and independent biological replicates. Explain calibration, acclimation, heating and gas-loss controls. State what a plateau would and would not show, and distinguish net exchange from gross production.
- In a spectrum answer, name both axes and the response measured. In chromatography, show the common origin and solvent front. In a crop comparison, identify the independent treatment unit and calculate relative change from the control, rather than treating every measured leaf as a separate experiment.
Plan a pondweed light-response test and explain why a high-light plateau and a separate carbon-dioxide enrichment response answer different questions.
A graph supports a conditional claim about the tested range. A second controlled intervention can identify a candidate limitation more directly.