Adaptation: a function in an environment
Introduced| English | Meaning |
|---|---|
| adaptation/ˌædæpˈteɪʃn/ | A characteristic that helps an organism survive and reproduce in its environment. |
| acclimatization/əˌklaɪmətaɪˈzeɪʃn/ | An individual response during life and is different from evolutionary adaptation. |
What would explain this observation?
- Leaves in dry environments often have features that reduce water loss. The value of a feature depends on environmental conditions and trade-offs.
Build the model
- An adaptation 适应 is a heritable feature associated with improved survival or reproduction in particular conditions.
- A thick cuticle can reduce evaporation; stomatal control affects gas exchange and water loss.
- Acclimatization 适应过程 is an individual response during life and is different from evolutionary adaptation.
- adaptation: A heritable feature benefiting survival or reproduction in a context.
- acclimatization: An individual adjustment to changed conditions during life.

Which statement distinguishes acclimatization?
Difficulty 1/5 · 100 coins + a small bonus on first completion today
Acclimatization is a reversible physiological adjustment by an individual during its lifetime, like making more red blood cells at altitude. It changes no allele frequencies and creates no species - those are population-level evolutionary changes.
Match each technical term to its precise meaning.
Difficulty 2/5 · 140 coins + a small bonus on first completion today
Use the definitions to distinguish related quantities and processes.
Choose evidence that can test it
- Explain both a benefit and a cost.
- Reducing stomatal opening conserves water but can limit carbon dioxide entry.
- A feature cannot be judged as universally best without its ecological context.
In the lab: Compare replicated observations across a measured environmental gradient. Account for relatedness, leaf area and age. Use local permitted plant observations rather than removing protected species.
Which two habits make the investigation or model in this case more defensible?
Difficulty 2/5 · 140 coins + a small bonus on first completion today
Stating the conditions and assumptions lets others repeat the work exactly, and recording the supporting evidence lets them check the conclusion. Hiding disagreeing results removes the evidence that could challenge a wrong conclusion, and one measurement can never establish a wider claim.
Work from known quantities
- Known: water loss is 12 g from 0.20 square metres of leaf area over 2 h.
- Area-time-normalized rate = 12/(0.20 × 2) = 30 g/(m² h).
- Comparisons require the same humidity and temperature.
Your turn: Water loss is 8 g from 0.20 m² over 2 h. Calculate rate per area per hour.
Compare leaf water loss on the same area and time basis
The lesson's 12 g from 0.20 m² in 2 h gives 30 g/(m²·h). Compare a second sample losing twice as much water from twice the leaf area; then vary collection time to distinguish total loss from average rate.
Water loss is 8 g from 0.20 m² over 2 h. Calculate rate per area per hour.
Difficulty 2/5 · 140 coins + a small bonus on first completion today
The result is 20 g/(m² h). Known: water loss 8 g from 0.20 square metres over 2 h. Use rate = loss / (area x time). Rate = 8/(0.20 x 2) = 20 grams per square metre per hour. Comparisons need the same humidity and temperature.
Check the conclusion and its limits
- An individual organism does not evolve a new inherited trait because it needs it.
- A plausible story about function is a hypothesis requiring evidence.
Not true: Every useful individual response is evidence of a newly evolved inherited trait. Evolution changes heritable population characteristics across generations. One useful individual response does not by itself establish a new inherited trait: the capacity to respond may already be inherited. Test inheritance and compare generations; natural selection is one evolutionary mechanism, alongside other population processes.
- An adaptation is a heritable feature associated with improved survival or reproduction in particular conditions.
- Explain both a benefit and a cost.
- Watch for: an individual organism does not evolve a new inherited trait because it needs it.
Evolution changes heritable population characteristics across generations.
Difficulty 1/5 · 100 coins + a small bonus on first completion today
True. Evolution changes heritable population characteristics across generations. One useful individual response does not by itself establish a new inherited trait: the capacity to respond may already be inherited. Test inheritance and compare generations; natural selection is one evolutionary mechanism, alongside other population processes.
A heritable feature benefiting survival or reproduction in a context: write the technical term.
Difficulty 1/5 · 100 coins + a small bonus on first completion today
adaptation means A heritable feature benefiting survival or reproduction in a context.
Write from a rate and an inheritance question
- In the SL written case, water loss is 9 g from 0.30 square metres over 3 hours. Divide by area and time: $9/(0.30\times3)=10$ grams per square metre per hour. This differs from the earlier 8 g, 0.20 square metre, 2 hour case, which gives 20. A rate comparison must keep the measured quantity and denominator clear.
- This route develops A4.1 Evolution and speciation. All new numerical populations, chromosome models and letter-labelled examples are invented. Distinguish an individual's useful response, a population's inherited change and a lineage splitting into species. A functional explanation should connect a feature to evidence of its consequences, rather than assuming every useful-looking feature evolved for a stated purpose.
Water loss is 9 g from 0.30 square metres over 3 hours. What is the rate per square metre per hour, and why is one useful individual response not automatically a new inherited trait?
Rate = loss / (area × time) = 9/(0.30 × 3). The denominator is 0.90 square metre hours, so the rate is 10 grams per square metre per hour. A temporary useful response is not automatically an inherited evolutionary change.
The SL written case loses 9 g water from 0.30 square metres over 3 h. Find rate per area per hour.
Difficulty 1/5 · 100 coins + a small bonus on first completion today
9/(0.30 × 3) = 10 grams per square metre per hour. This useful measurement alone does not demonstrate a newly evolved inherited trait.
Separate evolutionary adaptation from an individual's adjustment
- Evolution changes heritable population characteristics across generations. Acclimatization changes an individual's physiology during its lifetime. A plant closing stomata on one dry afternoon does not by itself show a newly evolved allele. The capacity for regulated stomatal responses can nevertheless have an inherited basis; distinguish that capacity from the particular response observed at one moment.
- A thick cuticle may reduce water loss, while reduced stomatal opening can also limit carbon dioxide entry and photosynthesis. An adaptation's value depends on conditions and trade-offs. To test an inheritance claim, compare offspring under controlled common conditions and use appropriate genetic evidence. One useful physiological response or correlation with a dry habitat does not establish the complete evolutionary explanation.
Link heritable variation to reproductive success
- Natural selection can change a population when individuals vary, relevant variation is inherited and variants differ in reproductive success. Mutations do not arise because organisms know what they need. Inheritance transmits variants and selection changes their representation under particular conditions. Chance and other population processes also contribute to evolution, so not every population change is an adaptation.
- In an invented model, 100 inherited form A and 100 form B individuals are followed by 300 A and 100 B offspring. Assume faithful inheritance, no migration or mutation and non-overlapping generations. A rises from $100/200=50\%$ to $300/400=75\%$: 25 percentage points, or a 50% relative increase in frequency. Individuals of B have not deliberately transformed into A.
In an invented inherited-form model, the next generation has 300 form A and 100 form B offspring. What percentage are A?
Difficulty 2/5 · 140 coins + a small bonus on first completion today
300/(300 + 100) × 100 = 75%. The starting proportion was 100/200 = 50%; that is a rise of 25 percentage points and a 50% relative frequency increase under the stated model.
Use corresponding molecular sequences as evidence
- Compare homologous genes or proteins and align equivalent positions. Shared complex sequence patterns and the broadly conserved genetic code support common ancestry more strongly than merely observing that both samples contain four DNA bases. Test a proposed relationship with additional independent genes and anatomical or developmental evidence.
- In an invented alignment, 6 differences among 40 sites gives 15% difference and 85% matching sites. These are percentages for that selected region, not automatically whole-genome values or a divergence date. Repeated substitutions, rates, sampling and gene history matter. Modern species at tips of a tree share ancestors rather than one necessarily being the other's direct ancestor.
Two invented aligned sequences have 6 differing positions among 40. What percentage of these positions match?
Difficulty 2/5 · 140 coins + a small bonus on first completion today
34 of 40 match, so 34/40 × 100 = 85%; 15% differ. This is the selected alignment, not automatically a whole-genome comparison or a date.
Explain what artificial selection demonstrates
- Artificial selection occurs when people choose breeding individuals according to desired inherited characteristics. Repeated selection, inheritance and available variation can change a population over generations, as seen in crop varieties and dog breeds. Training or modifying a parent's body does not by itself establish that the change will be transmitted as the same inherited form in offspring.
- Compare offspring in appropriate common conditions when environmental effects may influence the trait. Artificial selection demonstrates heritable population change, but does not reproduce every historical event. Natural selection has no breeder choosing a final goal: environmental conditions affect which variants leave more descendants. Different conditions can favour different outcomes from the same available variation.
Identify homologous structures by an inherited plan
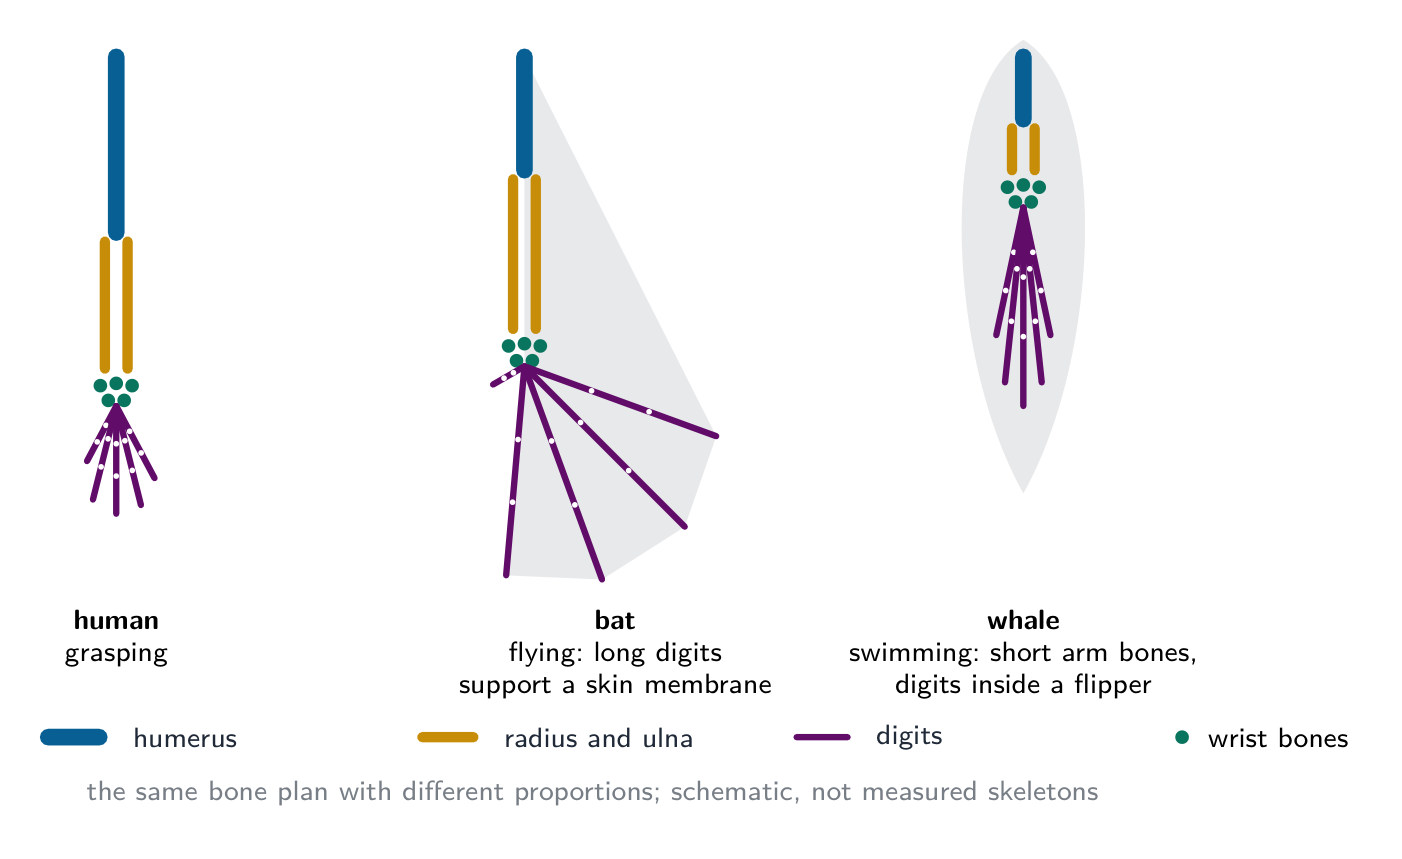
- Homologous structures derive from corresponding structures in a common ancestor, even when their functions differ. A tetrapod forelimb comparison can identify humerus, radius and ulna, wrist bones and digits. Their relative arrangement and development matter more than identical length. Descendants may reduce, fuse or lose parts, so not every modern limb displays five equally visible digits.
- A flipper and a human arm can share an inherited forelimb plan while supporting different functions. Generalized diagrams show relationships rather than measured skeletons of named species. Combine anatomical, developmental and molecular evidence. The interpretation concerns descent with modification in both lineages, not one living species' limb changing directly into a different modern species' limb.
Specify the level when comparing analogous features
- Analogous functional features arose independently. Bird wings and insect wings both support flight, but insect wings are not bony vertebrate forelimbs. Similar selection pressures can favour different structural solutions. Convergence therefore explains why functional resemblance need not identify the closest common ancestry.
- Bird and bat forelimb bones are homologous as tetrapod forelimbs, while powered flight and their flight surfaces evolved separately. Birds use feathers; bats use a skin membrane supported largely by elongated digits. State the structure and comparison level before applying the label. Likewise, a streamlined dolphin and shark outline does not outweigh evidence connecting dolphins with other mammals.
Which comparison specifies the structural level correctly?
Difficulty 1/5 · 100 coins + a small bonus on first completion today
The tetrapod forelimb plan is inherited, while bird feathers and bat wing membranes form different flight surfaces. State the structure and level of comparison rather than equating function with ancestry.
Distinguish change within a lineage from a split
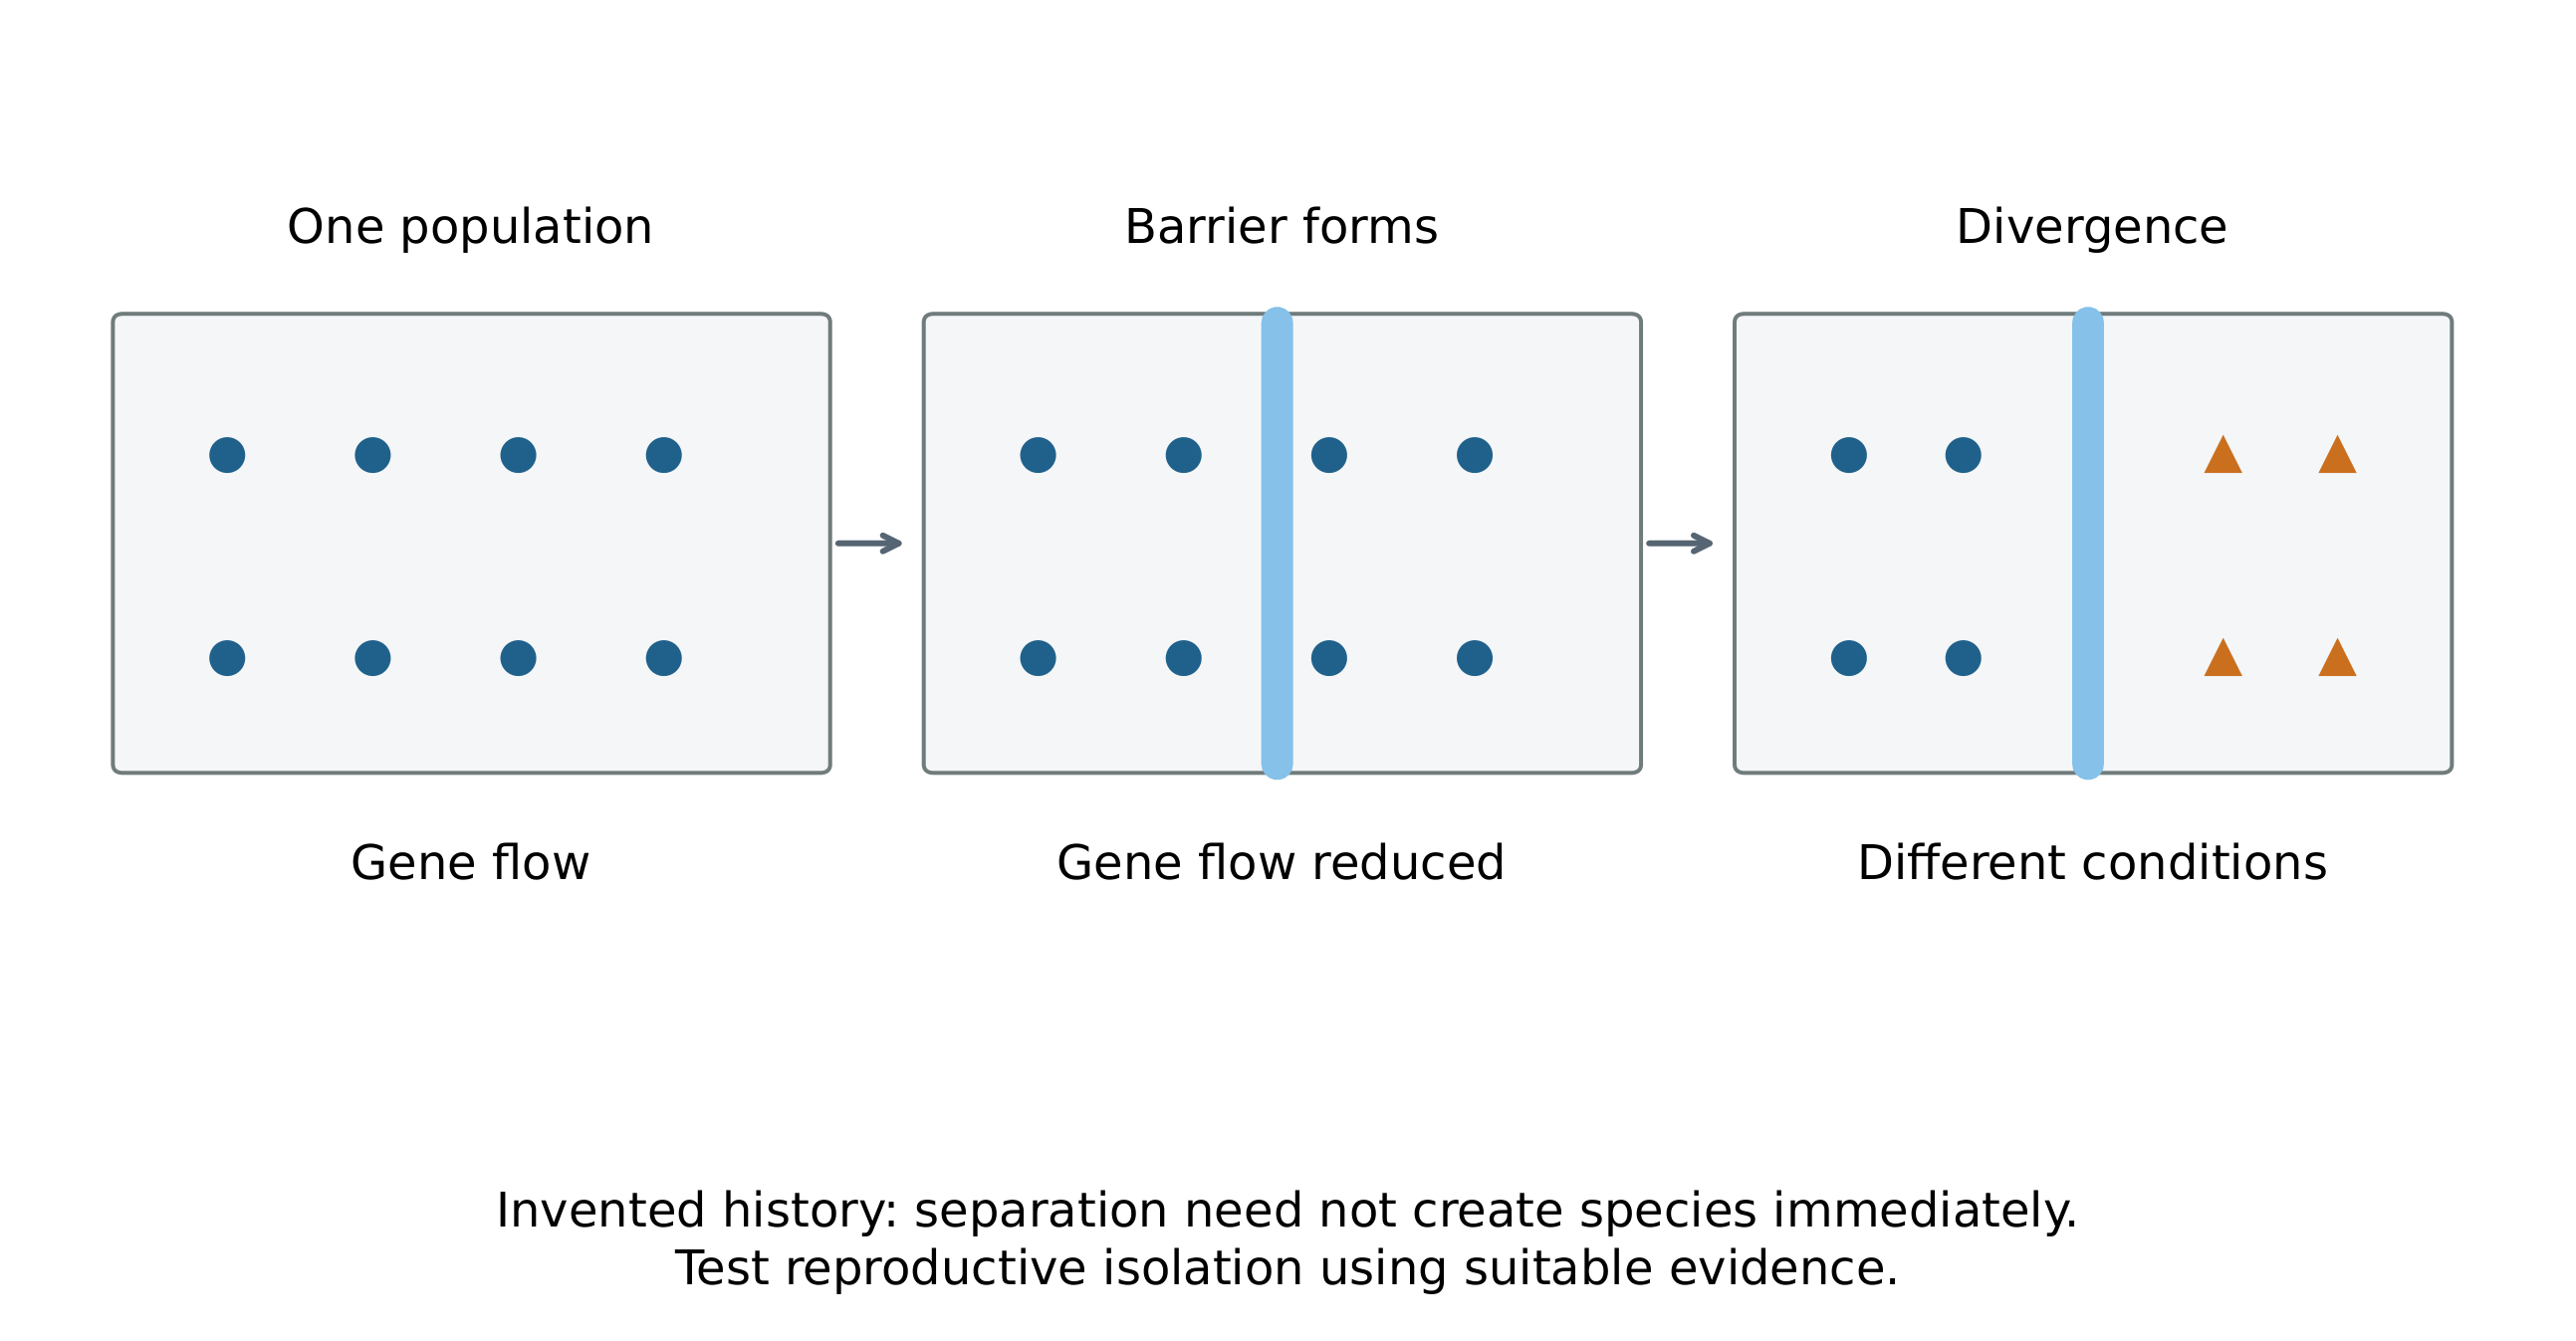
- A population can evolve substantially without dividing into two species. Speciation is splitting from pre-existing lineages; extinction reduces species number. Within the biological species framework, reduced gene flow and reproductive isolation allow populations to maintain differences. A geographical barrier can reduce contact, but does not instantly establish incompatible mating or sterile offspring.
- Mutation, selection and chance processes can then produce divergence. Different environments may favour different inherited variants, while changes in breeding time, mating signals or compatibility further reduce gene flow. If populations meet again, mating and offspring viability and fertility help test isolation. Different appearance alone does not resolve whether speciation has occurred.
Read the chimpanzee–bonobo example with its historical limits
- Common chimpanzees and bonobos share ancestral populations. The Congo River is an important geographical barrier across much of their present ranges, illustrating how reduced gene flow allows divergence under different conditions. This supplies a real context for an allopatric explanation, without implying that one modern species chose to become the other.
- The Sanger Institute's genome-study account also reports ancient gene flow after the main separation. The history therefore involves more than observing today's river and assuming a perfectly impermeable boundary at every earlier time. Molecular data, geography and traits test different parts of the explanation; occasional exchange need not erase every species distinction.
Normalize a functional measurement before comparing plants
- Invented sample A loses 12 g from $0.20\ \mathrm{m}^2$ over 2 h; B loses 8 g from the same area over the same duration. Area-time-normalized rates are $12/(0.20\times2)=30$ and $8/(0.20\times2)=20$ grams per square metre per hour. B is about 33.3% lower relative to A, using $(30-20)/30\times100$.
- Control humidity, temperature, airflow, light, leaf age and water supply, and replicate across independent plants. Several readings from one leaf do not independently sample many plant genotypes. An environmental gradient can reveal an association while multiple conditions covary. The result tests water loss under stated conditions; inheritance and reproductive consequences need additional evidence for an evolutionary adaptation claim.
An invented sample loses 8 g water from 0.20 square metres over 2 h. Find its area-time-normalized water-loss rate.
Difficulty 2/5 · 140 coins + a small bonus on first completion today
8/(0.20 × 2) = 20 grams per square metre per hour. Relative to A’s 30, this is about 33.3% lower, but inherited adaptation requires additional evidence.
Design a test that distinguishes competing explanations
- Suppose two populations differ in leaf thickness. Growing their offspring in a common environment helps test whether the difference persists beyond the original growth conditions. Reciprocal growth environments can reveal whether performance depends on local conditions. Record relatedness, development and the measurement method rather than attributing every persistent difference automatically to one gene or one selective pressure.
- A stronger adaptive account connects inherited variation to a relevant performance difference and then to survival or reproduction. Lower water loss alone does not establish higher overall fitness if carbon uptake or another limiting process falls. Appropriate observations and experiments can test the proposed trade-off without removing protected organisms or presenting invented results as measurements from local species.
Explain the cause, population and evidence precisely
- A complete natural-selection explanation identifies initial variation, inheritance, the environmental pressure and differential reproductive success, followed by a population change across generations. Use the original denominator when calculating relative change, and distinguish percentage points from percentages. A statement that organisms “needed to adapt” does not supply those causal steps.
- For speciation, explain how gene flow was reduced and how a distinct lineage persisted. For homology, specify the corresponding structure; for convergence, specify the independently evolved function. State which observations support the explanation and which further evidence would test inheritance, isolation or a proposed fitness benefit. The environmental context is part of the argument, not an optional final sentence.
Two plant populations differ in leaf thickness and water loss. Explain how to test an evolutionary adaptation claim rather than only a useful response in one environment.
A strong adaptive explanation links inherited variation, functional consequences and differential reproductive success.
Describe a habitat at the scale of the question
- A habitat is the place an organism, population, species or community lives. “A coastal dune in northwest Europe” describes a region and ecosystem; exposed seaward sand versus a sheltered interior distinguishes microhabitats. An ecosystem additionally includes communities and their interactions with the physical environment.
- Abiotic conditions include light, temperature, water, pH, salinity and oxygen. Biotic influences include neighbours, food organisms and predators. A neighbouring plant is biotic but its shade changes an abiotic light environment. Identify both the cause and the variable measured rather than assigning one cause from a habitat name alone.
Explain marram through water balance and unstable sand
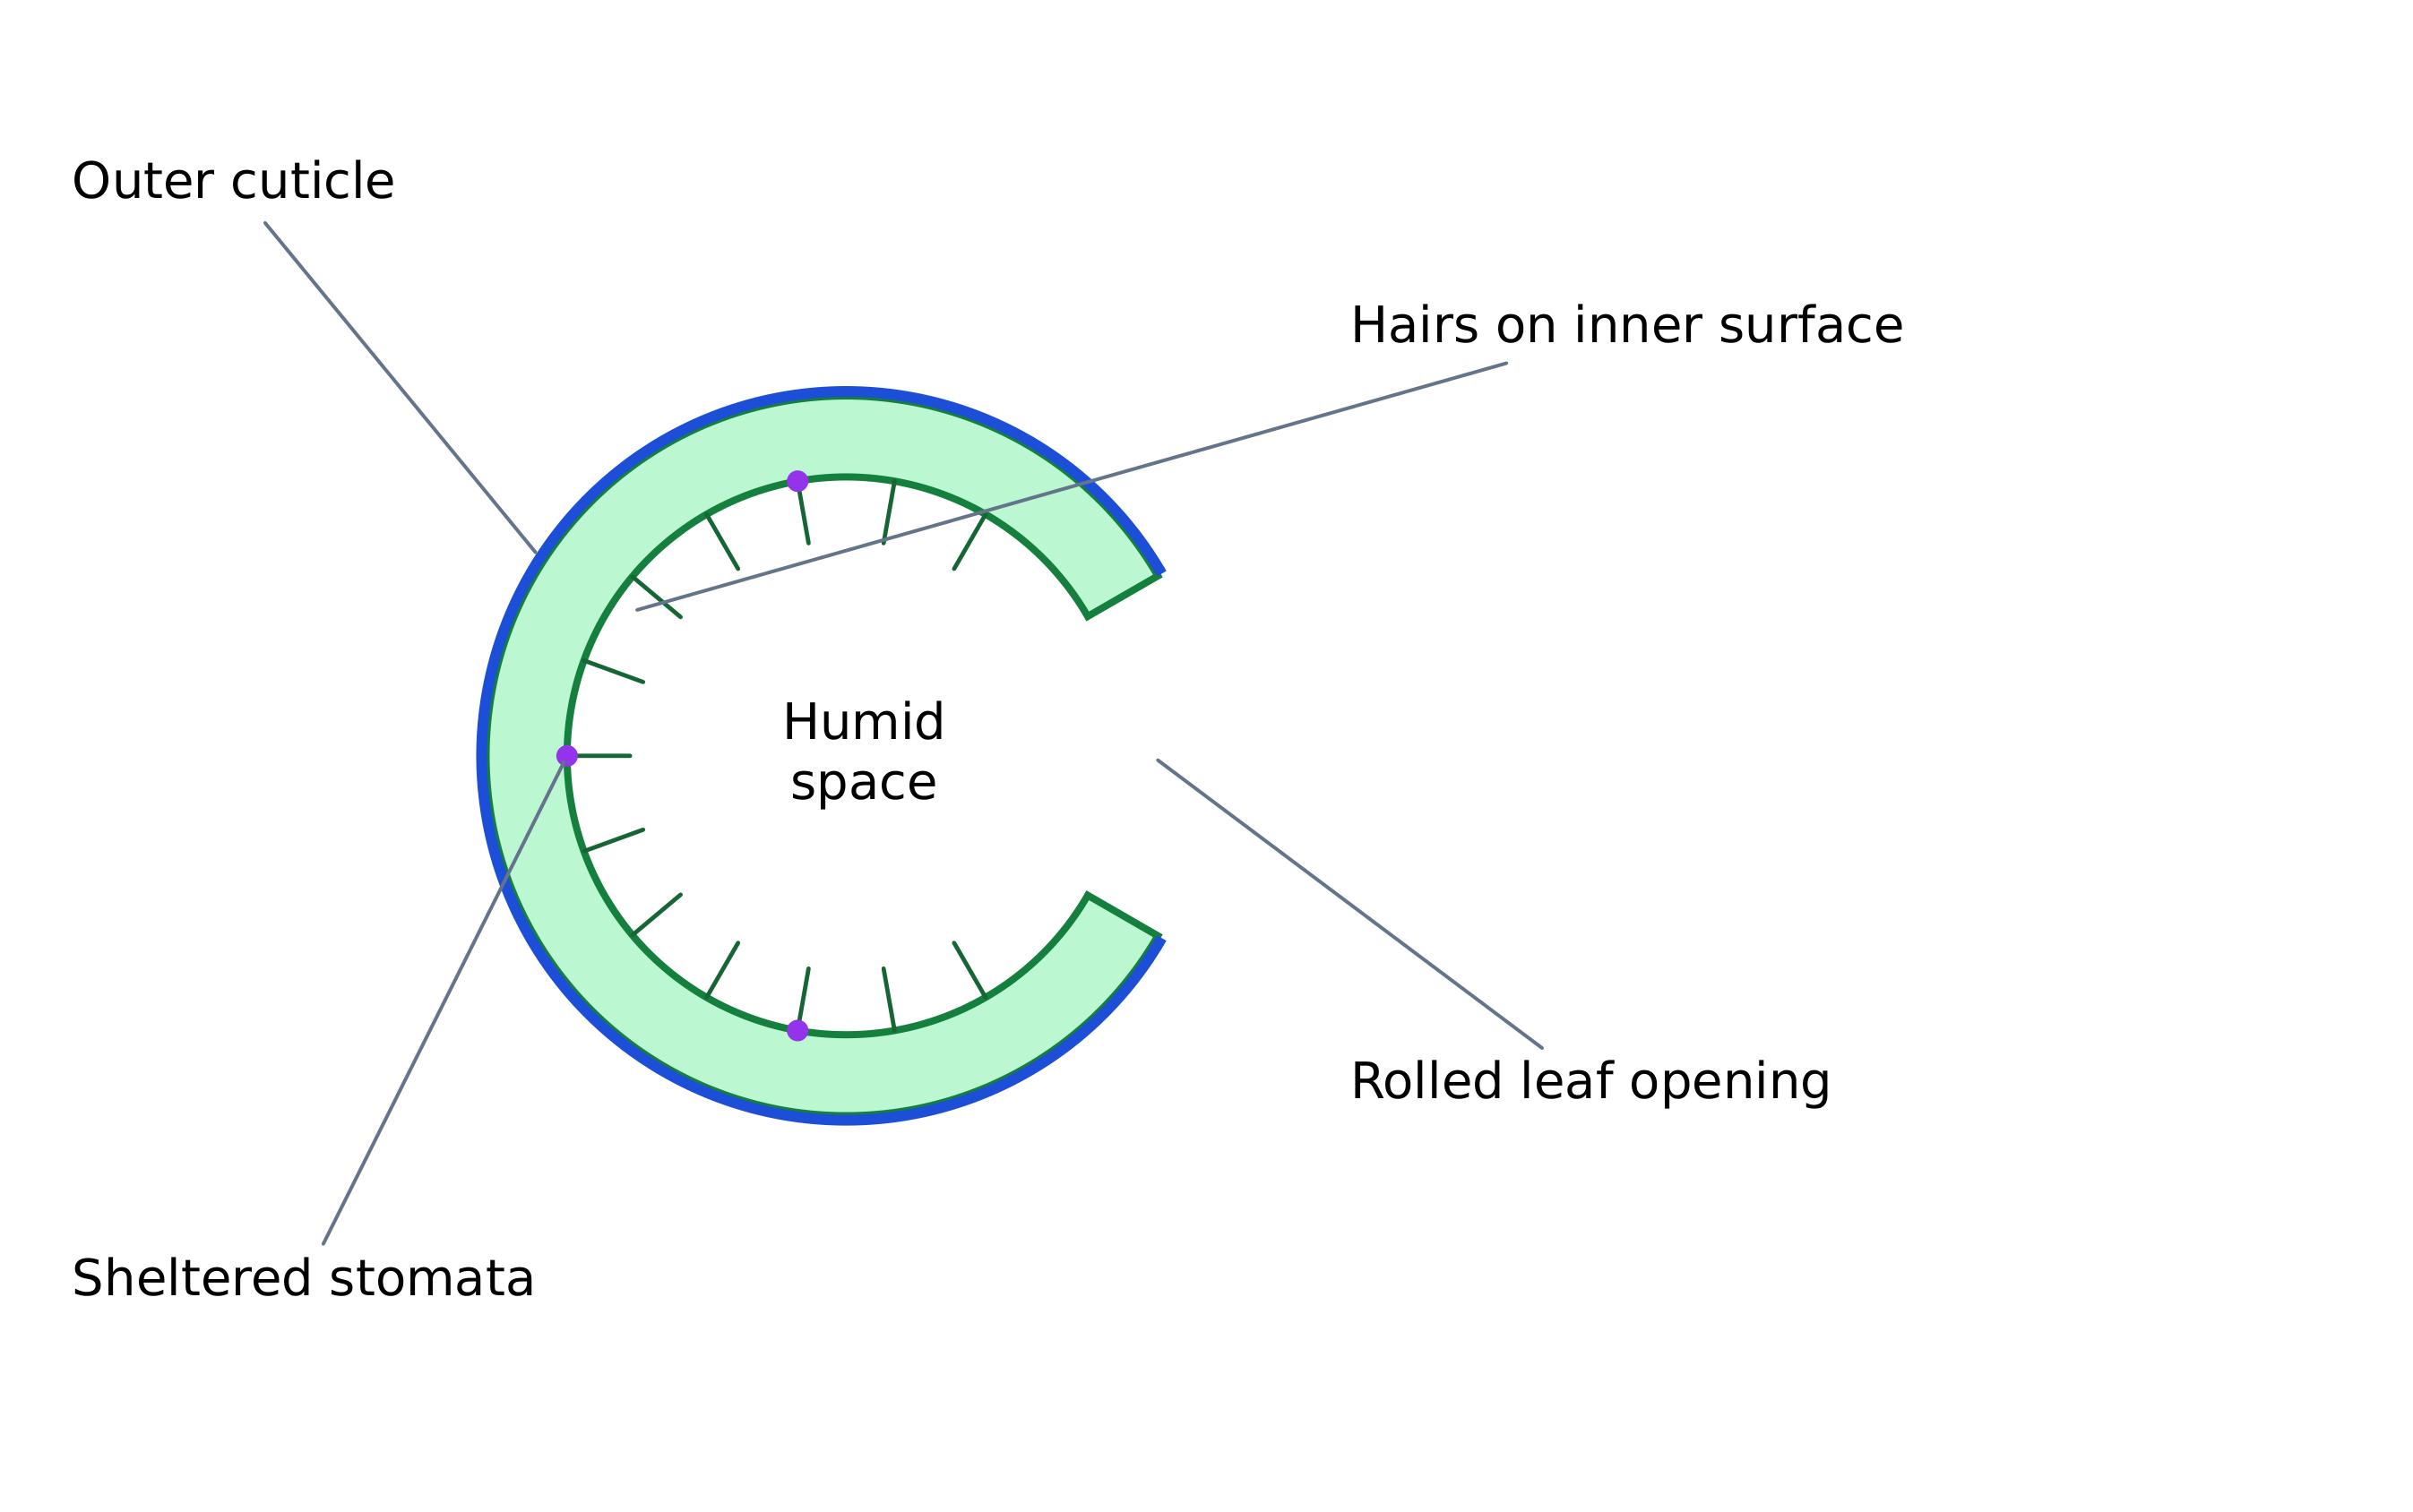
- Marram grass, Ammophila arenaria, grows on draining, windy, shifting dunes. Rolling its leaf shelters the stomatal surface; hairs and grooves retain humid air, reducing air movement and the water-vapour gradient near stomata. A cuticle limits surface loss. Rolling does not remove stomata or prevent all transpiration.
- Rhizomes anchor and spread the plant and support new shoots as sand accumulates. Restricted gas exchange can conserve water while limiting carbon dioxide entry and growth. The inherited capacity to respond is an adaptation; one plant rolling during a dry afternoon is a physiological response, not a new evolutionary change acquired that day.
Separate mangrove salinity from root oxygen shortage
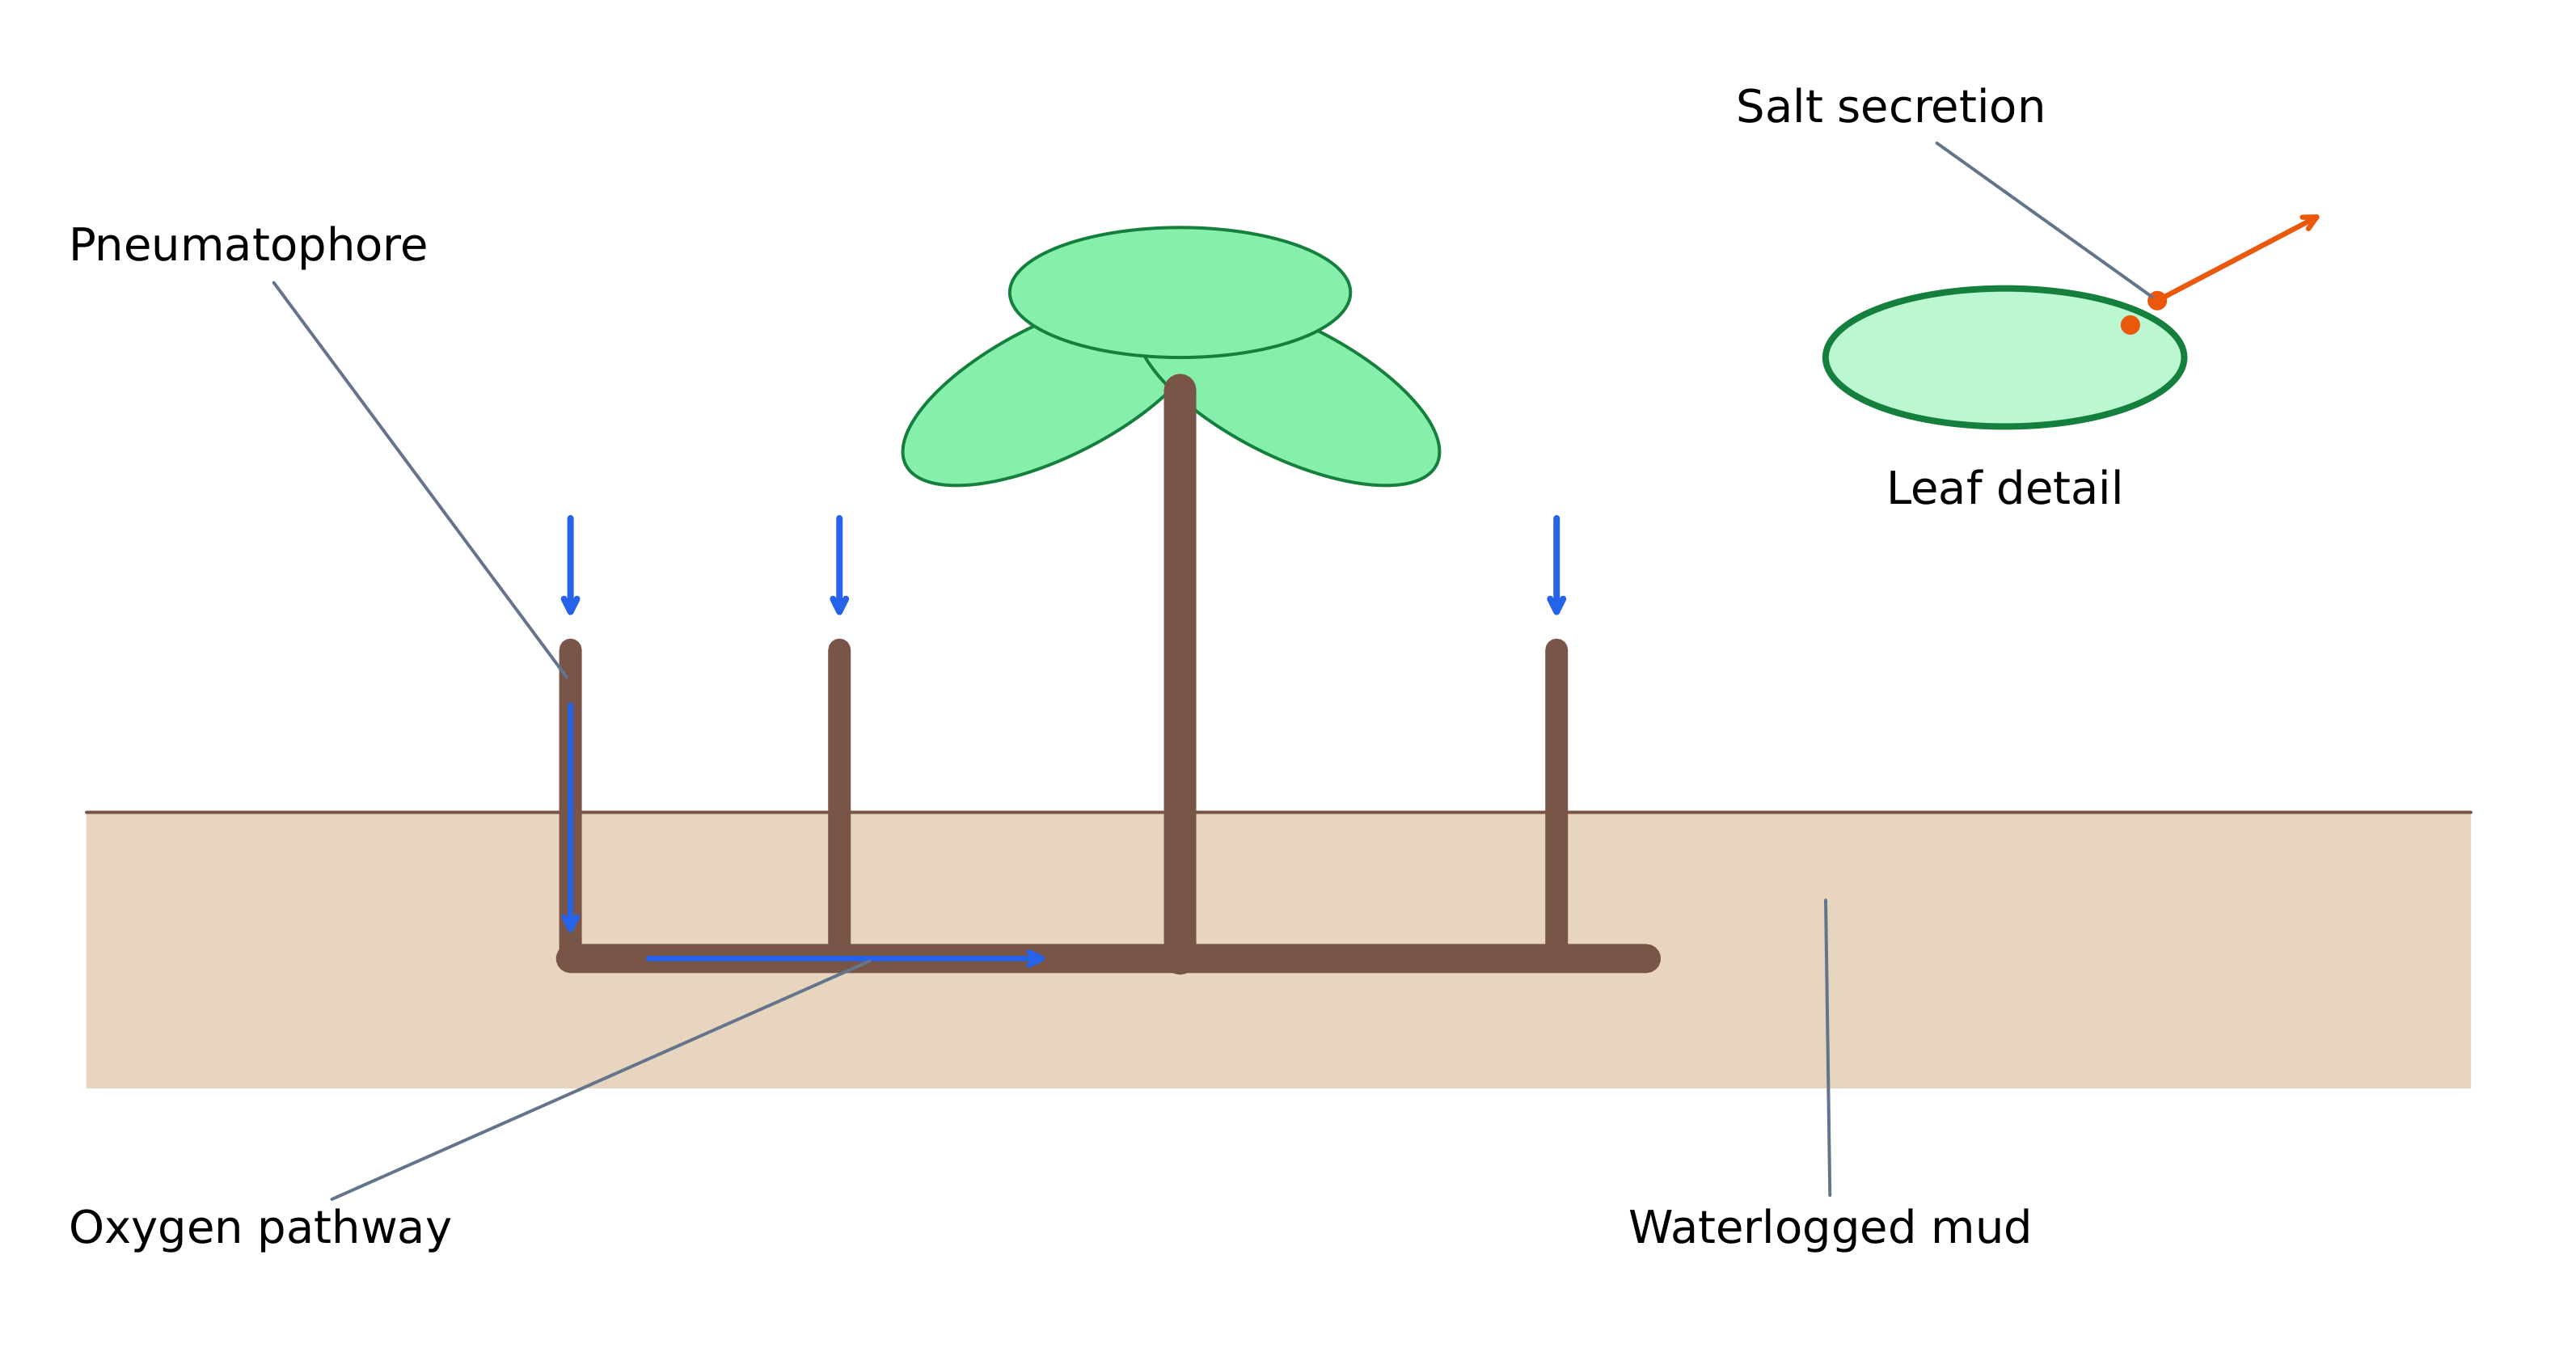
- Grey mangrove, Avicennia marina, lives in saline intertidal habitats. Salt lowers external water potential, while waterlogged mud restricts oxygen supply. NParks describes its shallow lateral roots and upright pneumatophores: exposed surfaces permit atmospheric oxygen entry and transfer through connected internal air spaces to submerged tissues.
- Root salt exclusion limits entry, and leaf glands remove some salt that enters, as illustrated by the Smithsonian account. These are different mechanisms from aeration. Tides can restrict air access; salt handling has costs and limits. Do not give every mangrove species identical roots or assume wet salty ground eliminates the challenge of water uptake.
Which separates two challenges for grey mangrove, Avicennia marina?
Difficulty 1/5 · 100 coins + a small bonus on first completion today
Water balance and oxygen supply need separate mechanisms. Exposed breathing-root surfaces permit gas entry, while selective exclusion and secretion contribute to salt management, with costs and limits.
Distinguish tolerance from observed distribution
- A tolerance range concerns conditions permitting a specified function, such as survival or reproduction. Brief adult survival can occur where successful reproduction cannot. A limiting factor restricts performance under the circumstances even if other requirements are suitable; salinity can constrain water uptake despite visibly wet soil.
- Field absence need not prove physiological intolerance: dispersal, competitors, predators or disturbance history can explain it. Temperature and dissolved oxygen can also covary in water. A brown trout's distribution therefore needs more than one temperature measurement; compare oxygen supply, demand, life stage and other conditions before assigning a single cause.
Design a transect across a measured gradient
- In a permitted natural or semi-natural habitat, place transects across the stated gradient with fixed intervals or a justified stratified design. Use equal quadrat areas, consistent identification and counting, and measure the abiotic variable at each position. Independent transects provide different replication from many adjacent quadrats along one line.
- Calibrate a pH sensor and standardize preparation, depth and timing. Record moisture, light and vegetation cover as possible confounders; repeat seasons if the claim is year-round. A semi-natural site is influenced by people but dominated by wild organisms, rather than simply a planted crop. An observed gradient association still needs controls to isolate a cause.
Interpret sampled maxima without inventing lethal limits
- Invented plant P counts across pH 4.0, 4.5, 5.0, 5.5, 6.0, 6.5 and 7.0 are 0, 2, 8, 15, 11, 4 and 0, each in 0.25 square metres. At pH 5.5 density is $15/0.25=60$ plants per square metre; at 6.0 it is 44. The sampled maximum is 5.5 and recorded occurrence spans 4.5–6.5.
- Those endpoints are not exact lethal limits: only seven positions and their accompanying conditions were sampled. The rise followed by decline also shows why a weak straight-line correlation need not mean no association. A controlled pH comparison could distinguish effects, but would still depend on the life stage and other conditions tested.
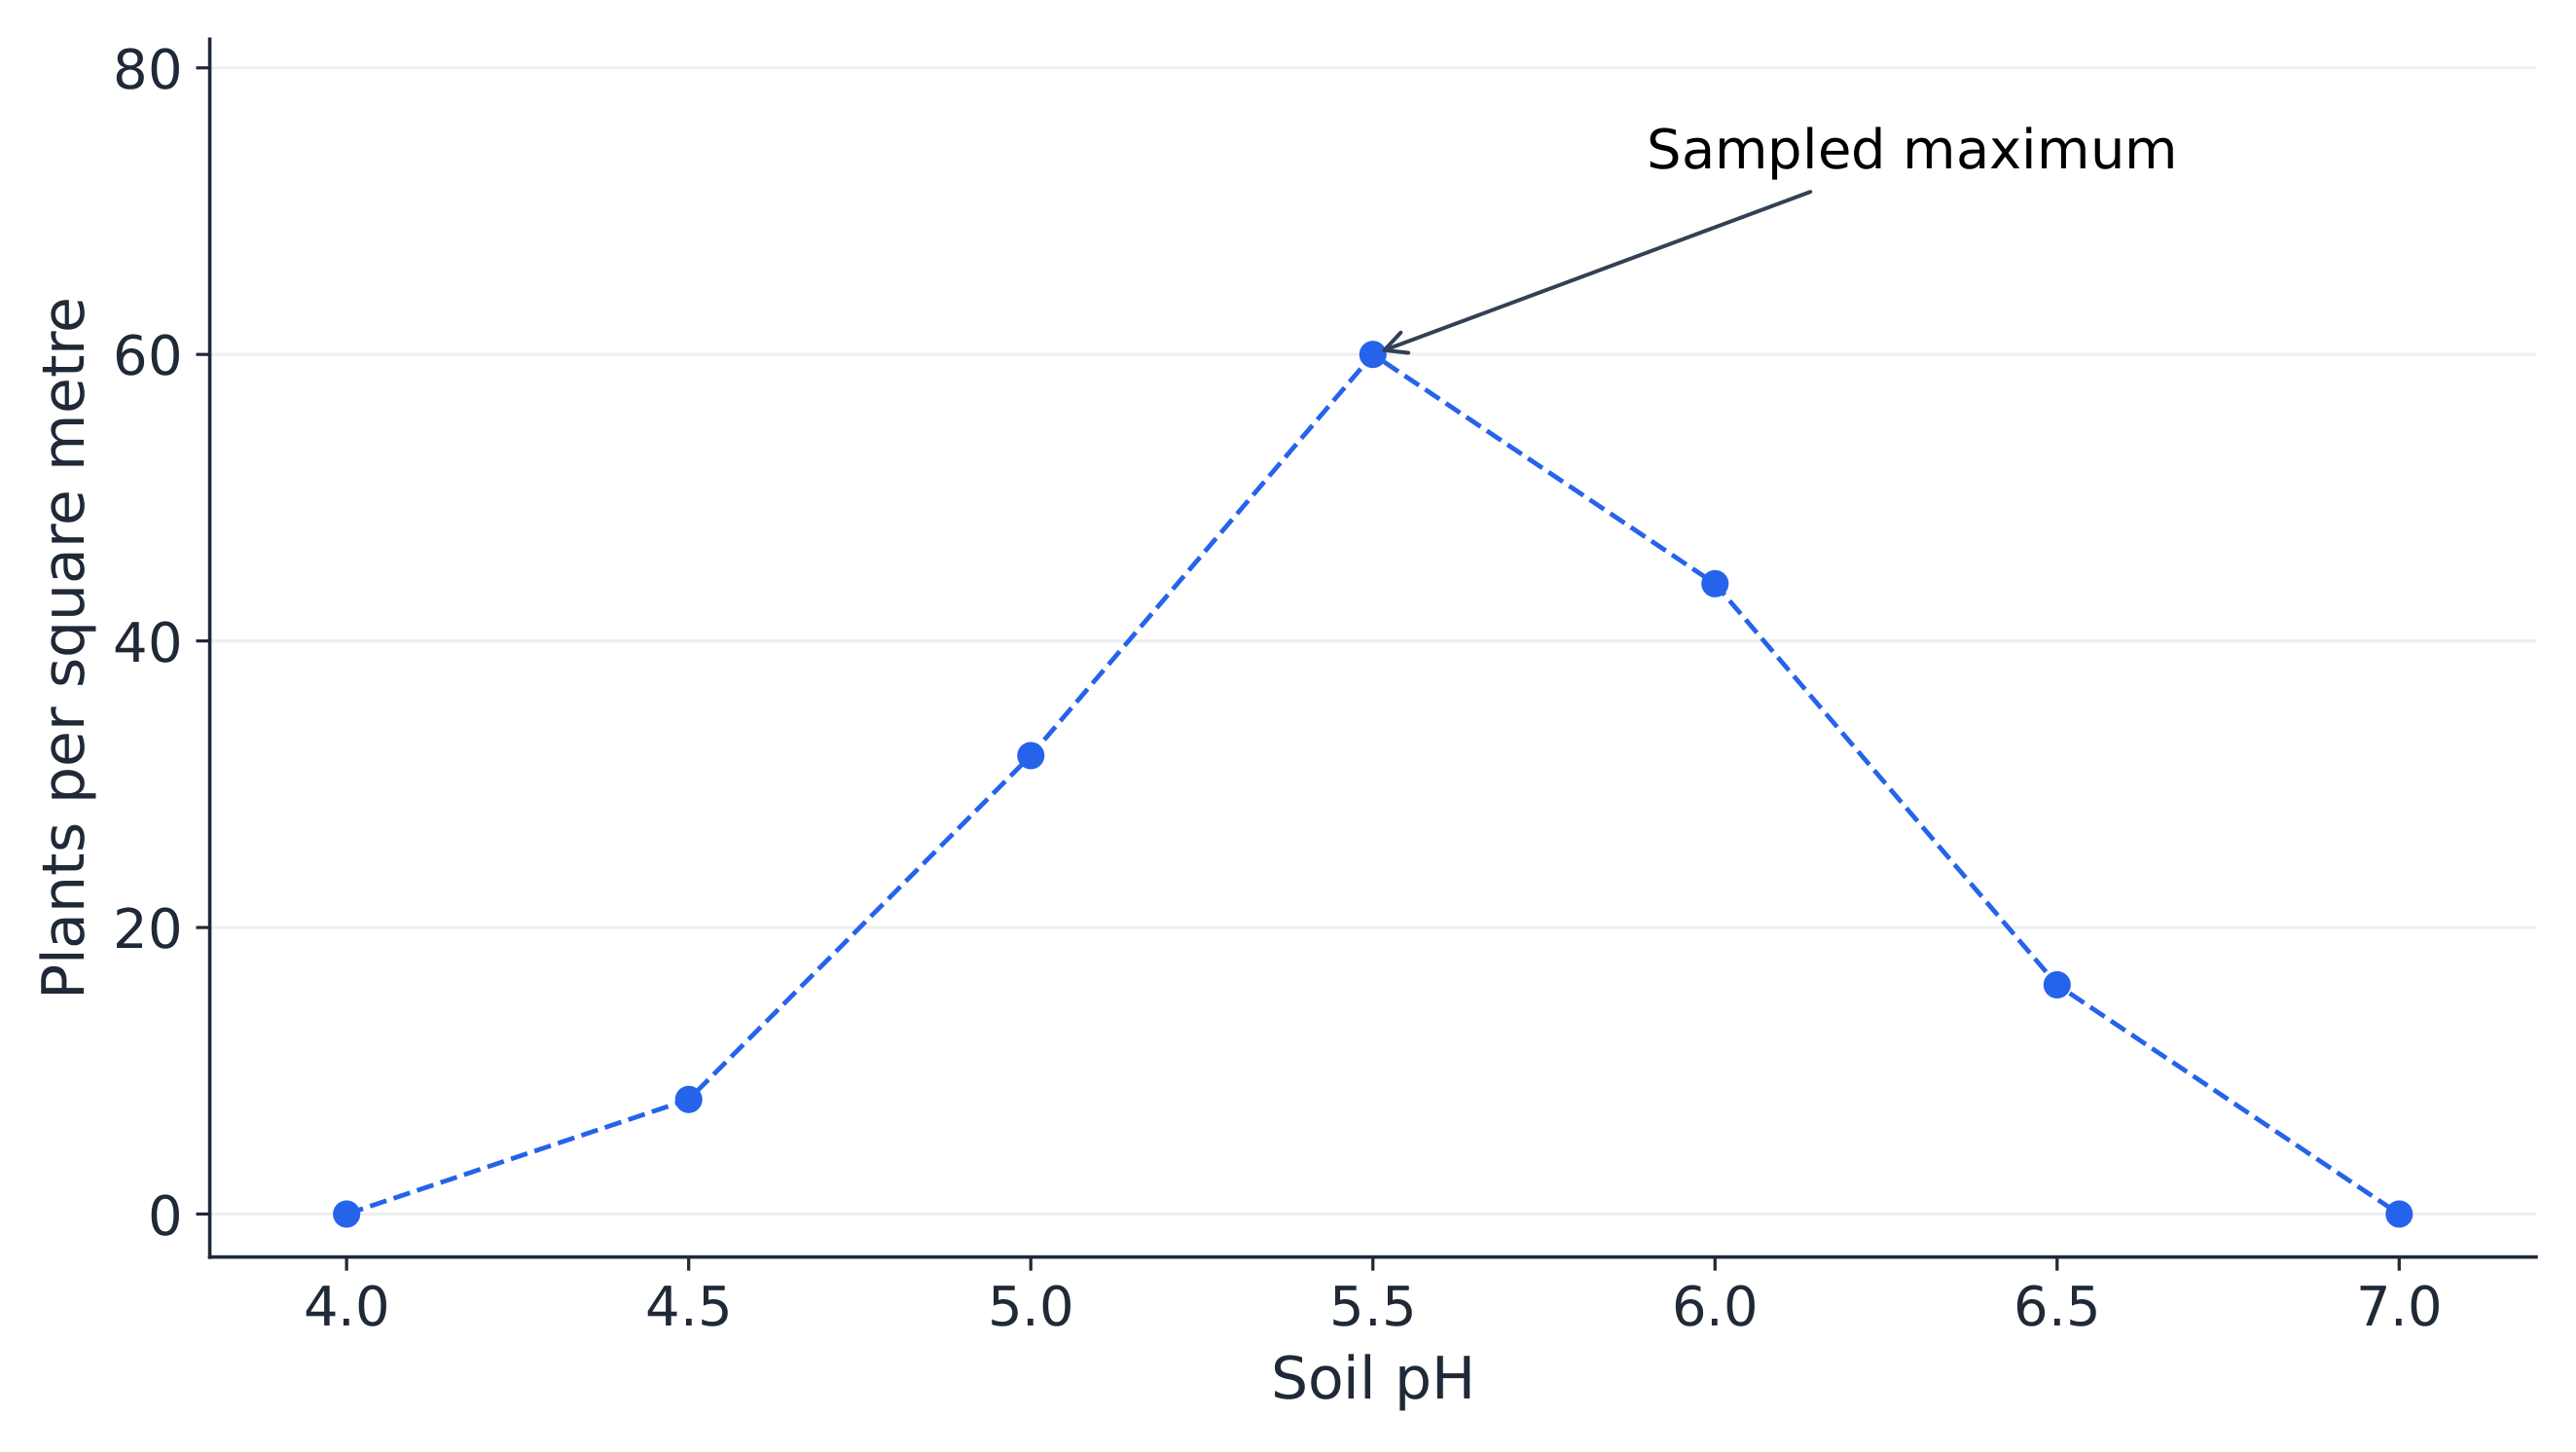
An invented transect quadrat at pH 6.0 contains 11 plants over 0.25 square metres. Find density per square metre.
Difficulty 2/5 · 140 coins + a small bonus on first completion today
11/0.25 = 44 plants per square metre. An observed count at one pH does not establish exact physiological limits, and other factors can covary along a transect.
Explain compatible conditions for shallow reef building
- Many shallow tropical reef-building corals contain photosynthetic symbionts. Light, clear water and suitable depth support that partnership; turbidity limits light and deposited sediment can smother surfaces. The NOAA reef account describes many tropical builders growing well around 23–29°C, rather than one universal survival range for all corals.
- Suitable marine salinity and carbonate chemistry also matter. Lower seawater pH can reduce carbonate availability without falling below pH 7. Reef construction must exceed erosion and dissolution. Sustained unusual heat can cause bleaching, a loss of symbionts or pigments, but bleaching does not prove every affected coral animal is already dead. Cold-water corals also exist.
Invented live coral cover changes from 40% to 28%. What is the relative decrease, expressed as a percentage of the original cover?
Difficulty 2/5 · 140 coins + a small bonus on first completion today
The decrease is 12 percentage points. Relative to the starting 40%, it is 12/40 × 100 = 30%. This does not show that 30% of every colony died or identify the sole cause of the observed change.
Link climate to six broad biome patterns
- Tropical forest has warm conditions and substantial rainfall; temperate forest has moderate temperatures and adequate water with seasonality. Taiga has long cold winters and a short growing season, with prominent conifers. Grassland reflects water limits or seasonality, often interacting with fire and grazing. Tundra has cold, short seasons and low vegetation; hot desert has low water supply relative to evaporative demand.
- Annual mean temperature and rainfall give broad tendencies, not exact local boundaries. Seasonality, drainage, soil, altitude, disturbance and land use matter. A year's rainfall concentrated into one short season differs from steady monthly rain. The climate diagram is an invented schematic, not a map or universal threshold table.
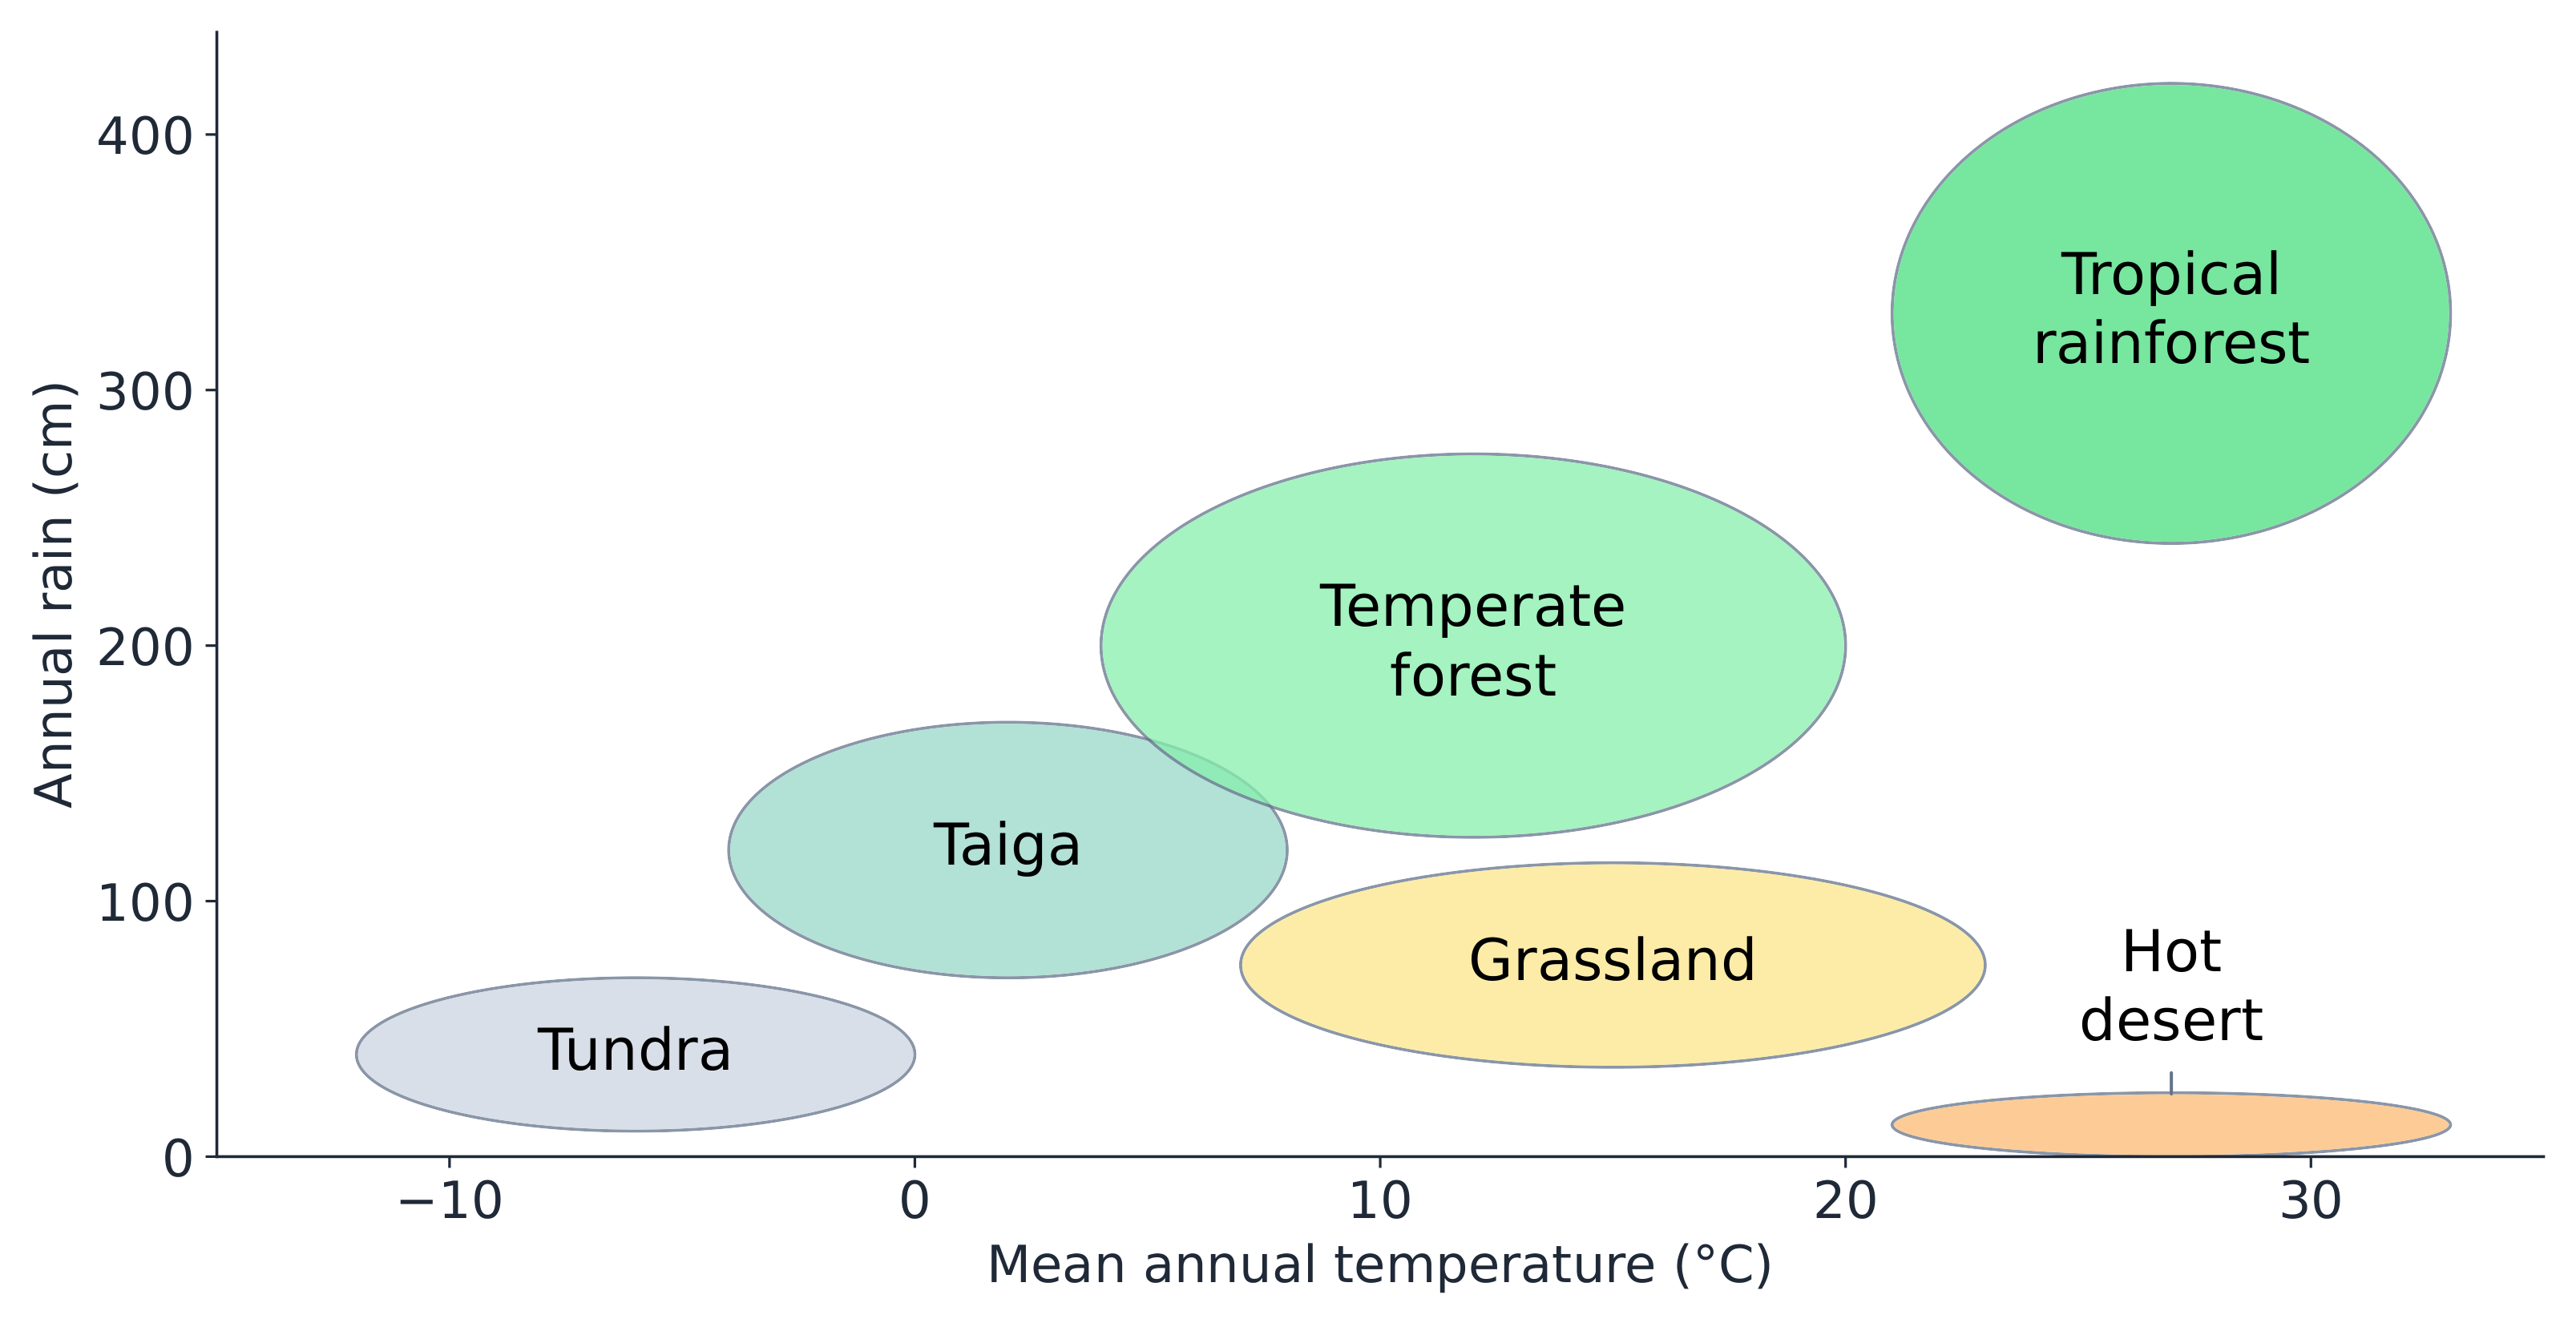
Why can equal annual rainfall and mean temperature fail to predict the same local community at two sites?
Difficulty 1/5 · 100 coins + a small bonus on first completion today
Climate helps explain broad functional patterns, while annual summaries omit important timing and local conditions. Convergent traits need not mean identical species.
Explain convergence without requiring identical species
- Similar environmental filters can favour similar functions in different evolutionary lineages, such as water storage or reduced exposed leaf area in dry habitats. Convergent evolution concerns independently evolved similarities; similar biome appearance does not require identical species on separate continents or complete absence of all shared ancestry.
- An adaptive explanation links an inherited feature to a mechanism, a benefit under stated conditions and a possible cost. Separate evidence of present function from evidence of its evolutionary origin. Similar appearance alone cannot establish the detailed ancestry, and useful short-term acclimation is not the same as a population evolving during one exposure.
Compare a named desert plant and animal
- Saguaro, Carnegiea gigantea, stores water in a succulent photosynthetic stem whose pleats expand as water content increases. Shallow spreading roots exploit brief wetting and reduced leaves limit broad exposed leaf surface. The National Park Service account links these structures to changing water availability; storage does not make every seedling drought-proof.
- Fennec fox, Vulpes zerda, hunts at night and uses large ears to detect prey; exposed ears can also transfer heat when the gradient permits. Fur on its feet helps protect against hot sand. See the Smithsonian species account. Large surfaces do not guarantee cooling when the surroundings favour heat gain: behaviour, insulation and blood flow also matter.
Compare a named rainforest plant and animal
- Kapok, Ceiba pentandra, has a tall trunk and crown providing access to canopy light; buttresses help distribute mechanical loads and support the trunk. NParks documents its mature buttresses. This does not mean every rainforest tree has identical roots or that height eliminates wind risk.
- Geoffroy's spider monkey, Ateles geoffroyi, uses long limbs and a prehensile tail in arboreal movement. A hairless gripping region helps the tail support attachment while limbs remain available during feeding, as described by the Los Angeles Zoo account. Do not extend a named species' tail adaptation to every primate.
Evaluate water conservation and carbon gain together
- Invented equal-area leaves lose 0.030 g and 0.012 g over 15 minutes from 10 square centimetres. Converting to milligrams and hours gives rates 12 and 4.8 milligrams per square centimetre per hour: a 60% reduction. If assimilation indices fall from 20 to 12, carbon gain falls 40%. Better water conservation alone does not establish the greatest growth or reproduction.
- Control area, duration, light, humidity, temperature, airflow and water supply, with independent plants. For body models, area 400 square centimetres over volume 2,000 cubic centimetres gives 0.20 per centimetre, one tenth of 2.0. A lower ratio can reduce exchange per internal volume under comparable conditions, but insulation, shape and gradients prevent a universal “larger is better in a hot habitat” conclusion.
Invented equal-area leaves lose 0.030 g and 0.012 g from 10 square centimetres over 15 minutes; assimilation indices are 20 and 12. Evaluate the claim that the second leaf is unconditionally better adapted.
An adaptive explanation links an inherited feature, mechanism, environment and fitness consequences. A useful response can have trade-offs.
Build a selection explanation with inherited differences and reproduction
- In an invented drought example, plants differ in root depth. If inherited differences improve water access and those plants leave more viable, fertile offspring, later generations may contain more of the contributing alleles. The drought need not instruct each plant to produce a useful mutation. Selection changes population contributions, not an individual's genotype by intention.
- Darwin's mechanism explained how evolutionary change could arise through differential success. A scientific theory is a tested explanatory framework, not a guess awaiting promotion to a law. Replacing an influential framework can be a paradigm shift. Modern evolution also includes mutation, gene flow and drift, so an observed change is not automatically evidence for selection alone.
Distinguish the origin of alleles from their reshuffling and selection
- Mutation can introduce alleles before or during exposure to a pressure, without being directed by a need for useful effects. Random with respect to need does not mean every base has the same mutation probability. Crossing over, independent assortment of suitable loci and random fertilization create new combinations of existing alleles.
- A deeper root could also reflect favourable soil or plastic growth. Selection acts through phenotypic differences, but a sustained genetic response requires a heritable contribution. One plant growing a useful structure is not proof that a new beneficial mutation occurred or that an acquired change will be inherited.
Connect overproduction and environmental pressures with differential outcomes
- Many seeds can be produced while only some survive to reproduce because space, light, water or minerals are limited. Competition within a species can occur through resource use without fighting. Mortality alone is insufficient: if deaths are unrelated to the relevant inherited differences, they do not demonstrate selection for that trait.
- Drought and low temperature are abiotic pressures; predation, disease and competition are biological interactions. A density-independent frost can still affect genotypes differently. Reduced stomatal opening may conserve water while limiting carbon dioxide entry, and extensive roots cost resources. Advantage therefore depends on conditions and trade-offs, rather than a universally perfect feature.
Calculate reproductive contribution per parent before comparing fitness
- In an invented comparison, each genotype begins with 20 parents. One leaves 60 offspring reaching a defined reproductive stage; the other leaves 40. Mean contributions are three and two per parent. Taking the first as relative fitness one, the second is two thirds, about 0.667.
- Fitness is contribution to later generations in a stated environment, not simply strength, lifespan or adult survival. If starting parent numbers differ, raw offspring totals are misleading. Define the outcome stage and time interval. A genotype's drought advantage need not persist in wet conditions, and a surviving individual leaving no descendants may contribute less than a shorter-lived reproducing individual.
Two invented genotypes each begin with twenty parents and leave sixty and forty offspring reaching the defined reproductive stage. Taking the first genotype’s relative fitness as 1, find the second’s relative fitness.
Difficulty 2/5 · 140 coins + a small bonus on first completion today
Mean contributions are 3 and 2 per parent; the second relative to the first is 2/3 ≈ 0.667. Equal starting numbers and equivalent outcomes are necessary.
Test inheritance without confounding a family with its environment
- Grow descendants of contrasting parents under comparable age, soil and water conditions, using multiple independent families and experimental units. Common-garden conditions reduce environmental differences; putting each family in its own single pot still confounds family and pot. Reciprocal environments can reveal an inherited response that depends on conditions.
- Connect inherited differences to function and reproductive success, then compare allele measurements where appropriate. Common conditions do not remove every parental effect. Failure to see the predicted change could involve gene flow, competing pressures, genetic architecture or limited sampling, rather than disproving all selection. State what evidence would distinguish these alternatives.
Count allele copies again after the contributing population changes
- In an invented 100-plant population, AA = 36, Aa = 48 and aa = 16. The a copies are 48 + 2 × 16 = 80 among 200, giving frequency 0.40. If all aa fail before breeding, 84 plants remain; a copies are now 48 among 168, giving two sevenths, about 0.286. No surviving heterozygote changed its own genotype.
- The denominator changes with the contributing population. Mortality is not itself a new offspring generation; transmission and subsequent conditions determine later frequencies. If survivors contribute equally to gametes, offspring formation alone need not reduce a again. The allele can persist in heterozygotes, and real root depth need not follow a single-locus model.
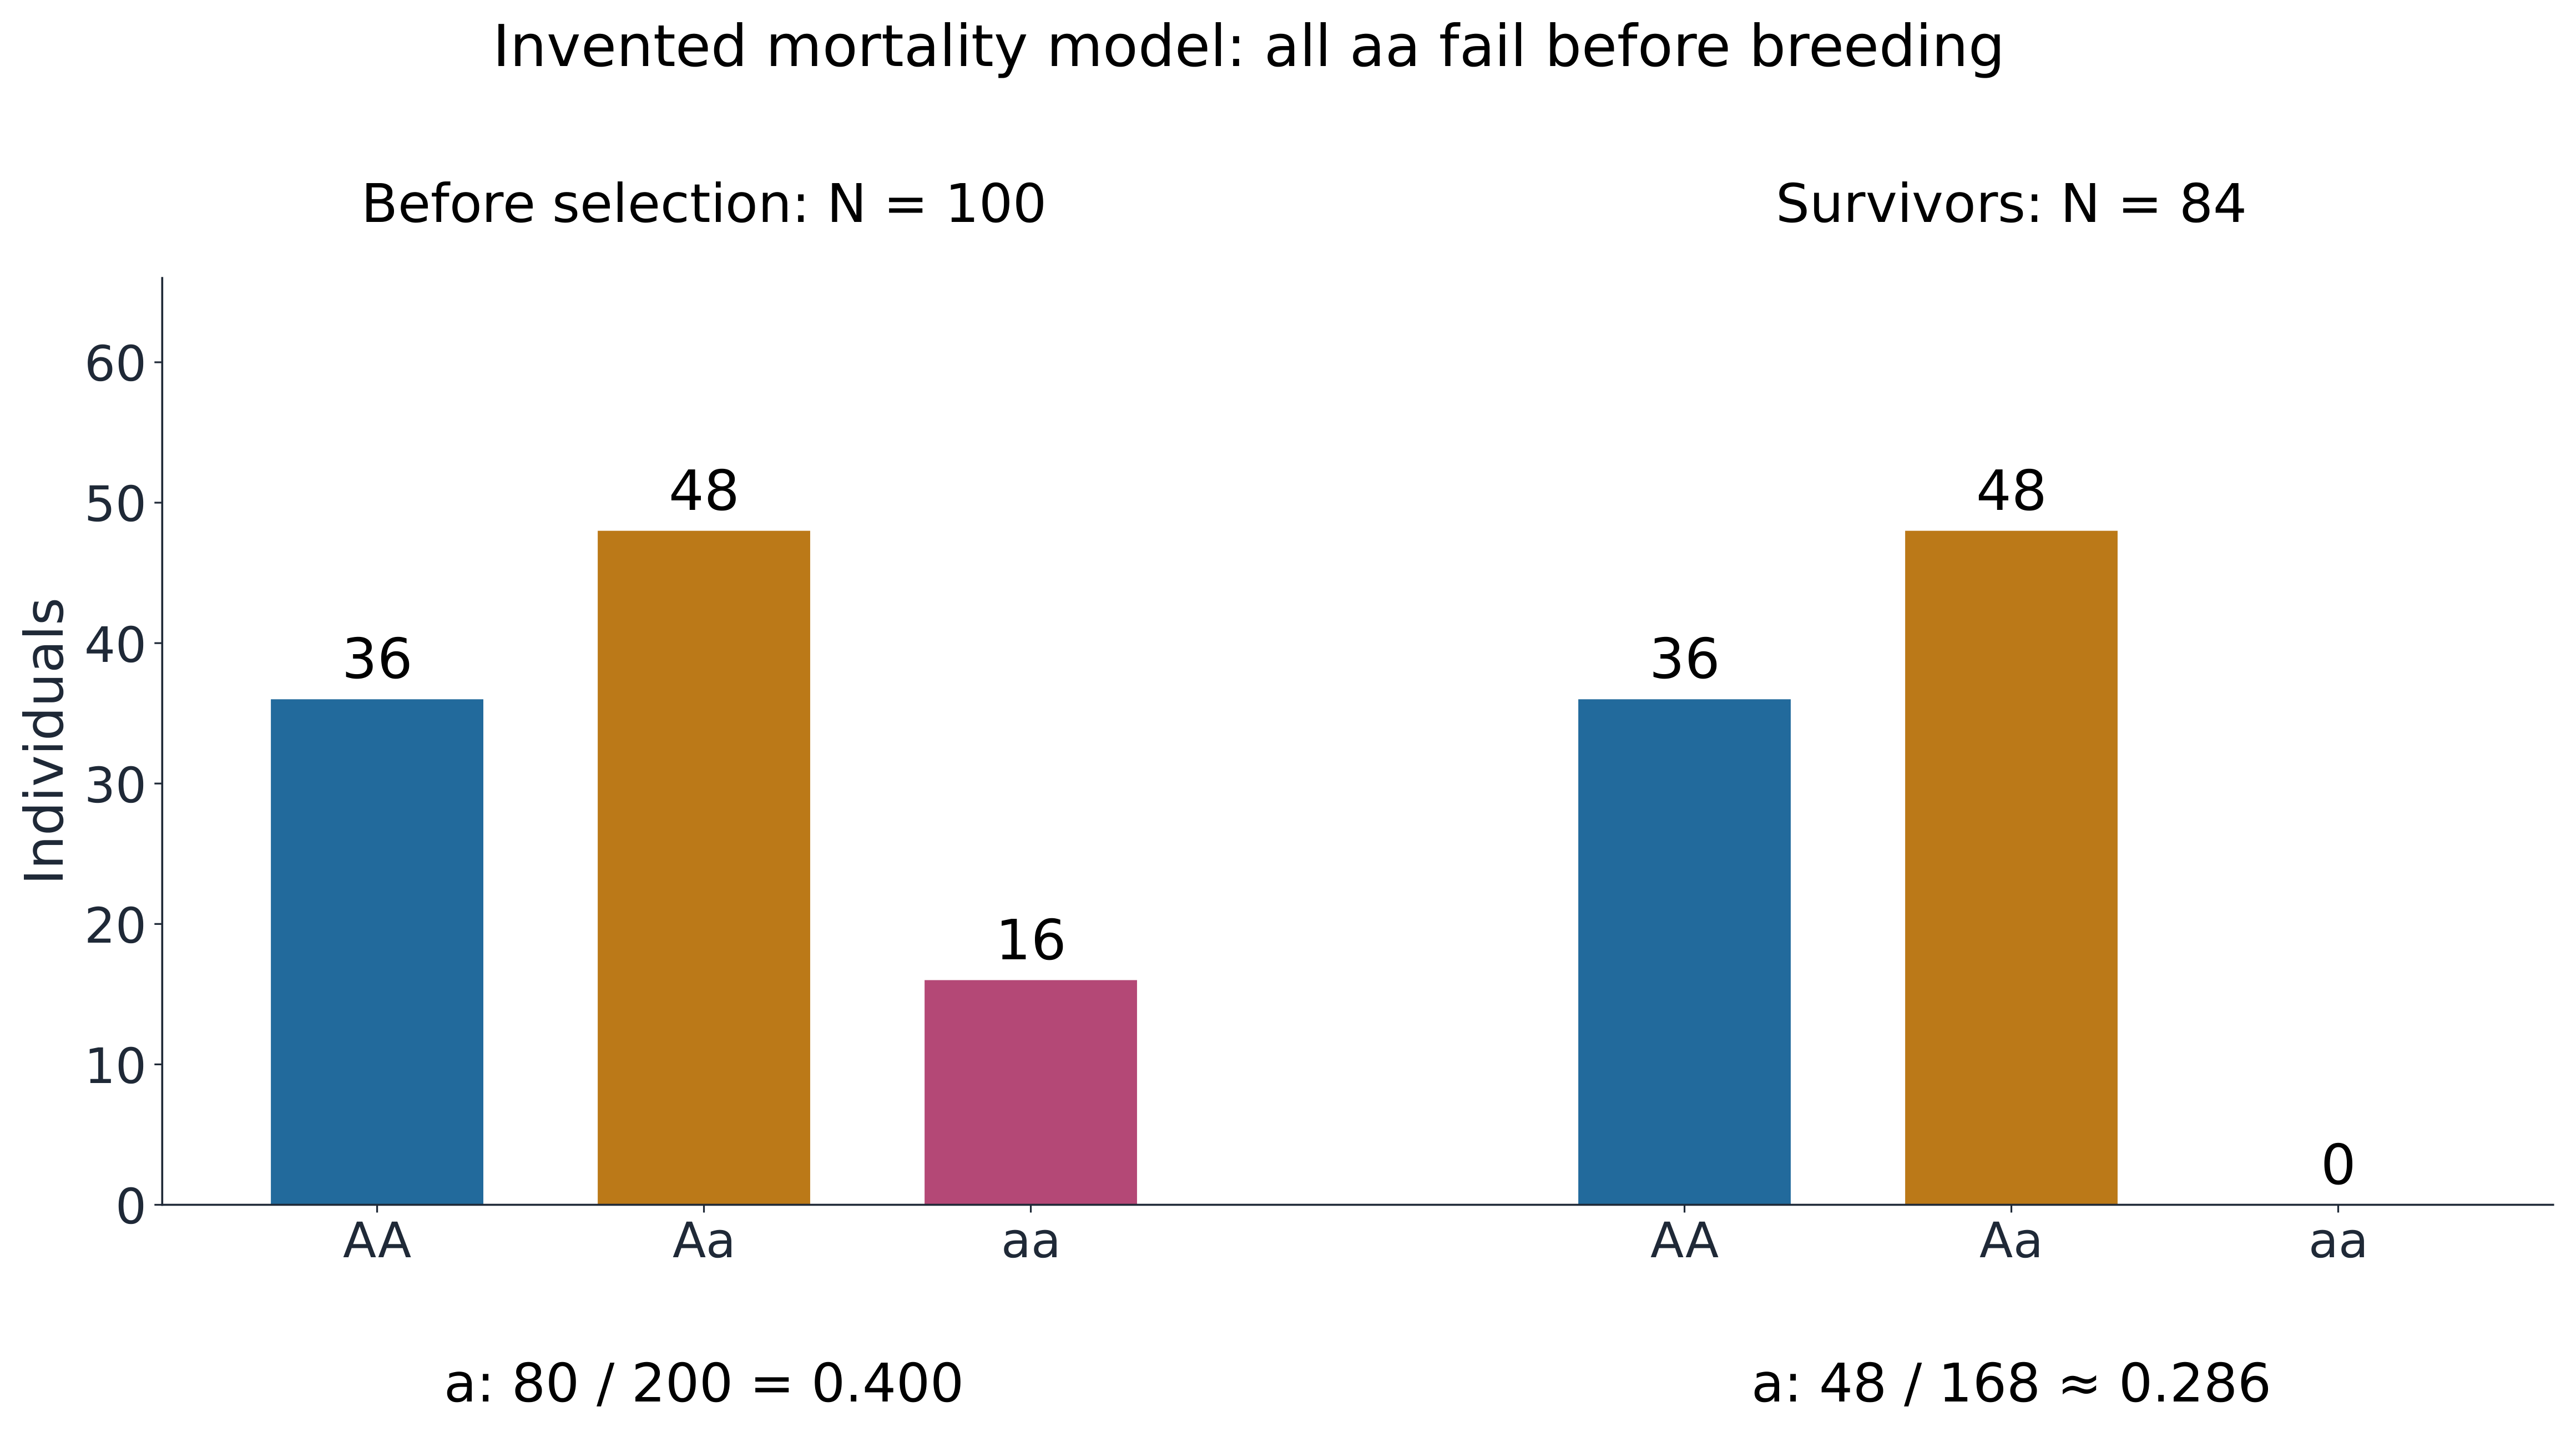
Invented starting counts are 36 AA, 48 Aa and 16 aa. All aa fail before breeding; all others survive. What percentage of allele copies among survivors are a?
Difficulty 2/5 · 140 coins + a small bonus on first completion today
84 survivors give 168 copies; only heterozygotes supply a, giving 48/168 × 100 ≈ 28.57%. No surviving individual changed genotype. This is not automatically a new offspring generation.
Separate percentage-point changes from relative frequency changes
- Another invented record has 90 of 200 copies of an allele initially and 120 of 200 later. Frequencies are 45% and 60%: a rise of 15 percentage points, or about 33.3% relative to the starting 45%. A later value of 140/200 is 70%, ten percentage points above 60%.
- A frequency shift describes population change but does not uniquely identify selection. Migration, finite-population reproductive sampling, measurement error or changing population definitions can also contribute. Keep locus, population boundaries, collection times and copy denominators consistent. Extra evidence about inherited reproductive differences is needed to support the proposed selective mechanism.
In an invented record, a named allele rises from 90 of 200 copies to 120 of 200. What is the increase in percentage points?
Difficulty 2/5 · 140 coins + a small bonus on first completion today
45% to 60% is an increase of 15 percentage points. Relative to the initial frequency, it is about a 33.3% increase; these are distinct quantities.
Explain mating advantages alongside survival costs
- Sexual selection reflects differences in mating or fertilization success, including competition for mates and mate choice. Elaborate birds-of-paradise plumage and courtship provide a context: display can attract mates while costing energy or increasing exposure. A benefit in one fitness component need not improve every other component.
- A complete account connects inherited variation, differing reproductive success and transmission. It does not say preference caused males to grow useful inherited colours on demand. Experimental mate-response comparisons need controlled background, light and visual cues, with suitable animal-care requirements; conspicuousness to a human observer is not automatically the same in every natural background.
Read Endler's manipulation as a test of interacting pressures
- In Endler's 1980 guppy study, gravel background and predation treatment were varied. Stronger-predator, weaker-predator and no-predator treatments allow comparisons of background matching and conspicuousness. Identify the independent variables and the particular colour-pattern measurement before interpreting the result.
- Many fish in a pond are not many independent treatment ponds. Background, body size, starting variation and other pattern components can affect interpretation. Controlled manipulation strengthens a causal account compared with field correlation alone, but a single ratio of means does not supply its own uncertainty or establish every mechanism uniquely.
Compare published guppy means without inventing new observations
- Table 3 of Endler's paper gives all-spot mean lengths in millimetres (mm), fine/coarse gravel: C 1.17/1.32, R 1.54/1.74 and K 1.47/1.34. Coarse divided by fine is about 1.128, 1.130 and 0.912. Values above one show larger mean spots on coarse gravel; the no-predator comparison reverses that direction.
- The contrast fits background matching under predation and a role for sexual selection without predators. The figure summarizes these published means; it supplies no uncertainty intervals. Ratios are descriptive, not invented fish records or a significance test, and different colour-pattern components need not respond identically. Keep this named evidence separate from the invented plant calculations.
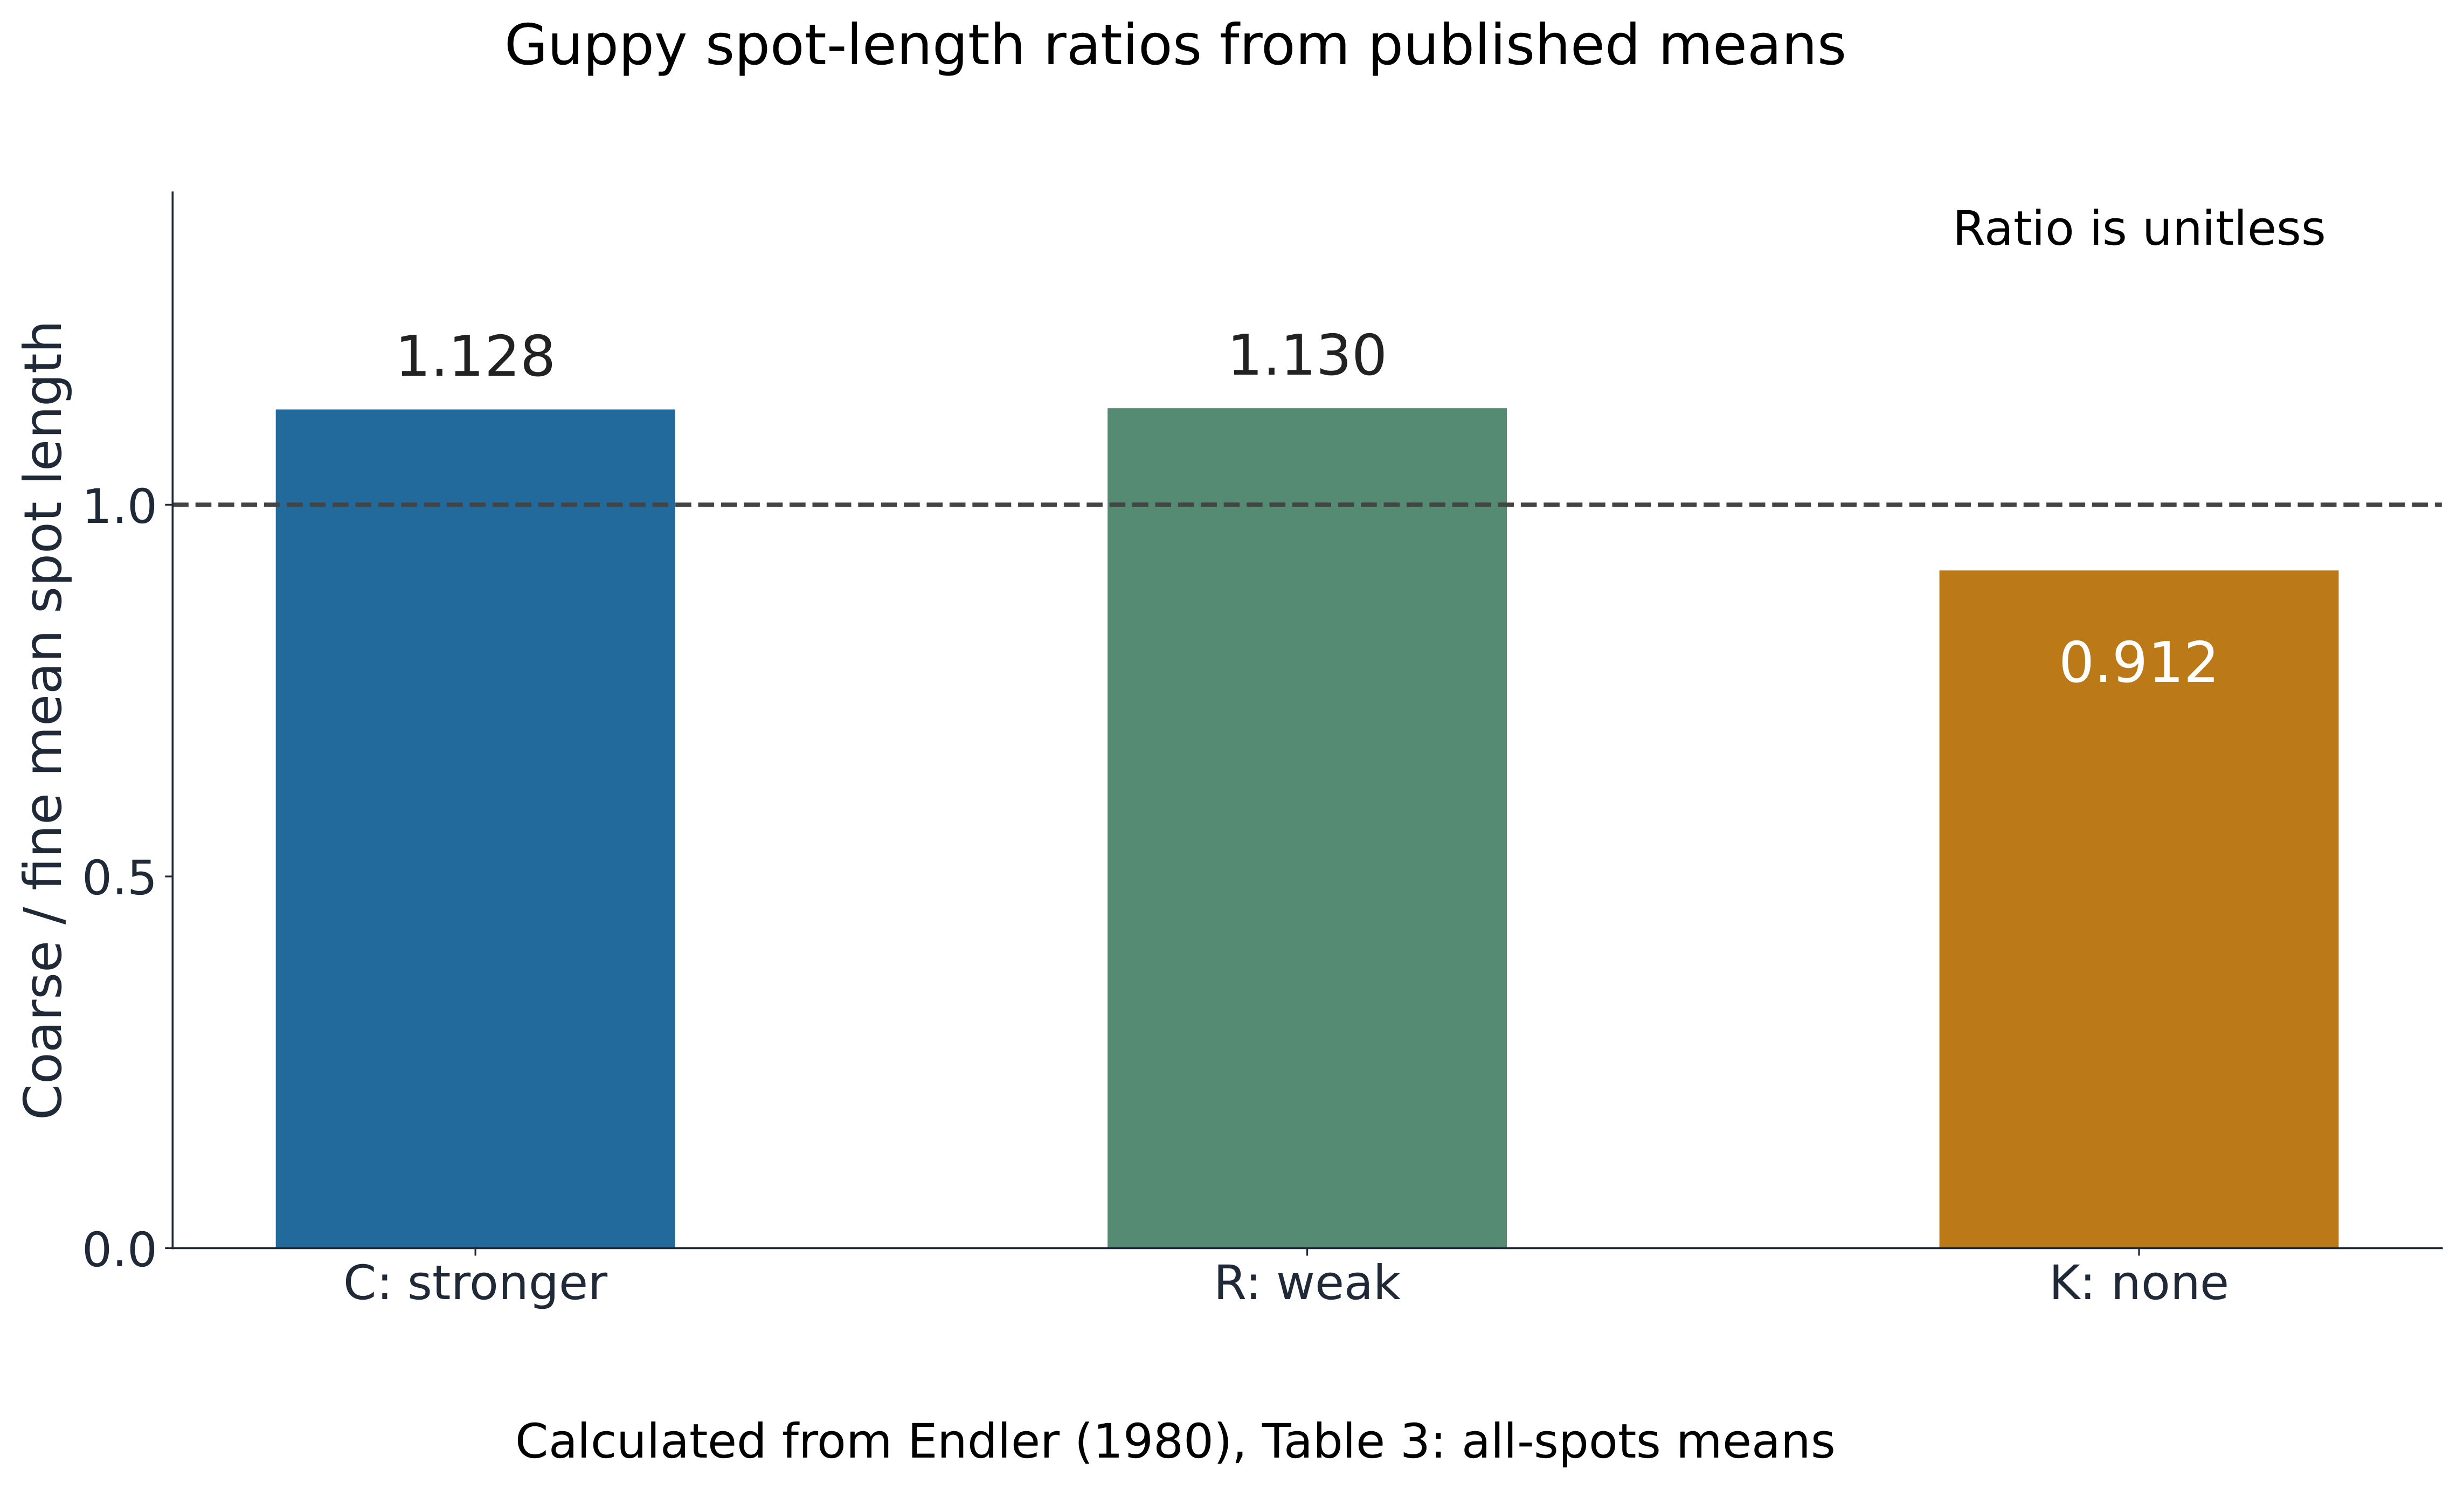
Endler’s table-3 all-spot mean lengths in treatment C are 1.17 on fine gravel and 1.32 on coarse gravel. Calculate coarse divided by fine.
Difficulty 2/5 · 140 coins + a small bonus on first completion today
1.32/1.17 ≈ 1.128. Above one means the coarse-gravel mean is greater for this comparison; the ratio alone is not a significance test or an estimate of every colour-pattern response.
Link a population change with the evidence needed for its cause
- State the inherited variation, pressure, functional effect, difference in reproductive contribution and transmission to later generations. Keep an individual's acclimatization distinct from an evolving population. Explain where the evidence establishes inheritance and where it measures survival, mating or offspring contribution.
- For numerical data, count allele copies with the right denominator, define fitness per comparable parent and distinguish percentage points from relative changes. Then evaluate sampling, gene flow, drift and environmental alternatives. A strong mechanism explains the data and makes a testable prediction, rather than merely attaching the word selection to a changing graph.
An allele frequency changes between two samples. What additional reasoning is needed before identifying natural selection as the cause?
Difficulty 1/5 · 100 coins + a small bonus on first completion today
Frequency change is a description of population genetics. The cause requires evidence beyond a changing number; selection concerns heritable differences in contribution.
An invented drought-root investigation starts with 36 AA, 48 Aa and 16 aa plants; all aa fail before breeding and all others survive. Endler varied gravel background and predation. His table-3 all-spot mean lengths in mm are fine/coarse: C 1.17/1.32, R 1.54/1.74 and K 1.47/1.34; K has no predators. Use these data to explain what supports selection. Calculate the a-allele frequency before and after mortality, interpret coarse/fine spot-length ratios, and give one limit of each investigation.
A causal explanation combines mechanism, inheritance and evidence rather than treating all change or mortality as selection.