Historical perspectives and psychometric interpretation
Introduced| English | Meaning |
|---|---|
| base rates/beɪs reɪts/ | How common a condition or category is in the specified population. |
| structuralism/ˈstrʌktʃərəlɪzəm/ | The school associated with analysing conscious experience into basic elements. |
| percentile/pəˈsentaɪl/ | A value marking a specified percentage of observations at or below it in an ordered distribution. |
A strong hit rate can mislead
- A fictional test flags 9 out of 10 people who have a condition. Yet most people it flags do not have it. The missing information is how often it flags other people and how common the condition is.
- GRE history and measurement questions need both precise concepts and careful comparisons. We will connect psychological perspectives with score interpretation and base rates 基础率: how common a condition or category is in the population being considered.
Early laboratories and schools
- Wundt established his Leipzig experimental psychology laboratory in 1879. His approach included the active organisation of experience. Structuralism 结构主义 is especially associated with Titchener's later analysis of conscious experience into elements; do not treat the laboratory milestone and that school as identical.
- Functionalism, associated with William James and others, asked what mental processes do and how they support adaptation. Structural and functional questions emphasise different aims, but a short school label cannot capture all of a researcher's work.
Worked comparison. “Describe the basic qualities of a colour experience” fits the structural emphasis. “How does attention help someone respond to a changing task?” fits the functional emphasis. Choose by the question being asked, then use names as supporting clues.
Match each school with a key figure.
Difficulty 2/5 · 140 coins + a small bonus on first completion today
Titchener is especially associated with structuralism; James with functionalism; Watson with behaviourism; Wertheimer with Gestalt psychology. Wundt’s 1879 laboratory is a related milestone, not an interchangeable attribution.
Wundt’s 1879 laboratory and Titchener’s structuralist programme are interchangeable historical labels.
Difficulty 1/5 · 100 coins + a small bonus on first completion today
Distinguish the laboratory milestone from the later school and its particular aims.
Later perspectives ask different questions
- Watson's 1913 behaviourist programme emphasised objective study of behaviour; Skinner later analysed operant behaviour and its consequences. Gestalt psychology, associated with Wertheimer and colleagues, emphasised how organisation of a whole shapes the experience of its parts.
- Freud's psychoanalytic approach stressed unconscious processes and conflict; Maslow and Rogers are associated with humanistic emphases on growth and personal experience. Cognitive approaches study mental processes such as memory and language. Chomsky's 1959 critique of Skinner was one contribution to a wider shift, not a single event that replaced all behavioural research.
A study asks how rewards following an action change its future frequency. Which emphasis is closest?
Difficulty 1/5 · 100 coins + a small bonus on first completion today
The question concerns behaviour and its consequences. Classify the research question rather than relying only on a researcher’s name.
Decide what the score is compared with
- A norm-referenced interpretation compares a score with a specified reference group. A criterion-referenced interpretation compares performance with a defined standard. The same assessment can support both kinds of statement if evidence justifies each interpretation.
- Standardised administration and scoring help control unwanted variation. They do not alone establish comparable meaning across populations, fair access or suitability for every use. Ask who supplied the norms, when they were collected and whether they fit the proposed comparison.
What comparison is stated?
Classify score interpretations.
Which score is criterion-referenced?
Difficulty 1/5 · 100 coins + a small bonus on first completion today
Meeting a defined performance standard is a criterion comparison. Rank and percentile statements compare with people in a specified group.
A standard score is not automatically a percentile
- A z score describes distance from a reference mean in standard deviations: $z=(X-M)/S$. A score of 115 with mean 100 and SD 15 gives $z=(115-100)/15=1$. Mean and SD alone do not determine its percentile 百分位数.
- If the reference distribution is approximately normal, $z=1$ corresponds to about the 84th percentile. With empirical norms, use the relevant percentile table and its convention for ties. A percentile is a relative position, not the percentage of questions answered correctly.
Worked interpretation. Suppose a normally distributed reference scale has mean 50 and SD 10. A score of 40 gives $z=(40-50)/10=-1$, about the 16th percentile. Without the normal-distribution assumption or an empirical norms table, the percentile is not identified by that calculation.
On an approximately normal reference scale with mean 100 and SD 15, a score of 115 is at roughly which percentile?
Difficulty 2/5 · 140 coins + a small bonus on first completion today
z = (115 − 100)/15 = 1. With the stated normal approximation, about 84% of the reference distribution lies below that score. Mean and SD alone would not determine a percentile.
A mean of 100 and SD of 15, without a distribution or percentile table, prove that 115 is at the 84th percentile.
Difficulty 1/5 · 100 coins + a small bonus on first completion today
The mean and SD locate a score in standard-deviation units. The percentile additionally needs the distribution or appropriate empirical norms.
Keep the screening denominators separate
- Sensitivity is the proportion flagged among people who have the condition. Specificity is the proportion not flagged among people who do not have it. The false-positive rate is one minus specificity.
- Positive predictive value (PPV) asks a different question: among all flagged people, what proportion have the condition? For these teaching examples, assume condition status is known independently and test rates are specified for the stated population.
Worked counts. Of 1,000 people, 10 have a condition and 990 do not. The test flags 9 of the 10 and 99 of the 990. Sensitivity is $9/10=90\%$; specificity is $891/990=90\%$. The 99 false positives belong in the PPV denominator, not the sensitivity denominator.
Of 900 people independently known not to have a condition, 810 are not flagged. What is specificity as a percentage?
Difficulty 2/5 · 140 coins + a small bonus on first completion today
Specificity = true negatives/all non-cases = 810/900 = 0.90, or 90%.
Use all positive results to calculate PPV
- The same fictional example has 108 positives: 9 true positives plus 99 false positives. Thus $\mathrm{PPV}=9/(9+99)=9/108\approx0.0833$, or about 8.3%. Most flagged people do not have the condition even though sensitivity is high.
- A negative result is a different question, with a different denominator. Here there are 892 negative results: 891 true negatives and one missed case. Neither a positive nor a negative test result is the same as certainty about an individual.
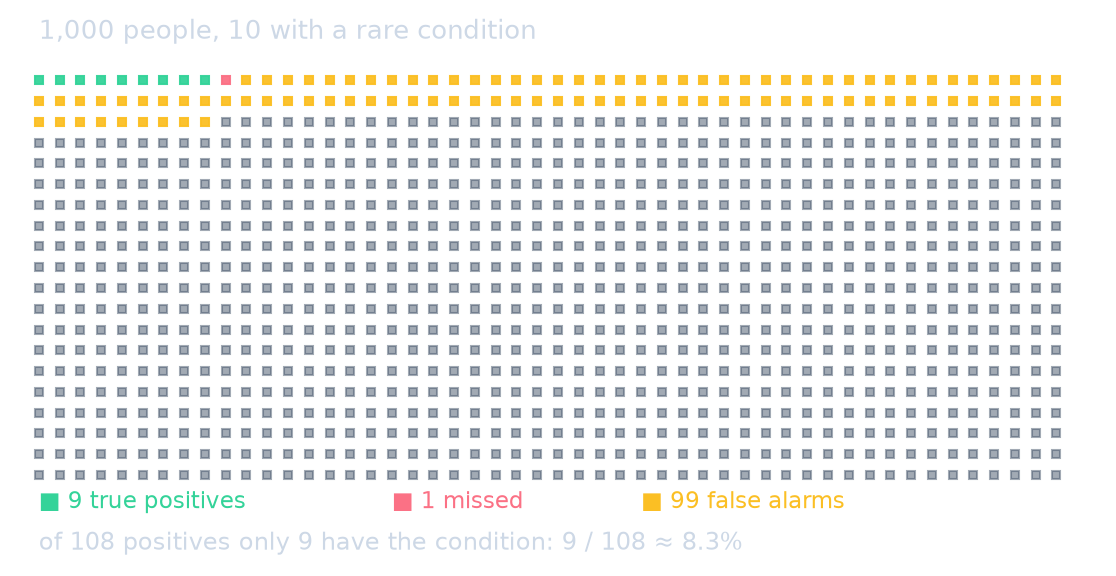
Fictional counts with independently known condition status; a screening-method example rather than a clinical recommendation.
Change the base rate, hold the test rates fixed
- In another fictional population of 1,000, 100 have the condition. Holding sensitivity and specificity at 90% gives 90 true positives and 90 false positives, so $\mathrm{PPV}=90/(90+90)=50\%$. The changed base rate changes PPV.
- This comparison assumes the same test rates apply in both populations. In practice, population differences and how a test is used can also change sensitivity or specificity. Base rate, sensitivity and specificity all matter.

Both populations contain 1,000 people. The comparison holds sensitivity and specificity at 90%; it does not claim that these rates transfer automatically to real populations.
In a fictional population of 1,000, the condition prevalence is 5%, sensitivity is 80% and the false-positive rate is 5%. Using expected counts, what proportion of positive results are true positives (three decimal places)?
Difficulty 2/5 · 140 coins + a small bonus on first completion today
Expected true positives = 0.8 × 50 = 40; expected false positives = 0.05 × 950 = 47.5. Fractional expected counts describe a model, not half a person observed. PPV = 40/(40 + 47.5) ≈ 0.457.
A fictional test population contains 100 cases and 900 non-cases. Sensitivity is 80% and specificity is 90%. Using these counts, what is PPV as a proportion, to three decimal places?
Difficulty 2/5 · 140 coins + a small bonus on first completion today
True positives = 80; false positives = 0.10 × 900 = 90. PPV = 80/(80 + 90) ≈ 0.471. Sensitivity uses a different denominator.
Measurement error needs a model
- In classical test theory, an observed score combines a true score and measurement error for specified repeated measurements. The true score is the expected score across those measurements, not a perfect measure of all of a person's abilities.
- A summary standard error of measurement (SEM) describes the standard deviation of measurement errors on the score scale. It can inform an uncertainty interval with additional assumptions; it is not itself an interval or a maximum possible error. At a fixed score SD, lower relevant reliability gives a larger classical SEM.
Worked calculation. If a score scale has SD 10 and relevant reliability $r=0.84$, the summary formula gives $\mathrm{SEM}=S\sqrt{1-r}=10\sqrt{0.16}=4$ score points. This is measurement uncertainty, not the standard error of a sample mean. It does not guarantee that every error lies within four points.
Using the classical summary SEM formula with score SD 15 and relevant reliability 0.84, what is SEM in score points?
Difficulty 2/5 · 140 coins + a small bonus on first completion today
SEM = 15 × √(1 − 0.84) = 15 × 0.4 = 6 score points. This is not an interval width or a bound on every error.
SEM = 4 guarantees that no measurement error exceeds four score points.
Difficulty 1/5 · 100 coins + a small bonus on first completion today
SEM is a standard deviation under the measurement model. Errors can exceed one SEM; interval claims require additional assumptions.
Reliability, validity and fairness need different evidence
- Reliability concerns consistency or precision under specified replications. Validity concerns evidence supporting a proposed score interpretation and use. A precise score can still support the wrong conclusion; a single reliability coefficient cannot validate a selection rule or establish fairness.
- Review the intended use, reference group, content, accessibility and evidence of bias. Two people with the same score need not have identical strengths, and a reference-group percentile does not by itself state whether either meets a performance standard.
Worked critique. A school says, “Our quiz is reliable, so its top 10% are ready for a course.” Top 10% describes a norm comparison. Readiness requires evidence linking performance to course demands and a justified standard; reliability alone does not supply that link.
High reliability alone is insufficient evidence for every proposed interpretation or use of a score.
Difficulty 1/5 · 100 coins + a small bonus on first completion today
Consistency or precision under specified replications does not establish that an intended interpretation, decision or fairness claim is supported.
A training test reports both a 70th percentile in a local reference group and successful completion of every required safety procedure. Identify the two comparison types and explain why the percentile alone cannot establish readiness.
The 70th percentile is norm-referenced to a specified group. Completion of required safety procedures is criterion-referenced. The percentile concerns relative position, not mastery of the procedures; readiness needs relevant evidence and a justified standard. Both interpretations can be reported for one assessment if supported.
Recap
- Match a perspective to its question and method as well as a historical figure.
- Separate norms, standards, standard scores and percentiles.
- Sensitivity, specificity and PPV condition on different groups.
- PPV changes with the base rate when test rates are held fixed.
- Treat SEM as a model-based standard deviation and examine evidence for the intended score use.
- base rates: How common a condition or category is in the specified population.
- structuralism: The school associated with analysing conscious experience into basic elements.
- percentile: A score's relative position in a specified reference distribution.
A company says: “Our test has 90% sensitivity, so any positive applicant has a 90% chance of belonging to the target category. Its high reliability also proves that rejecting every positive is fair.” Identify two distinct gaps and name relevant additional evidence.
Sensitivity conditions on people in the target category; PPV conditions on positive results. Estimating PPV needs the category base rate and false-positive rate, with evidence that the rates fit the applicant population. Reliability does not establish a justified interpretation, decision threshold or fairness. The proposed rejection rule needs evidence about job relevance, errors and consequences, accessibility and possible bias.