Quality: steer the process, do not nudge it
도입됨| English | 의미 |
|---|---|
| statistical process control | steering a process with sample statistics and control limits instead of inspecting every item |
| control chart | a time plot of a sample statistic with a centre line and three-sigma limits |
| Pareto analysis | ranking causes by count so that the vital few are fixed first |
Inspection finds bad buns; SPC finds the batch going bad
- The contract tolerance is plus or minus 10% on an 80 g bun. Weighing every bun catches failures after the fact.
- Statistical process control 统计过程控制 samples five buns at a time and steers the process before the buns ship.
Limits at three sigma over root n
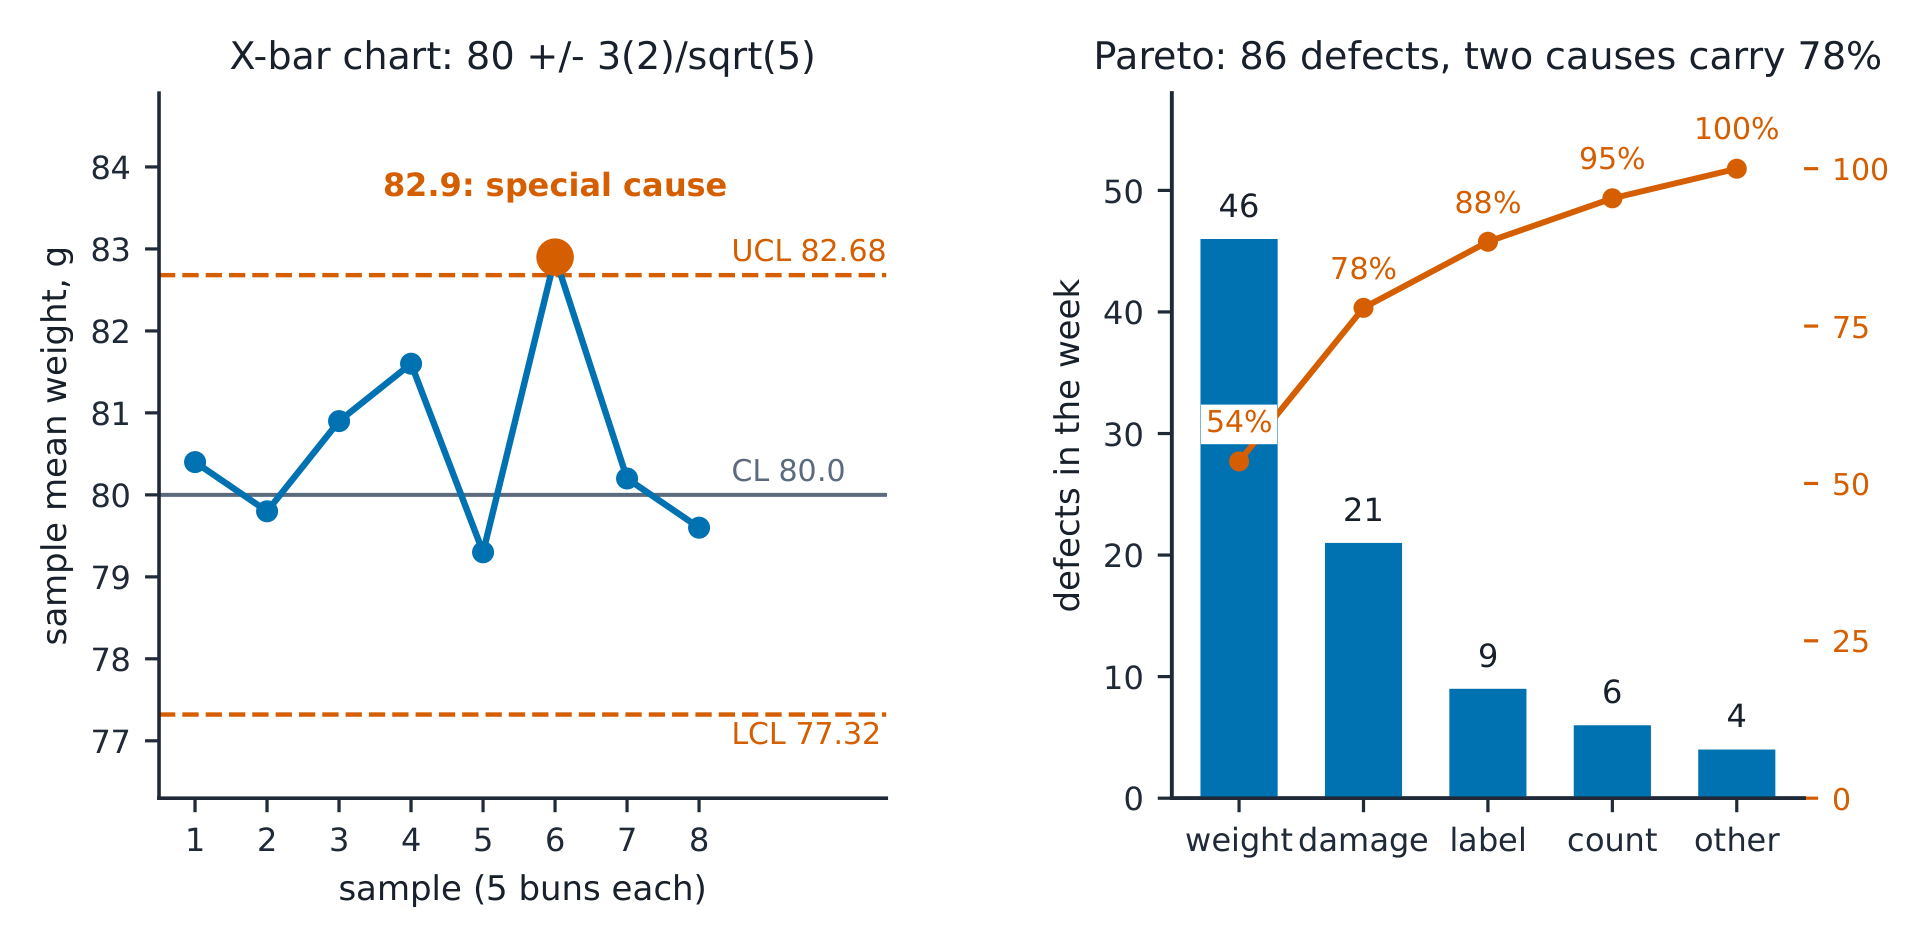
- Process centred at 80.0 g, bun-to-bun sd 2.0 g. The control chart 控制图 for sample means runs $80 \pm 3 \times 2/\sqrt{5} = 80 \pm 2.68$: limits 77.32 and 82.68.
- Same limits by the range route: $\bar{R} = d_2 \sigma = 2.326 \times 2 = 4.65$ g and $A_2 \bar{R} = 0.577 \times 4.65 = 2.68$. The R-chart's upper limit: $D_4 \bar{R} = 9.83$ g.
Centre 80, sd 2, samples of 5. The upper control limit for sample means (two decimals)?
난이도 2/5 · 140코인 + 오늘 첫 완료 시 작은 보너스 추가
$80 + 3 \times 2/\sqrt{5} = 82.68$.
Average range from the sd: $d_2 \sigma$ with $d_2 = 2.326$ and sd 2 (two decimals)?
난이도 2/5 · 140코인 + 오늘 첫 완료 시 작은 보너스 추가
$2.326 \times 2 = 4.65$ g.
Reading the signals
- Week's means 80.4, 79.8, 80.9, 81.6, 79.3, 82.9, 80.2, 79.6: the sixth is beyond 82.68 - a special cause (the new flour lot). Find it; do not retune.
- Next week all eight means sit below centre (79.1 to 79.9): inside the limits, but eight in a row on one side is the run rule - the process has shifted.
- Retuning after every wiggle is tampering: it adds the operator's hand to the noise and widens the spread.
Signal, noise, or tampering?
Classify each chart reading: common cause (leave it), special cause (find it), or tampering (stop it).
Sample 6 reads 82.9 against an upper limit of 82.68. The right response?
난이도 1/5 · 100코인 + 오늘 첫 완료 시 작은 보너스 추가
Beyond the limits is a special cause; find it rather than nudge the process.
Which pattern signals a shift even with every point inside the limits?
난이도 1/5 · 100코인 + 오늘 첫 완료 시 작은 보너스 추가
The run rule: eight on one side has probability about 0.4% under a centred process.
Within the limits, adjust the process after each sample to keep it exactly centred.
난이도 1/5 · 100코인 + 오늘 첫 완료 시 작은 보너스 추가
That is tampering - it adds variance. Within limits, leave the process alone.
Pareto and the cost of quality
- Pareto analysis 帕累托分析 of 86 packing defects: underweight 46, damaged 21, mislabel 9, wrong count 6, other 4 - the first two carry $67/86 = 77.9\%$.
- Cost of quality: prevention 1,200 + appraisal 2,400 + internal failure 5,600 + external failure 9,800 = 19,000, 19% of the week's 100,000 - and 81% of it is failure. The 800 filler-head rebuild (prevention) removes the 46 and most of the 9,800.
Share of the 86 defects carried by underweight 46 and damaged 21, in % (one decimal)?
난이도 2/5 · 140코인 + 오늘 첫 완료 시 작은 보너스 추가
$67/86 = 77.9\%$.
Cost of quality 19,000 as a % of 100,000 revenue?
난이도 2/5 · 140코인 + 오늘 첫 완료 시 작은 보너스 추가
19,000 / 100,000 = 19%.
Match each cost-of-quality category to its example.
난이도 2/5 · 140코인 + 오늘 첫 완료 시 작은 보너스 추가
Prevention and appraisal are spent on purpose; the two failure costs are what leaks when they are not.
Three quality slips
- Chasing inside-limits wiggles. Tampering inflates variance.
- Reading the R-chart with the X-bar limits. Each chart has its own.
- Reporting a count without the Pareto. 86 means nothing; 46 from one filler head means Monday morning.
Recap
- Limits at $3\sigma/\sqrt{n}$: 80 +/- 2.68 for n = 5, sd 2.
- A point beyond, or eight on one side, is a signal with a nameable cause.
- Pareto ranks what to fix; the cost of quality says fix it early.