| Enduring Understanding | Learning Objective | Essential Knowledge |
|---|---|---|
PSO-2 | PSO-2.A |
|
PSO-2.B |
| |
PSO-2.C |
|
| Enduring Understanding | Learning Objective | Essential Knowledge |
|---|---|---|
PSO-2 | PSO-2.D |
|
AP Human Geography · Topic 2
 8:48
8:48
Population and Migration Patterns and Processes
Eight billion people live on this planet. Now look at this street. At one crossing in Tokyo, hundreds of them share a space the size of a school hall.…
English narration · English + 中文 subtitles burned in

| Enduring Understanding | Learning Objective | Essential Knowledge |
|---|---|---|
PSO-2 | PSO-2.A |
|
PSO-2.B |
| |
PSO-2.C |
|
| Enduring Understanding | Learning Objective | Essential Knowledge |
|---|---|---|
PSO-2 | PSO-2.D |
|
Source: College Board AP Course and Exam Description
People are spread very unevenly across Earth. Population distribution 人口分布 describes where people live; population density 人口密度 measures how crowded a place is. Physical conditions influence settlement alongside jobs, transport, politics and history. Important concentrations occur in mid-latitudes, low-lying land, coasts, and river valleys with water and fertile soil.
Geographers use three density measures:
Uneven distribution creates consequences: high concentrations can raise demand for housing and water but also support shared transport and services. Sparse settlement can increase service costs per resident. Outcomes depend on infrastructure and investment.
Try it — original density dataset. Region A has 120,000 residents, 600 square kilometres of total land, 100 square kilometres of arable land and 2,000 farmers. Calculate the three measures before checking.
Worked check. Each ratio answers a different question.
The high physiological value identifies a large population relative to local arable area. It does not prove food shortage without evidence about yields, imports and access. Carrying capacity is the population supportable under particular technology, consumption and resource conditions, not a fixed timeless number.
| English |
|---|
| Population distribution/ˌpɒpjʊˈleɪʃn ˌdɪstrɪˈbjuːʃn/ |
| population density/ˌpɒpjʊˈleɪʃn ˈdensɪti/ |
| Arithmetic density/əˈrɪθmətɪk ˈdensɪti/ |
| Physiological density/ˌfɪzɪəˈlɒdʒɪkl ˈdensɪti/ |
| Agricultural density/ˌæɡrɪˈkʌltʃərəl ˈdensɪti/ |
| Enduring Understanding | Learning Objective | Essential Knowledge |
|---|---|---|
PSO-2 | PSO-2.E |
|
PSO-2.F |
|
Source: College Board AP Course and Exam Description
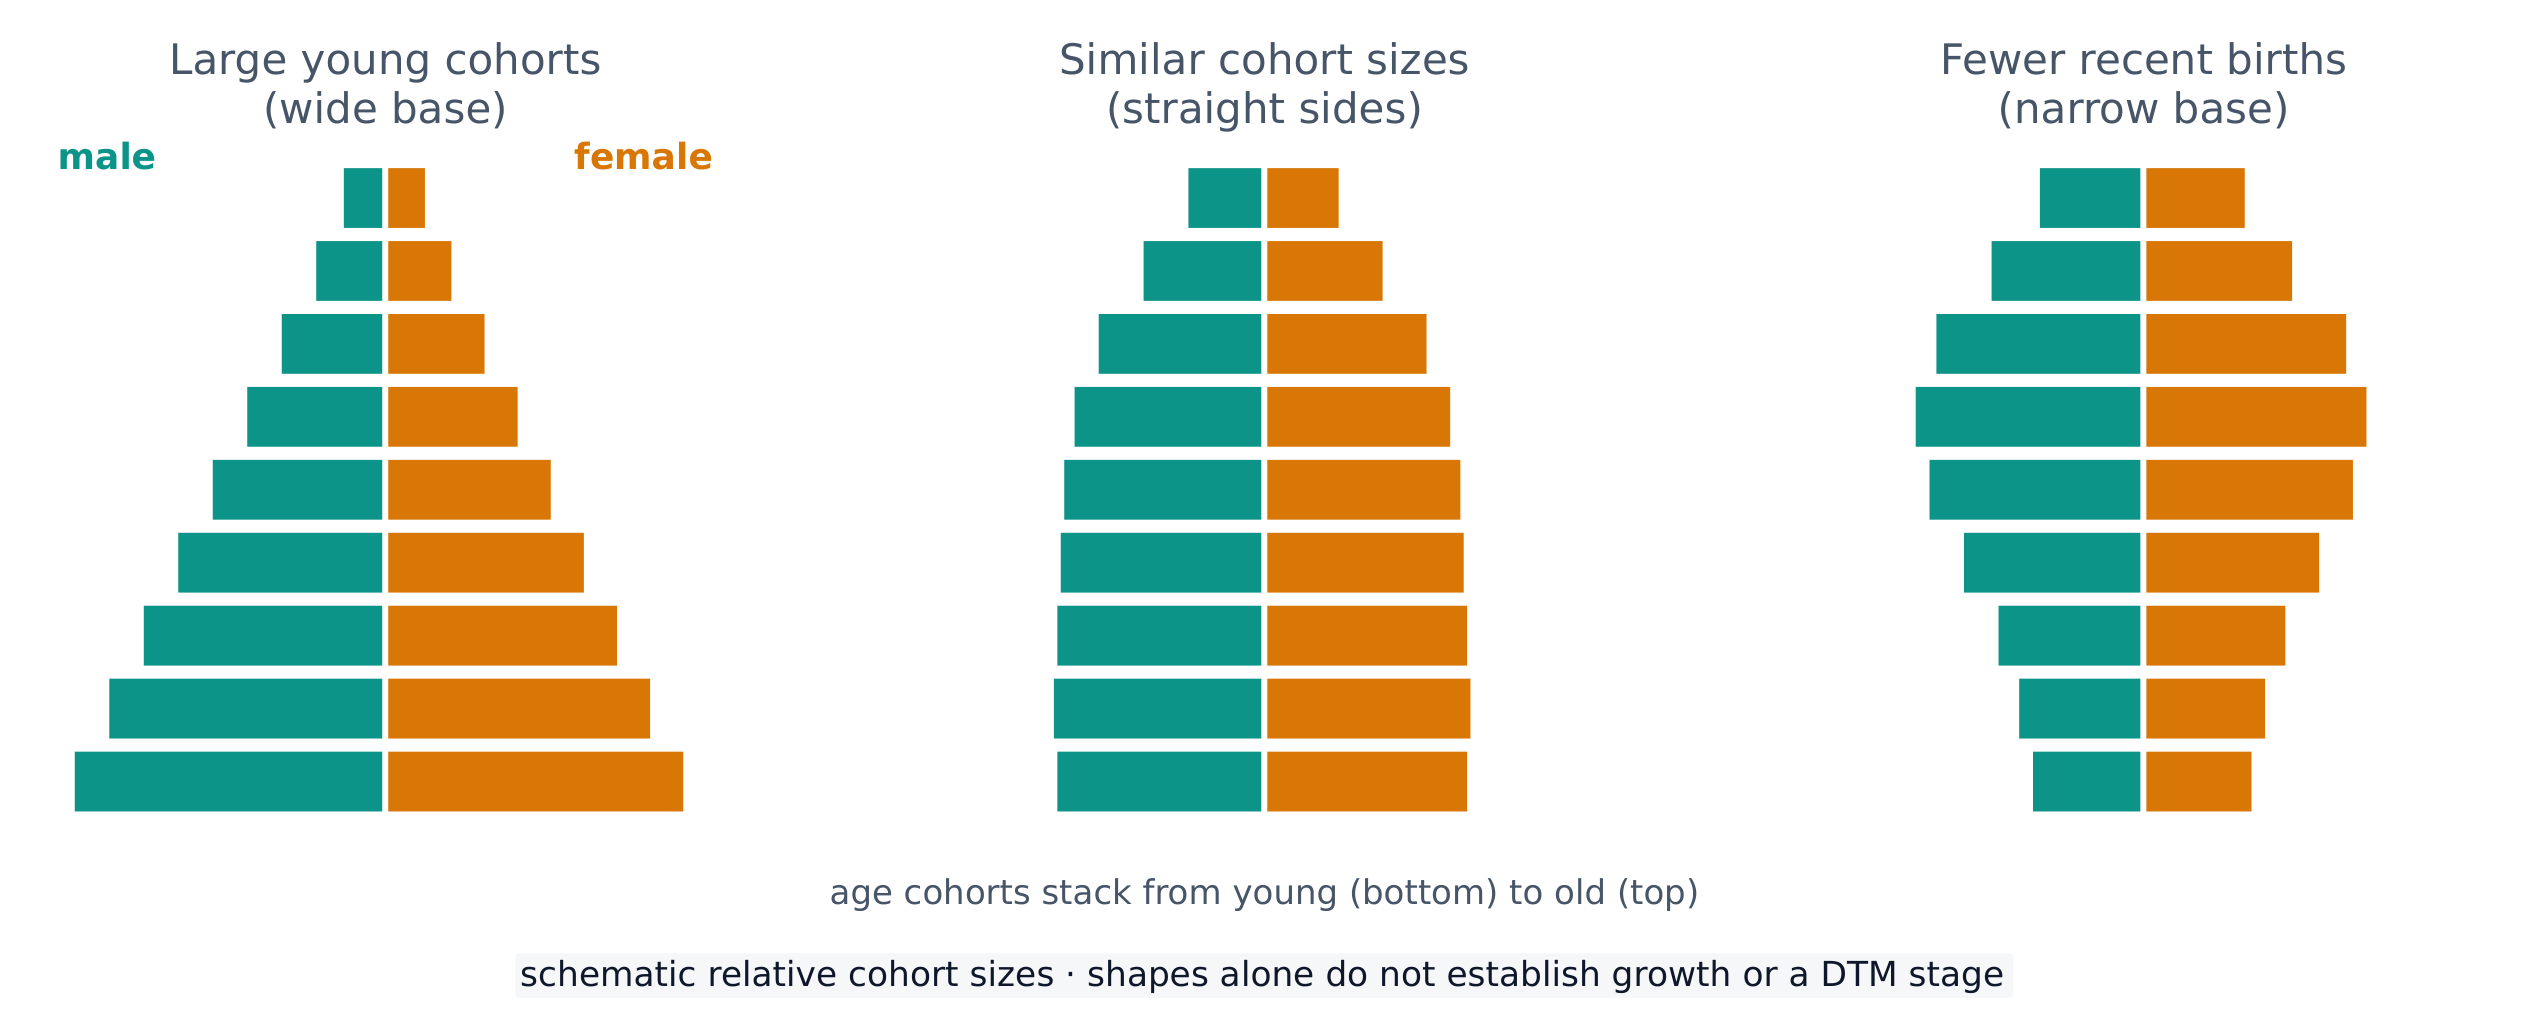
Population composition 人口构成 is the make-up of a population by age and sex. It is shown on a population pyramid 人口金字塔 — back-to-back bar charts of males and females in five-year age cohorts 年龄组.
A wide base shows a large young cohort relative to older cohorts, often consistent with recent high fertility. Similar cohort sizes can be consistent with slower growth. A narrow base indicates fewer recent births relative to older cohorts. Migration, mortality and past birth fluctuations can also shape the bars. Check whether widths show numbers or percentages, and use births, deaths and migration to test a forecast. Shape alone cannot establish a DTM stage.
The dependency ratio 抚养比 is an age-based indicator: people aged 0–14 plus people aged 65+, divided by those aged 15–64, multiplied by 100. It is not a count of employed workers supporting actual nonworkers. Some younger or older people work; some working-age adults do not.
Try it — original age dataset. A town has 3,000 people aged 0–14, 6,000 aged 15–64 and 1,000 aged 65+. Calculate total and elderly dependency ratios. Explain one limit of interpreting them as financial burdens.
Worked check. Let $Y$, $W$ and $O$ denote these three age groups.
There are about 67 people in the two dependent-age groups per 100 working-age people.
There are about 17 older people per 100 working-age people. Employment, income, health and public provision are additional evidence needed to assess support costs.
| English |
|---|
| Population composition/ˌpɒpjʊˈleɪʃn ˌkɒmpəˈzɪʃn/ |
| population pyramid/ˌpɒpjʊˈleɪʃn ˈpɪrəmɪd/ |
| age cohorts/eɪdʒ ˈkəʊhɔːts/ |
| dependency ratio/dɪˈpendənsi ˈreɪʃɪəʊ/ |
| Enduring Understanding | Learning Objective | Essential Knowledge |
|---|---|---|
IMP-2 | IMP-2.A |
|
Source: College Board AP Course and Exam Description
Populations change through births, deaths, and migration. Key rates (per 1,000 people per year):
The doubling time 倍增时间 is approximately 70 divided by a constant positive annual percentage growth rate. Using RNI alone assumes migration is excluded. Zero or negative growth has no finite doubling time under those assumptions. Fertility below replacement does not require immediate population decline: a large reproductive-age cohort can sustain births (population momentum), and immigration can add population.
Try it — original annual rates. A fictional country has CBR 37 and CDR 12 per 1,000 per year. Find natural increase and approximate doubling time, assuming unchanged rates and no migration.
Extension. Another fictional country starts with 100,000 residents, records 800 births, 1,100 deaths, 2,000 immigrants and 700 emigrants during the year. Does negative natural increase mean its population falls?
Natural change is −300, net migration is +1,300, and total population rises to 101,000. The crude rate denominator is commonly the midyear population; do not silently substitute the starting population when interpreting official rates.
Exam connection — 2023 AP Human Geography, Set 1, Question 1(D). "Explain ONE reason why the rate of natural increase (RNI) in urban areas may vary significantly from RNI in rural areas in the same country." (2023) One possible explanation, consistent with the official scoring guidance: "In cities the cost of living — housing, schooling, childcare — is higher, so urban families tend to have fewer children. Fewer births lower the crude birth rate, so the urban RNI falls below the rural RNI, where children still help with farm work." Notice the shape: the command word Explain wants a cause-and-effect chain, so you must name the reason and follow it all the way to the RNI. “Cities are expensive” alone leaves the link to births and RNI unexplained. Apply the question’s specific scoring guidance rather than a universal mark rule.
| English |
|---|
| Crude birth rate (CBR)/kruːd bɜːθ reɪt/ |
| crude death rate (CDR)/kruːd deθ reɪt/ |
| Rate of natural increase (RNI)/reɪt ɒv ˈnætʃərəl ˈɪŋkriːs/ |
| Total fertility rate (TFR)/ˈtəʊtl fɜːˈtɪlɪti reɪt/ |
| replacement level/rɪˈpleɪsmənt ˈlevl/ |
| doubling time/ˈdʌblɪŋ taɪm/ |
| Enduring Understanding | Learning Objective | Essential Knowledge |
|---|---|---|
IMP-2 | IMP-2.B |
|
Source: College Board AP Course and Exam Description
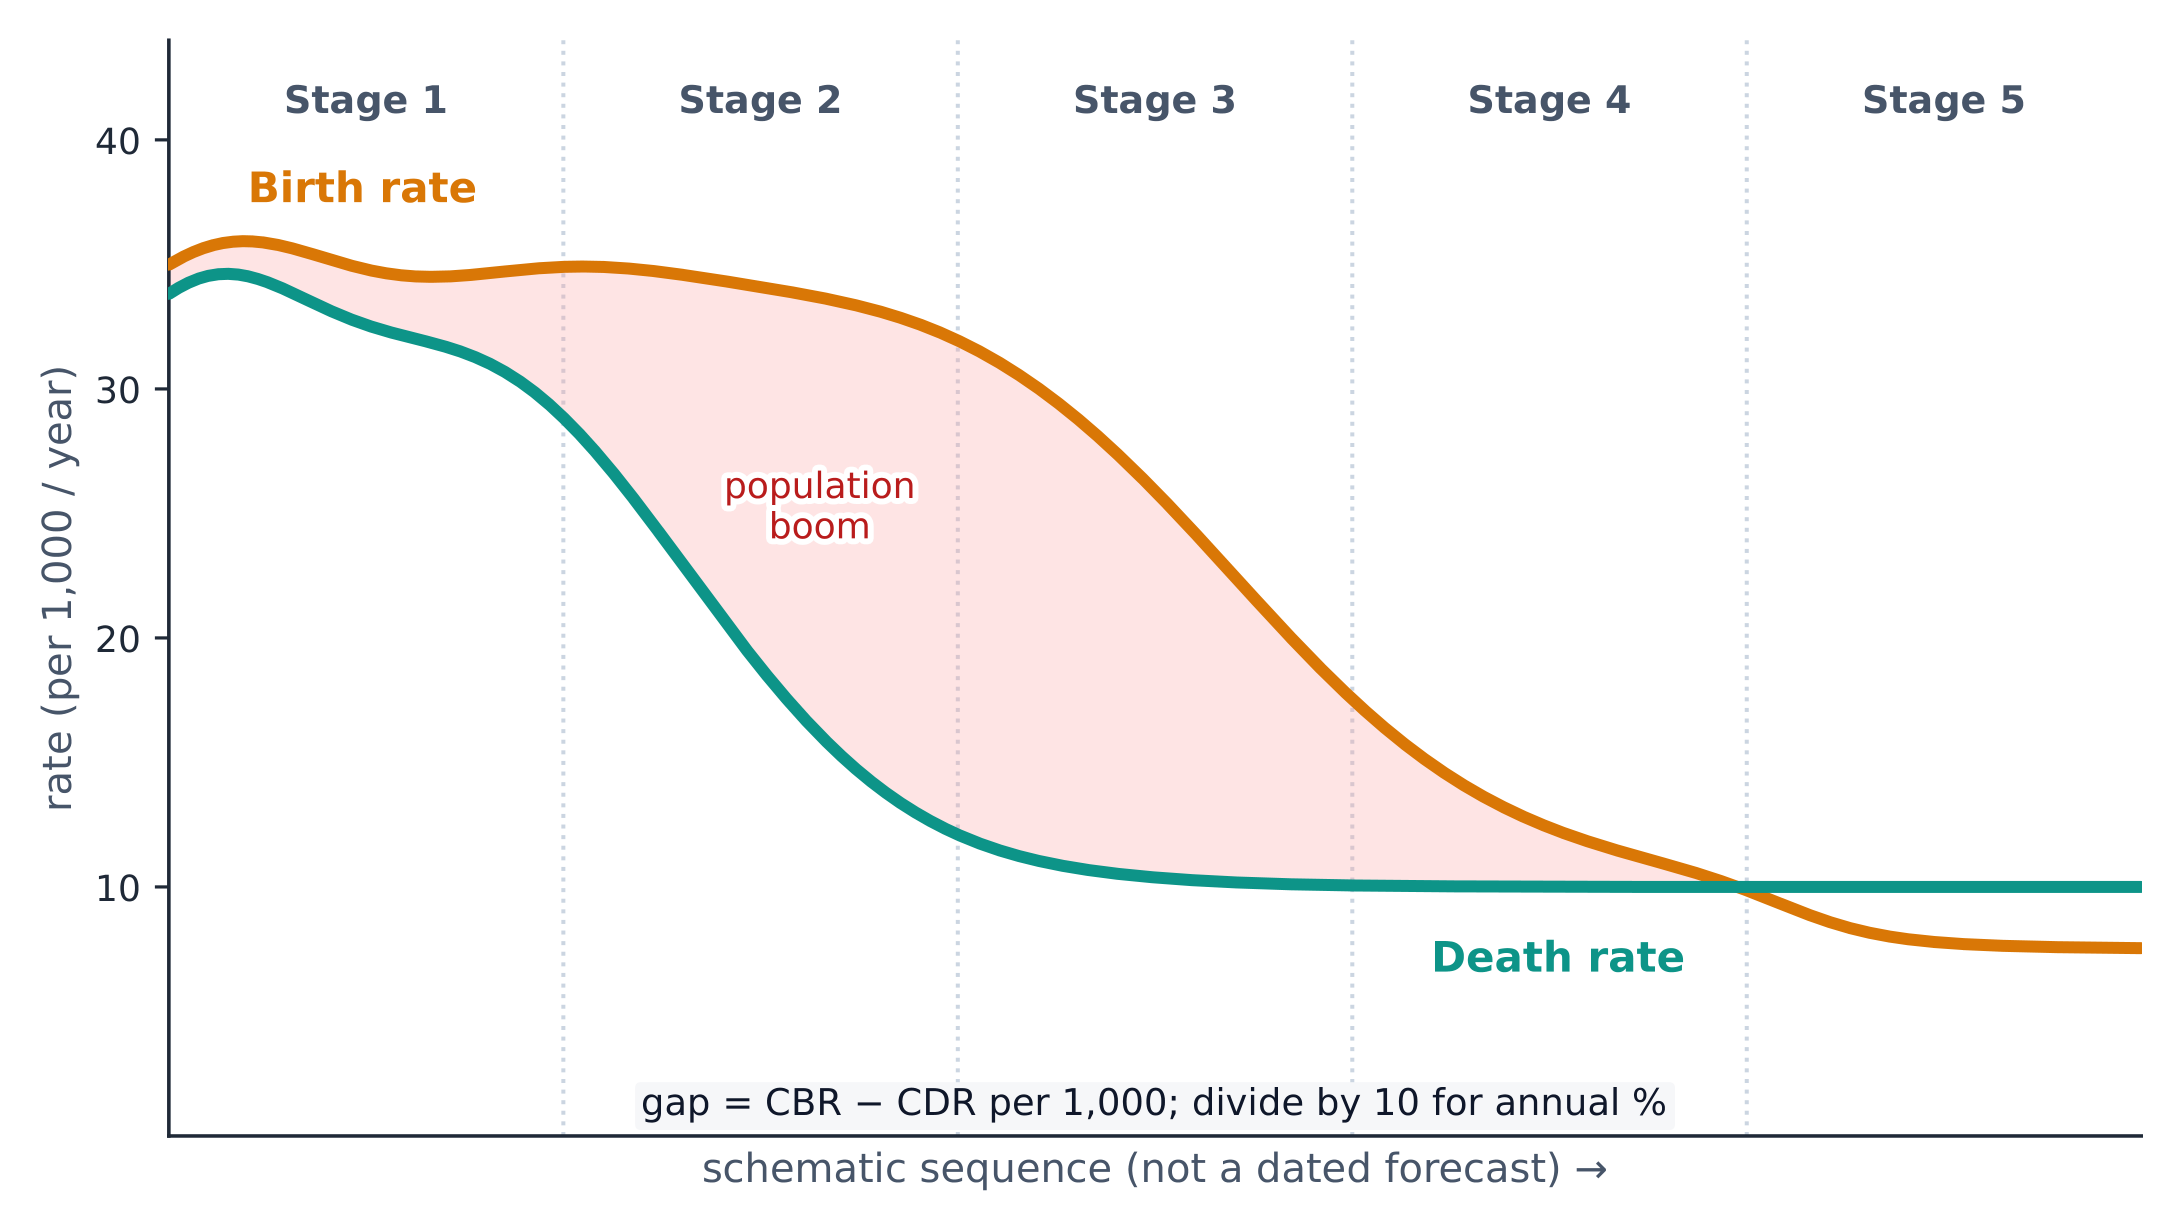
The Demographic Transition Model (DTM) 人口转变模型 models a historical pattern of changing birth and death rates. The five stages below are a common extension of the four-stage model. They are not a compulsory sequence or a dated prediction for every country.
The linked epidemiological transition 流行病学转变 describes how the main causes of death shift from infectious disease to chronic, degenerative disease as mortality patterns change. Infectious and chronic diseases can coexist; outbreaks and unequal access to care complicate a simple sequence.
| English |
|---|
| Demographic Transition Model (DTM)/ˌdeməˈɡræfɪk trænˈsɪʃn ˈmɒdl/ |
| epidemiological transition/ˌepɪˌdemɪəˈlɒdʒɪkl trænˈsɪʃn/ |
| Enduring Understanding | Learning Objective | Essential Knowledge |
|---|---|---|
IMP-2 | IMP-2.B |
|
Source: College Board AP Course and Exam Description
In 1798 Thomas Malthus argued that population grows exponentially 指数式 while food supply grows only linearly 线性, so population would outrun food and be checked by famine, disease, and war.
Critics say Malthus underestimated technology: the Green Revolution and modern farming raised food output enormously. Neo-Malthusians 新马尔萨斯主义者 update the worry to include water, energy, and other finite resources. Food insecurity also depends on poverty, distribution, conflict and access, not only global production. Evaluate the assumptions of each argument against evidence rather than treating either as a universal forecast.
Original evaluation task. Harvest output rises, yet some households cannot afford food; drought reduces local water supply. Rising yields challenge a fixed linear-food assumption, but income and distribution may still limit food access. Local water constraints require separate supply-and-demand evidence. The observations do not establish one universal explanation.
| English |
|---|
| exponentially/ˌekspəˈnenʃəli/ |
| linearly/ˈlɪnɪəli/ |
| Neo-Malthusians/ˈniːəʊ mælˈθjuːzɪənz/ |
| Enduring Understanding | Learning Objective | Essential Knowledge |
|---|---|---|
SPS-2 | SPS-2.A |
|
Source: College Board AP Course and Exam Description
Governments try to influence population growth with policies:
Immigration policies also affect population size and composition. A hypothetical expansion of temporary nurse visas may fill vacancies if qualifications are recognised, while selecting particular ages and occupations. Evaluate actual arrivals, departures and visa duration; admission targets alone do not establish permanent settlement or total growth.
Original policy evaluation. A government offers childcare subsidies; five years later births rise, while a large cohort enters reproductive ages. Lower childcare costs might enable more desired births per woman; alternatively, more potential parents can increase births with unchanged fertility rates. Compare age-specific fertility or TFR and reproductive-age cohort sizes. The birth count alone does not establish a policy effect; timing, economic conditions and other policies also matter.
Policies have unintended consequences: fertility reductions can contribute to later aging; sex-selective behaviour can interact with birth restrictions and son preference. Outcomes depend on implementation and social conditions. A later pro-natal policy is one possible response, not an inevitable requirement.
| English |
|---|
| Pro-natalist/prəʊ ˈneɪtəlɪst/ |
| Anti-natalist/ˈænti ˈneɪtəlɪst/ |
| Enduring Understanding | Learning Objective | Essential Knowledge |
|---|---|---|
SPS-2 | SPS-2.B |
|
| Enduring Understanding | Learning Objective | Essential Knowledge |
|---|---|---|
SPS-2 | SPS-2.C |
|
Source: College Board AP Course and Exam Description
Female education, employment, reproductive agency and access to healthcare can influence fertility. Longer schooling may delay first births; paid work can change the costs of childcare. Outcomes also depend on desired family size, childcare support, norms and access to voluntary family planning. Association across places alone does not establish causation for individuals.
Women’s access to study and employment can also change migration routes; healthcare access can influence maternal survival and mortality. Historical migration generalisations need to be tested against these changing social and economic roles.
At the other end, aging populations 人口老龄化 (a rising share aged 65+) bring their own challenges: higher pension and healthcare costs, possible labour shortages, and a higher elderly dependency ratio. The workforce need not shrink if participation, retirement patterns or migration change. Countries respond with later retirement, immigration, or pro-natal policies.
| English |
|---|
| aging populations/ˈeɪdʒɪŋ ˌpɒpjʊˈleɪʃnz/ |
| Enduring Understanding | Learning Objective | Essential Knowledge |
|---|---|---|
IMP-2 | IMP-2.C |
|
| Enduring Understanding | Learning Objective | Essential Knowledge |
|---|---|---|
IMP-2 | IMP-2.D |
|
Source: College Board AP Course and Exam Description
Migration 迁移 involves a change of residence and may be permanent or temporary. The AP course also includes seasonal livestock movement (transhumance); distinguish such movement from daily commuting. It is driven by push factors 推力 (reasons to leave: war, poverty, disaster) and pull factors 拉力 (reasons to arrive: jobs, safety, family).
Other course-required types can overlap: chain migration follows family or community networks; step migration proceeds through intermediate destinations; a guest worker moves under temporary labour arrangements; transnational migration involves movement and ties across countries; transhumance is seasonal movement of livestock and herders between grazing areas. Internal and rural-to-urban describe spatial routes rather than motives.
Original classification task. A nurse follows a cousin to another country for a temporary job, but accepts work in a closer city on the way. The cousin’s network is a chain mechanism, the temporary labour arrangement is a guest-worker example, and the closer job is an intervening opportunity. Visa costs can be an intervening obstacle. Several labels can describe one case.
Migration can be international (between countries) or internal (within a country, such as rural-to-urban).
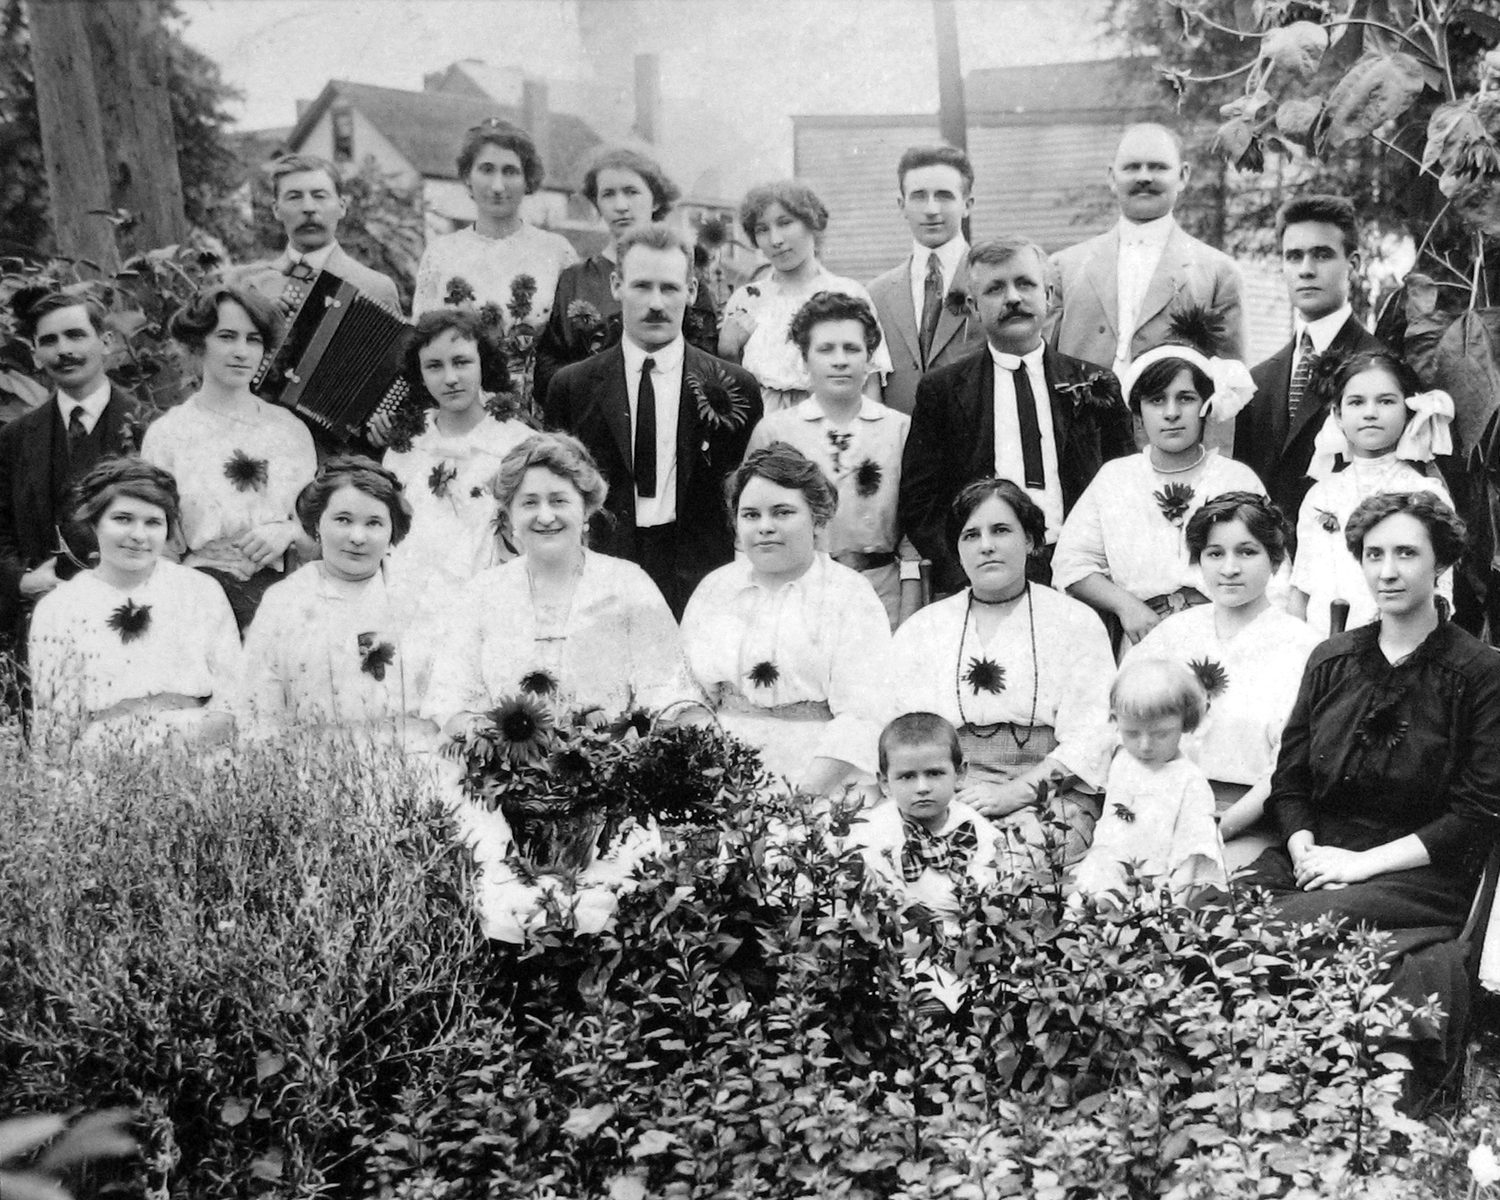
A push factor drives people away from the origin; a pull factor draws them toward the destination.
| English |
|---|
| Migration/maɪˈɡreɪʃn/ |
| push factors/pʊʃ ˈfæktəz/ |
| pull factors/pʊl ˈfæktəz/ |
| Voluntary migration/ˈvɒləntəri maɪˈɡreɪʃn/ |
| Forced migration/fɔːst maɪˈɡreɪʃn/ |
| refugees/ˈrefjuːdʒiːz/ |
| Enduring Understanding | Learning Objective | Essential Knowledge |
|---|---|---|
IMP-2 | IMP-2.E |
|
Source: College Board AP Course and Exam Description
Migration reshapes both the origin and the destination.
Original effects task. A fictional district loses 200 nurses to overseas jobs; 150 send money home. Identify a benefit and a cost to the origin, then specify evidence needed to assess the destination.
Worked explanation. Remittances can help recipient households pay for housing or schooling. The loss of nurses may reduce staffing if training and recruitment do not replace them. The destination may fill vacancies, but the effect depends on recognition of qualifications and job allocation. Evidence about vacancies, wages, housing capacity and public investment is needed; the migrant count alone proves none of these outcomes. Political responses can include disputes over admissions or services; cultural changes can include new language networks and food businesses. Avoid assuming hostility or integration is universal.
| English |
|---|
| brain drain/breɪn dreɪn/ |
| remittances/rɪˈmɪtənsɪz/ |
Use the stated population, area and time period. Distinguish natural increase from total growth. Check the population pyramid’s axes and scale before explaining a pattern. Describe what the evidence shows before proposing a mechanism. For migration, separate movement type, cause, legal category and effects; answer the specified place and group rather than assuming every question requires both endpoints.
Work through it step by step, with instant-check exercises.
Loading subjects…