| Enduring Understanding | Learning Objective | Essential Knowledge |
|---|---|---|
IMP-1 | IMP-1.A |
|
Thinking Geographically
AP Human Geography · Topic 1
 8:14
8:14
Thinking Geographically
Look at Greenland on a classroom world map. It looks about the size of Africa. It is not. Africa is fourteen times larger. <slow>The map is not lying to you by…
English narration · English + 中文 subtitles burned in
1.1
Introduction to Maps
Syllabus
Source: College Board AP Course and Exam Description
Geography is the study of where things are and why they are there. Its most basic tool is the map 地图 — a flattened picture of some part of Earth's surface.
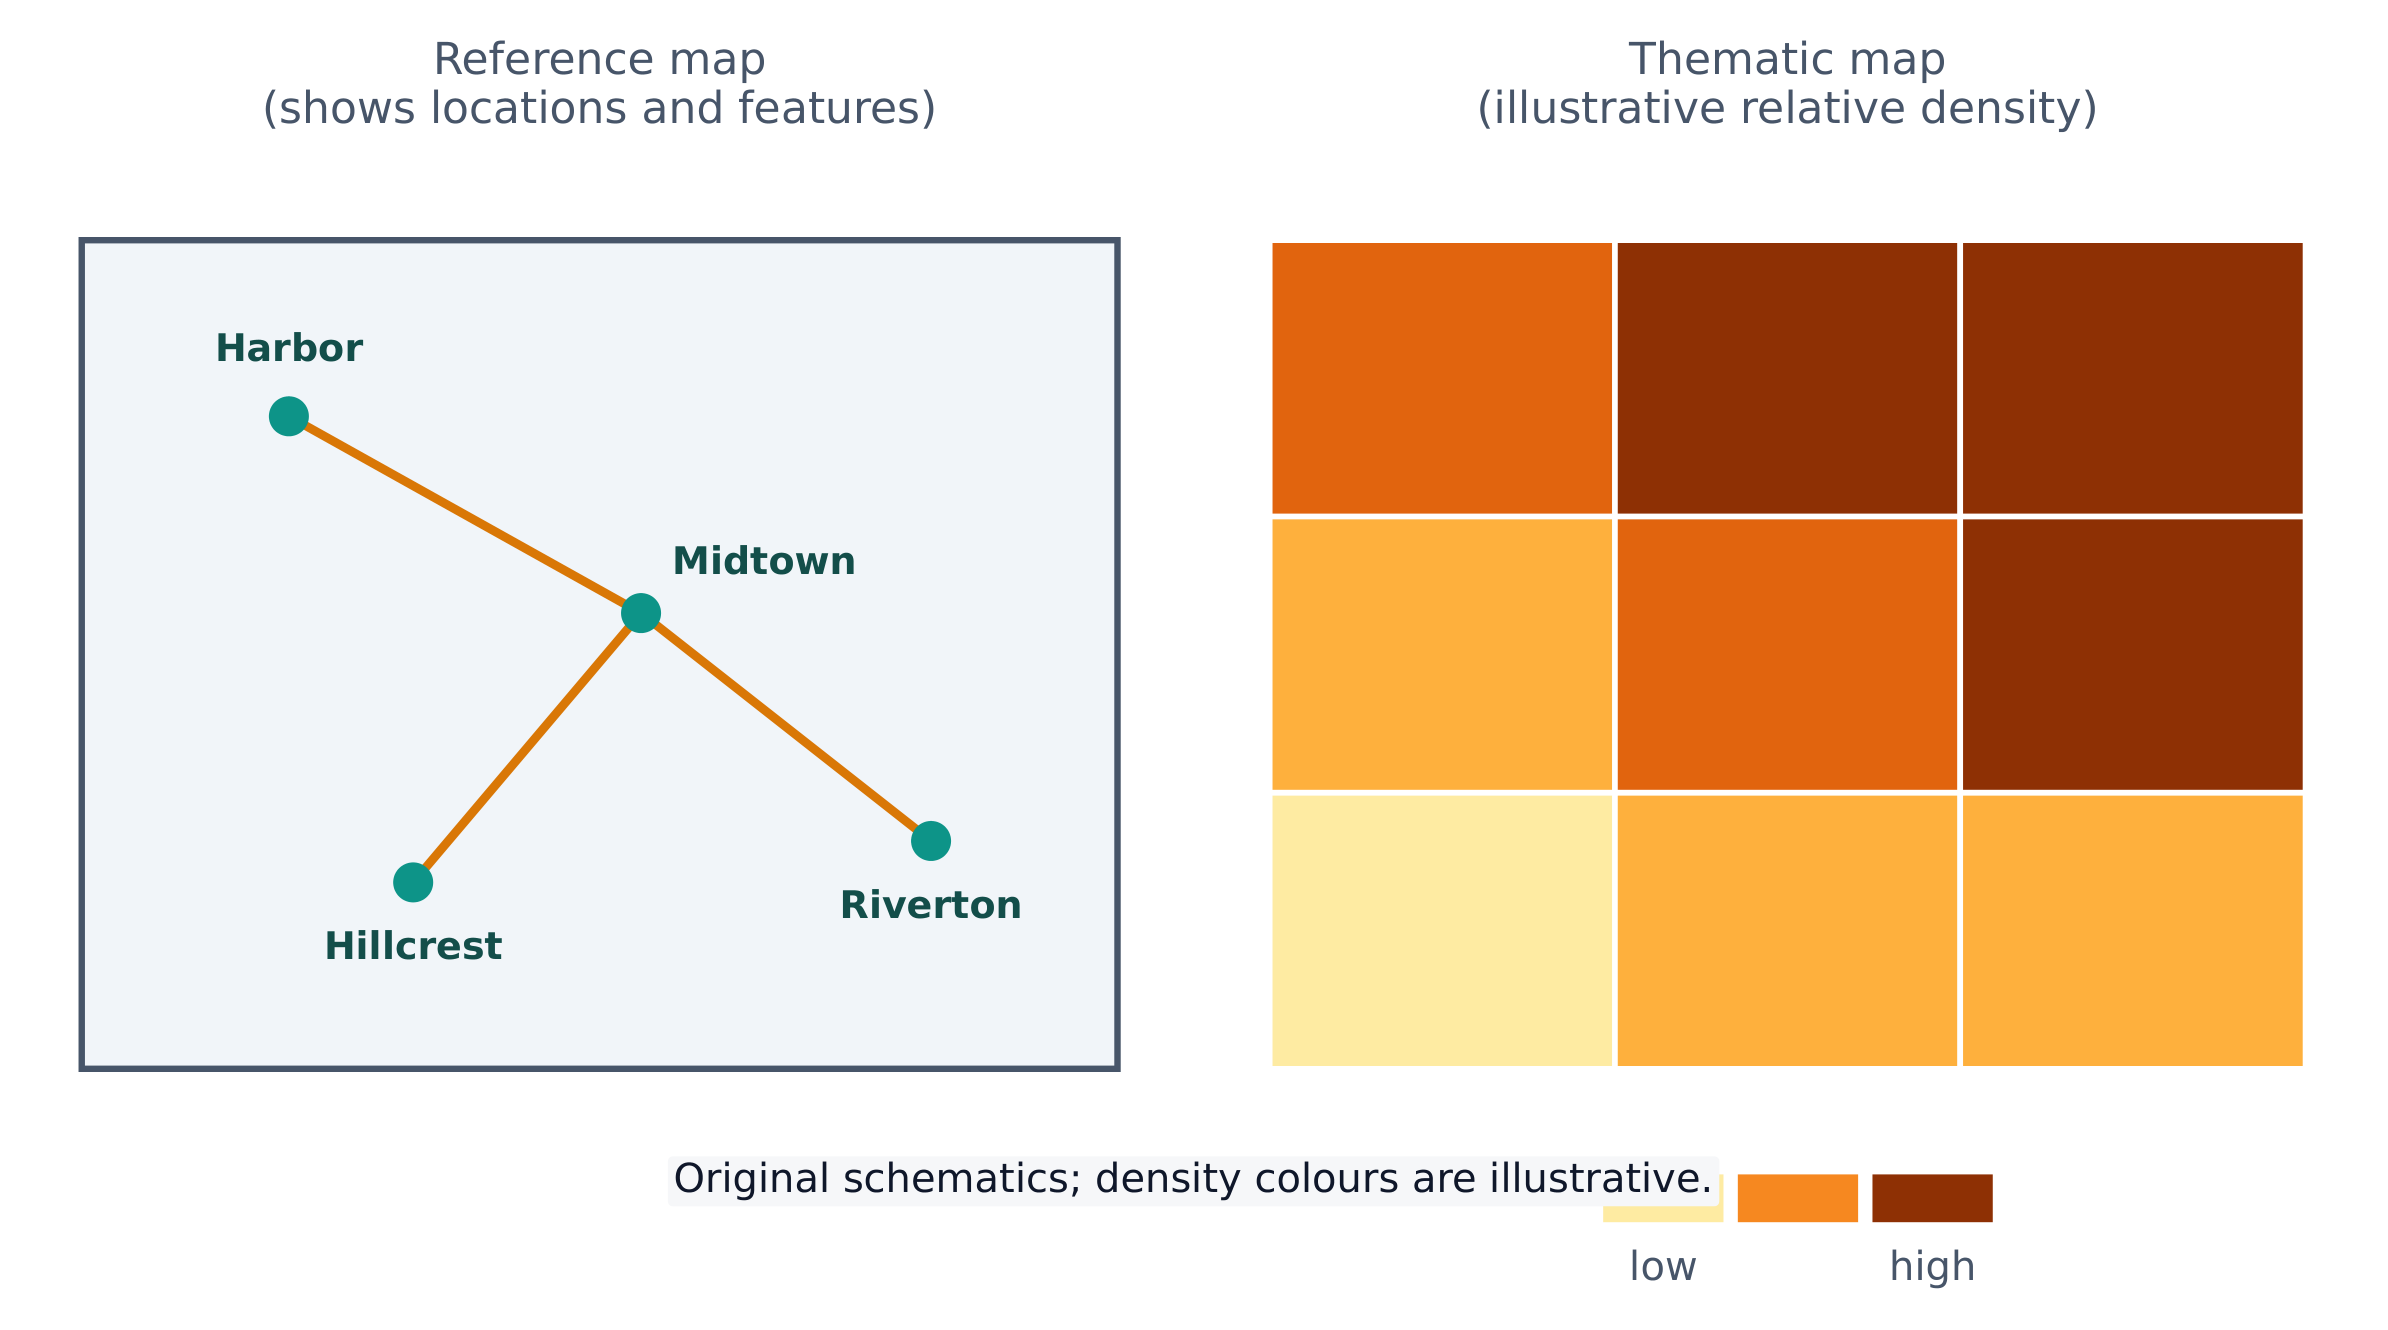
Maps come in two big families. A reference map 参考地图 shows locations and features — coastlines, borders, roads, cities (a road atlas or Google Maps). A thematic map 专题地图 shows how one variable changes across space — rainfall, income, or population density. AP Human Geography uses thematic maps constantly.
Because Earth’s surface is curved and a map is flat, every map uses a projection 投影 that stretches the globe onto paper. Projections always distort 扭曲 something — shape, area, distance, or direction. The Mercator projection 墨卡托投影 preserves local angles and represents constant-bearing routes as straight lines, useful in navigation. It greatly enlarges areas at high latitudes; it does not preserve all distances or make straight routes the shortest paths. There is no perfect projection; a cartographer chooses one that fits the map's purpose.
Vocabulary
Train
| English |
|---|
| map/mæp/ |
| reference map/ˈrefrəns mæp/ |
| thematic map/θiːˈmætɪk mæp/ |
| projection/prəˈdʒekʃn/ |
| distort/dɪˈstɔːt/ |
| Mercator projection/mɜːˈkeɪtə prəˈdʒekʃn/ |
1.2
Geographic Data

Syllabus
| Enduring Understanding | Learning Objective | Essential Knowledge |
|---|---|---|
IMP-1 | IMP-1.B |
|
Source: College Board AP Course and Exam Description
Geographic data 地理数据 is any information tied to a location. Geographers collect it in the field (counting, surveying, interviewing) and remotely with technology. Counts and travel times are quantitative 定量; interviews and descriptions can be qualitative 定性.
Key geospatial technologies 地理空间技术 you must know:
- GIS 地理信息系统 (Geographic Information System) — software that layers many kinds of spatial data so patterns can be compared.
- GPS 全球定位系统 (satellite navigation) — estimates a position using satellite signals. Accuracy depends on signal blockage, satellite geometry and receiver conditions (GPS.gov).
- Remote sensing 遥感 — gathers data from satellites or aircraft without touching the ground.
Data also comes from written sources: field observations, media reports, travel writing, policy documents, interviews, and photographs.
Vocabulary
Train
| English |
|---|
| Geographic data/ˌdʒɪəˈɡræfɪk ˈdeɪtə/ |
| geospatial technologies/ˌdʒiːəʊˈspeɪʃl tekˈnɒlədʒiz/ |
| GIS/ˌdʒiː aɪ ˈes/ |
| Remote sensing/rɪˈməʊt ˈsensɪŋ/ |
| GPS/ˌdʒiː piː ˈes/ |
| quantitative/ˈkwɒntɪteɪtɪv/ |
| qualitative/ˈkwɒlɪteɪtɪv/ |
1.3
The Power of Geographic Data
Syllabus
| Enduring Understanding | Learning Objective | Essential Knowledge |
|---|---|---|
IMP-1 | IMP-1.C |
|
Source: College Board AP Course and Exam Description
Data is powerful because it drives decisions. Businesses use it to choose store locations, governments use census data to plan schools and roads, and aid agencies use it to send help after a disaster.
Data collection and presentation involve choices. Who collects it, which categories they use, and how a map is drawn can all shape the message. A map can inform — or it can mislead — so ask where the data came from, what it measures, when it was collected and what it leaves out. This does not make every measurement equally unreliable.
1.4
Spatial Concepts
Syllabus
| Enduring Understanding | Learning Objective | Essential Knowledge |
|---|---|---|
PSO-1 | PSO-1.A |
|
Source: College Board AP Course and Exam Description
Geographers describe location and pattern with a precise vocabulary.
- Absolute location 绝对位置 is an exact address — latitude and longitude. Relative location 相对位置 describes a place by what is near it ("north of the river").
- Absolute distance is measured in kilometres; relative distance is measured in time, cost, or effort.
- Space–time compression 时空压缩 is the shrinking of the felt distance between places as transport and communication improve.
- Distance decay 距离衰减 means that interaction often decreases with increasing distance or travel cost, other factors being equal. Networks, barriers and the purpose of a journey can modify this tendency.
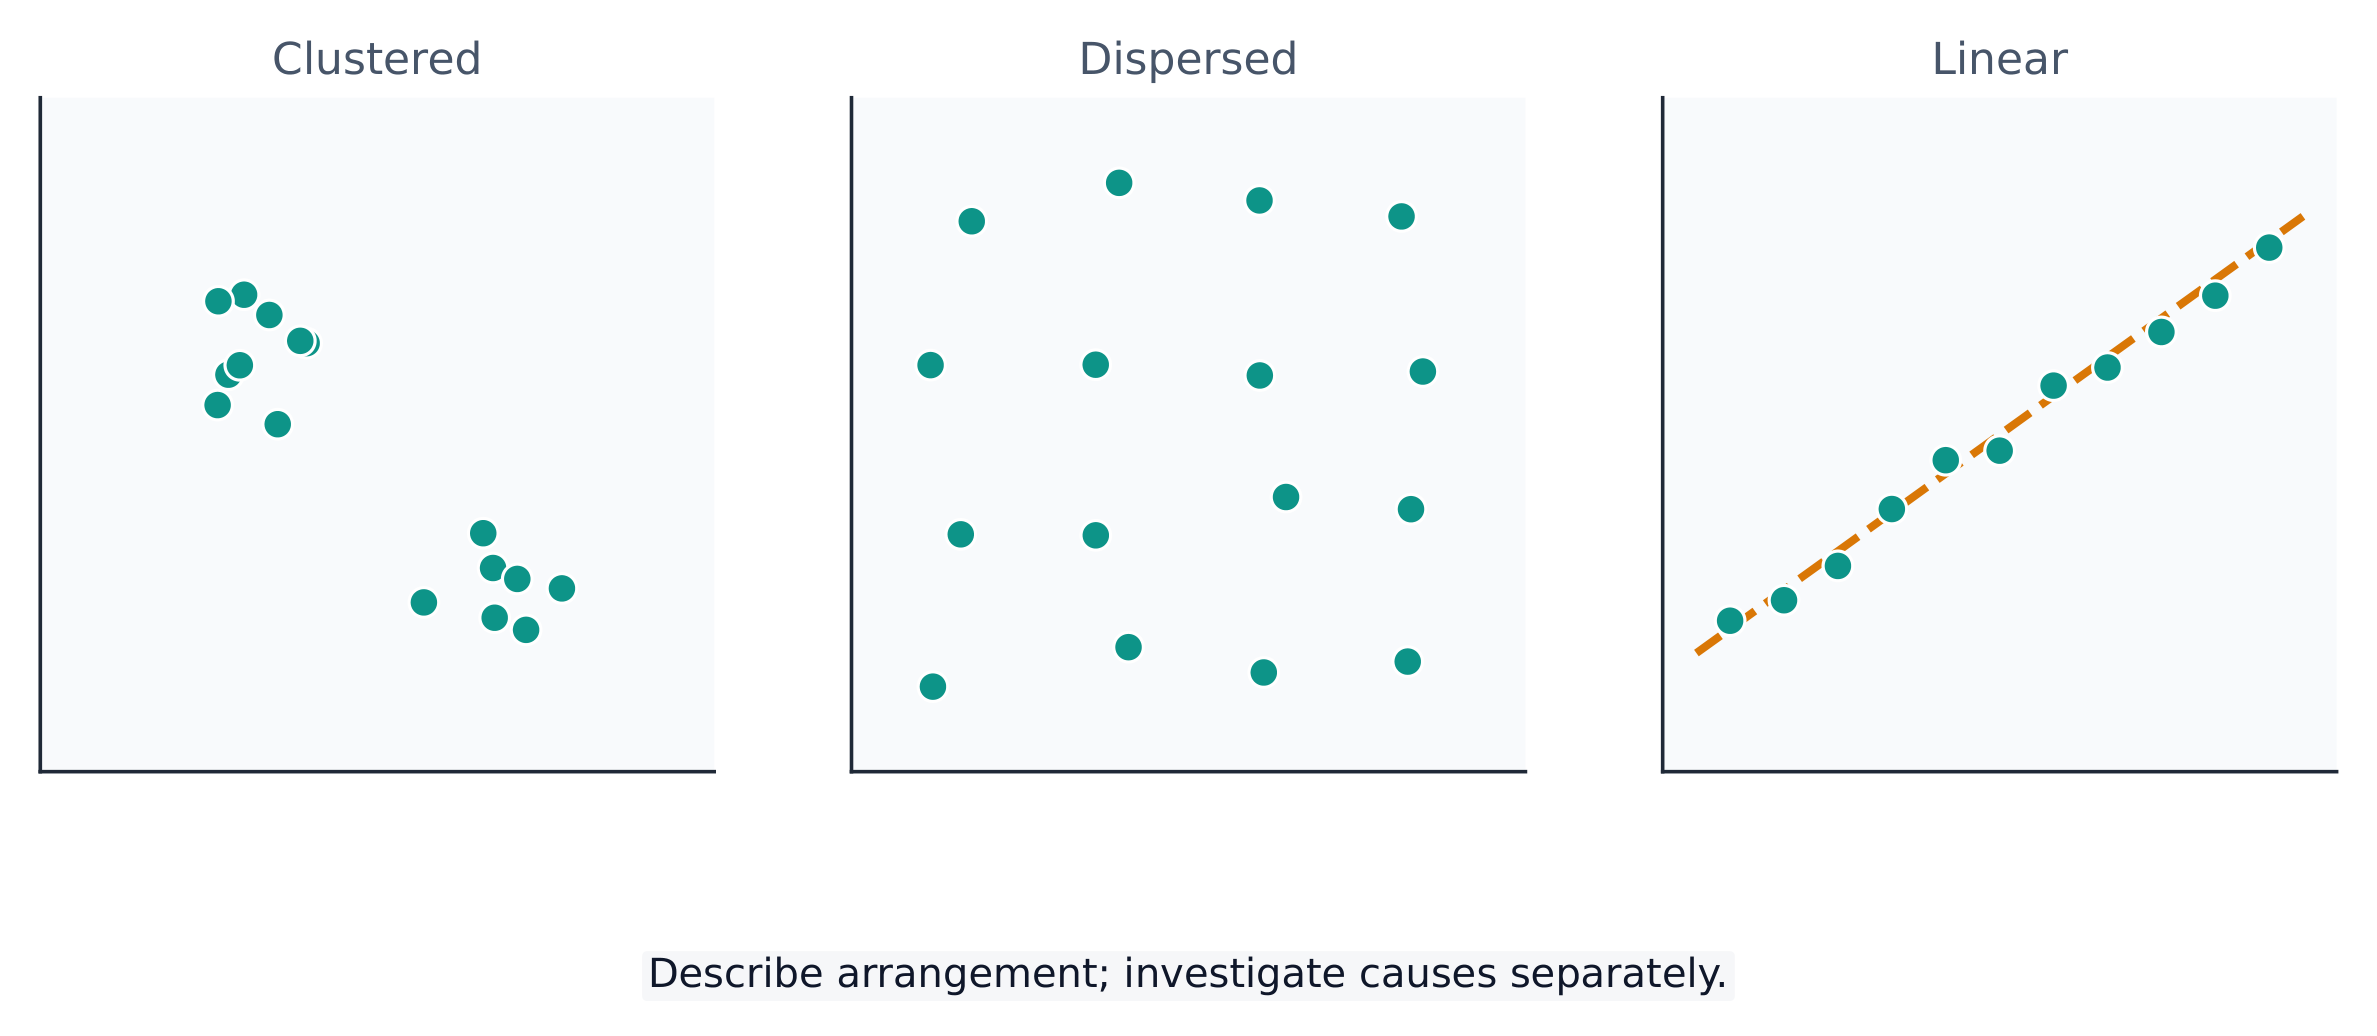
A spatial pattern 空间格局 is how things are arranged: clustered 聚集 (bunched together), dispersed 分散 (spread apart), or linear (along a line such as a road). Reading the pattern is the first step in explaining why it exists.
Vocabulary
Train
| English |
|---|
| Absolute location/ˈæbsəluːt ləʊˈkeɪʃn/ |
| Relative location/ˈrelətɪv ləʊˈkeɪʃn/ |
| Space–time compression/speɪs taɪm kəmˈpreʃn/ |
| Distance decay/ˈdɪstəns dɪˈkeɪ/ |
| spatial pattern/ˈspeɪʃl ˈpætn/ |
| clustered/ˈklʌstəd/ |
| dispersed/dɪˈspɜːst/ |
1.5
Human-Environmental Interaction

Syllabus
| Enduring Understanding | Learning Objective | Essential Knowledge |
|---|---|---|
PSO-1 | PSO-1.B |
|
Source: College Board AP Course and Exam Description
People and the environment shape each other. Two contrasting theories describe this:
- Environmental determinism 环境决定论 — the (now rejected) claim that the physical environment determines how a culture develops.
- Possibilism 可能论 — the view that the environment creates constraints and opportunities, while technology, culture and social choices influence responses. Choices are also shaped by resources and power; they are not unlimited.
The cultural landscape 文化景观 — farms, cities, and roads built on the land — is the visible result of this interaction. Sustainability asks how people can use natural resources without using them up.
Vocabulary
Train
| English |
|---|
| Environmental determinism/enˌvaɪrənˈmentl dɪˈtɜːmɪnɪzəm/ |
| Possibilism/ˈpɒsɪbɪlɪzəm/ |
| cultural landscape/ˈkʌltʃərəl ˈlændskeɪp/ |
1.6
Scales of Analysis
Syllabus
| Enduring Understanding | Learning Objective | Essential Knowledge |
|---|---|---|
PSO-1 | PSO-1.C |
|
PSO-1.D |
|
Source: College Board AP Course and Exam Description
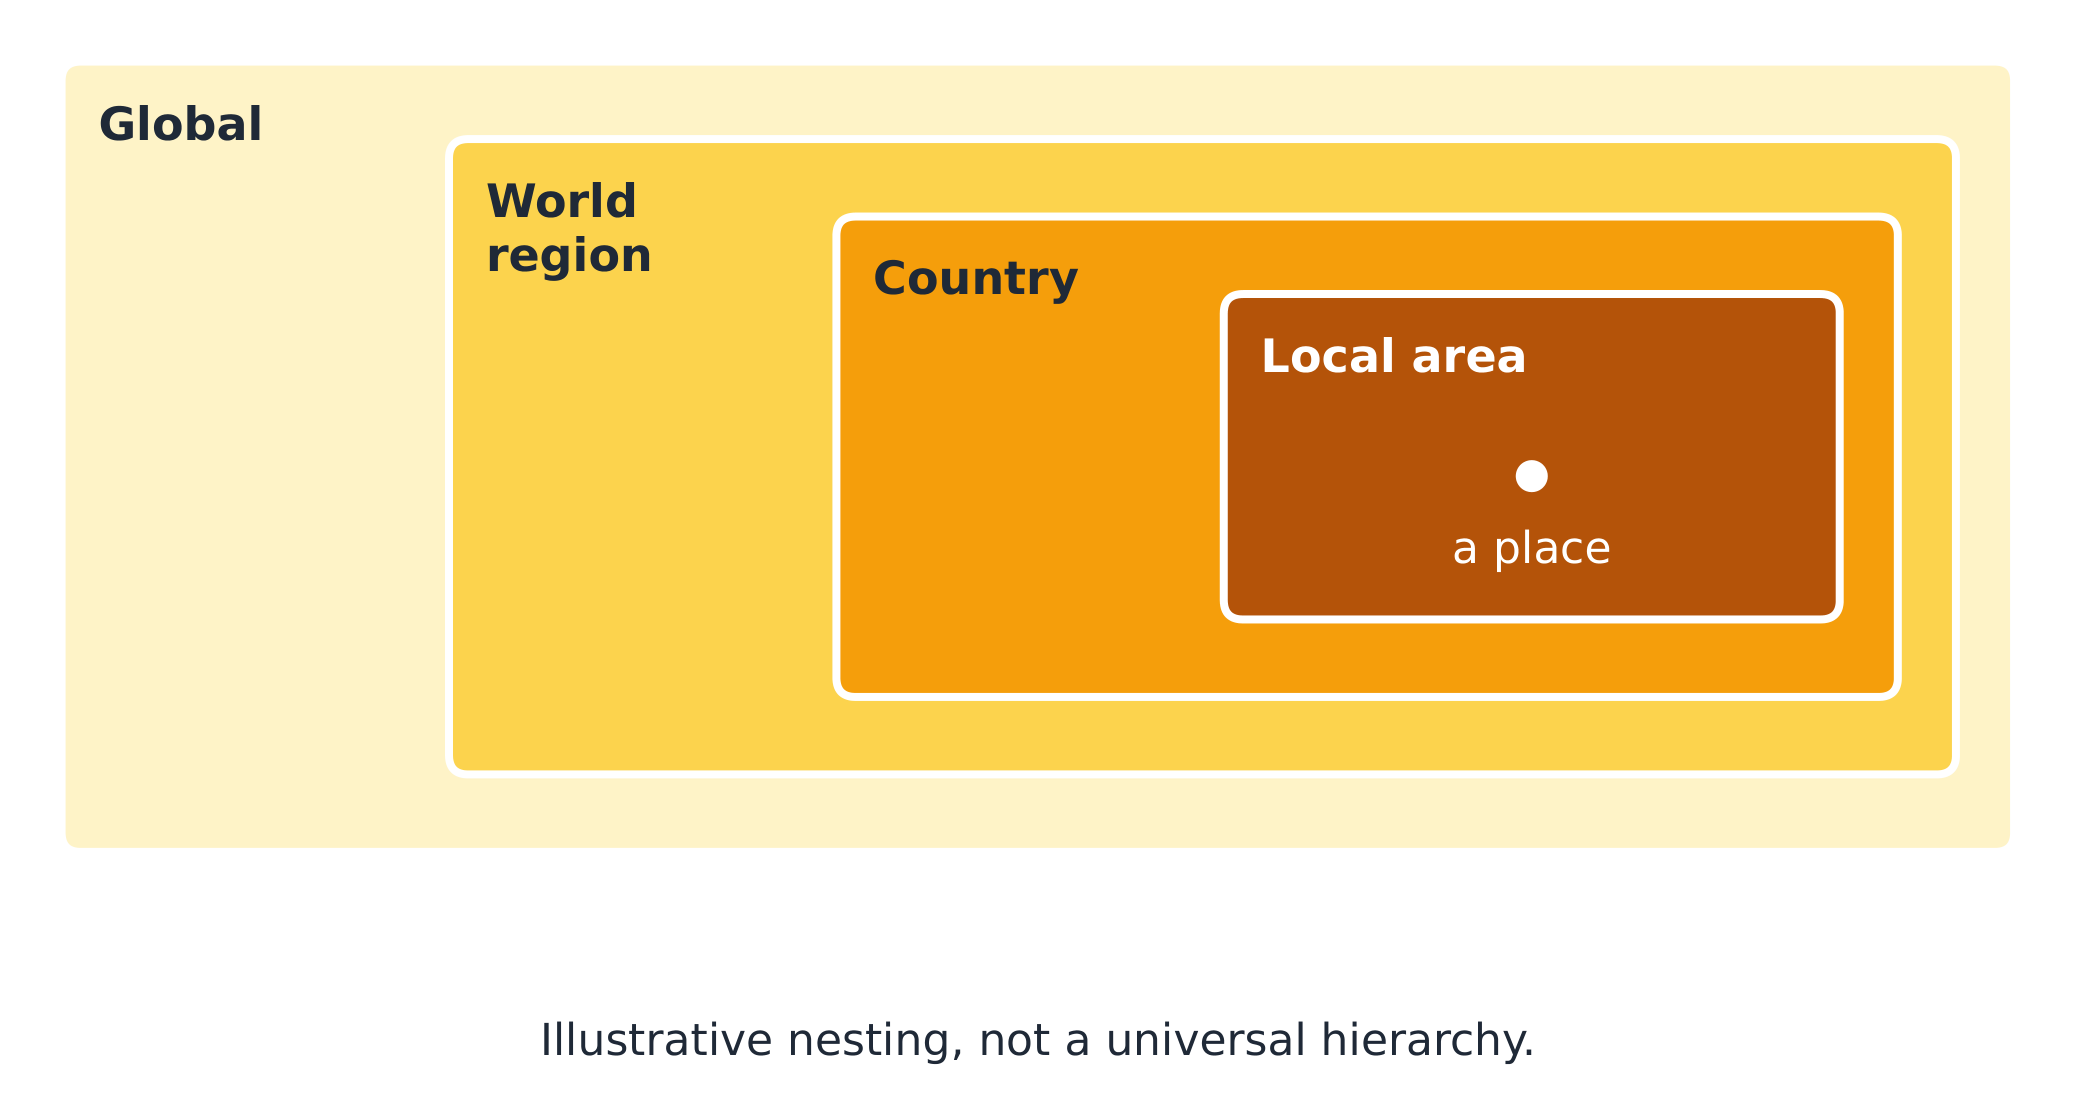
Scale of analysis 分析尺度 is the level at which you look at data — global, regional, national, or local. Patterns may appear different when observations are grouped at different levels. A region may cross national borders or lie within a country; the levels are not a single fixed nesting order. Scale of analysis differs from a map’s scale ratio, which relates a map length to a ground length.
For example, a country may look wealthy at the national scale, yet contain very poor neighbourhoods at the local scale. Comparing appropriately detailed data at several analysis levels can reveal patterns hidden in a national summary. Enlarging the same map does not add finer observations. Exam questions often ask you to explain a process "at various scales."
Original block-data workshop
These fictional blocks form one study district. Values are invented for teaching, not census evidence or a past-paper extract. Each block covers 10 hectares (ha). The flood-risk classes are supplied planning categories, not measured probabilities.
| Block | Area (ha) | Population | Flood risk |
|---|---|---|---|
| A | 10 | 200 | Low |
| B | 10 | 800 | High |
| C | 10 | 1000 | Low |
| D | 10 | 0 | High |
Attempt 1 — density and distribution: Calculate district density and compare the block densities. Explain what a district average conceals.
Worked check: Density is population divided by area: $D=P/A$. For the district, $D=2000/40=50$ people/ha. For A, $D=200/10=20$ people/ha; B, $D=800/10=80$ people/ha; C, $D=1000/10=100$ people/ha; D, $D=0/10=0$ people/ha. The average is not a claim that every block contains 50 people/ha. Density is a rate; distribution concerns where people are located.
Attempt 2 — aggregation: Group A+B and C+D. Calculate each group’s density. What difference disappears?
Worked check: For A+B, $D=(200+800)/(10+10)=50$ people/ha. For C+D, $D=(1000+0)/(10+10)=50$ people/ha. Both grouped units have the same density, yet the second combines the most populated block with an empty block. This aggregation 聚合 can conceal variation without changing the original observations.
Attempt 3 — decisions: A planner wants to prioritise flood-warning outreach. Use population and risk together. Identify one additional dataset needed before choosing an evacuation site.
Worked check: B combines a high-risk class with 800 residents; D has a high-risk class but no residents in the supplied table. B is therefore a stronger outreach priority on these criteria. Road access, route safety and site capacity would be needed for site selection; the table alone cannot establish a safe site. GIS can compare these layers; GPS can record field locations; remote sensing can provide imagery of conditions.
Original scale question: A map reports only the district total. Explain why it cannot establish each block’s density or represent every district in the country.
Worked response: Aggregation hides the differences among A–D, as their densities range from 0 to 100 people/ha. The study also covers only one district, so other districts may have different patterns. These are distinct limits: the level of grouping and the geographic extent of the evidence.
Vocabulary
Train
| English |
|---|
| Scale of analysis/skeɪl ɒv əˈnæləsɪs/ |
| aggregation/ˌæɡrɪˈɡeɪʃn/ |
1.7
Regional Analysis
Syllabus
| Enduring Understanding | Learning Objective | Essential Knowledge |
|---|---|---|
SPS-1 | SPS-1.A |
|
Source: College Board AP Course and Exam Description
A region 区域 is an area with one or more shared features that make it different from surrounding areas. Geographers use three types:
- Formal (uniform) region 均质区域 — defined using a selected shared characteristic or threshold (a country, a wheat-growing belt, a language area).
- Functional (nodal) region 功能区域 — organised around a central node, like a city and its commuter zone or a pizza shop's delivery area.
- Perceptual (vernacular) region 感知区域 — defined by people's feelings and beliefs, with fuzzy borders (the "American South", the "Middle East").
Regional definitions select characteristics or patterns of activity. They can draw on physical features, legal boundaries, networks or beliefs; boundaries may be transitional, overlapping or contested. State which definition you are applying rather than treating every boundary as arbitrary.
Explore
Sort each example into the right kind of region
A formal region shares one measured trait, a functional region is organised around a node, and a perceptual region is defined by people's feelings.
Vocabulary
Train
| English |
|---|
| region/ˈriːdʒn/ |
| Formal (uniform) region/ˈfɔːml ˈriːdʒn/ |
| Functional (nodal) region/ˈfʌŋkʃənl ˈriːdʒn/ |
| Perceptual (vernacular) region/pəˈseptʃuːəl ˈriːdʒn/ |
1.7
Exam tips
- Always name a map projection's trade-off: what it preserves versus distorts (Mercator preserves local angles and enlarges high-latitude area).
- State whether data is quantitative or qualitative, and match a source (GIS, GPS, remote sensing, census) to its use.
- Distinguish absolute from relative location, and use distance decay or time-space compression when the evidence supports that explanation.
- Mind the scale of analysis: a national average hides local variation — say so explicitly.
- When asked to classify a region, use formal, functional, or perceptual, and justify it by the defining trait.
1.7
Applied spatial reasoning
Original travel example: A new service reduces a 20 km trip from 40 minutes to 20 minutes. Absolute distance remains 20 km; travel time, a measure of relative distance, halves. This illustrates space–time compression, not a shrinking of Earth or proof that everyone has equal access to the service.
Original region examples: An area defined by at least 50% wheat-growing land is a formal region under that stated threshold; every farm need not grow wheat. A delivery zone connected to a shop is functional because it is organised around a node and activity. A region drawn from residents’ ideas about “the coast” is perceptual; respondents may disagree on its boundary. One area can be analysed in more than one way.
1.7
Sources for this lesson
Course scope: College Board, AP Human Geography Course and Exam Description, topics 1.1–1.7, local PDF pages 37–43 (syllabi/ap/ap_human_geography_CED.pdf). Projection qualifications: USGS projection uses and USGS working manual. Position accuracy: GPS.gov. All numerical practice and schematic maps are original teaching material, with no official scoring claim.
Interactive lessons on this topic
Work through it step by step, with instant-check exercises.