| Enduring Understanding | Learning Objective | Essential Knowledge |
|---|---|---|
ERT-3 | ERT-3.A |
|
Populations
AP Environmental Science · Topic 3
 7:45
7:45
Populations
In 1944, twenty-nine reindeer were released onto a small island. There were no predators, and the ground was thick with moss. Within twenty years there were…
English narration · English + 中文 subtitles burned in
3.1
Generalist and Specialist Species
Syllabus
Source: College Board AP Course and Exam Description
A generalist 广适性物种 can live in many habitats and eat many foods (raccoon, cockroach) – flexible, so it copes well with change. A specialist 狭适性物种 needs specific conditions or foods (panda, koala) – efficient in a stable habitat but very vulnerable if that habitat changes.
Vocabulary
Train
| English |
|---|
| generalist/ˈdʒenərəlɪst/ |
| specialist/ˈspeʃəlɪst/ |
3.2
K-Selected and r-Selected Species
Syllabus
| Enduring Understanding | Learning Objective | Essential Knowledge |
|---|---|---|
ERT-3 | ERT-3.B |
|
Source: College Board AP Course and Exam Description
Two reproductive strategies:
- $r$-selected species produce many offspring with little care, mature fast, and have short lives (insects, weeds). They colonize quickly and boom-and-bust.
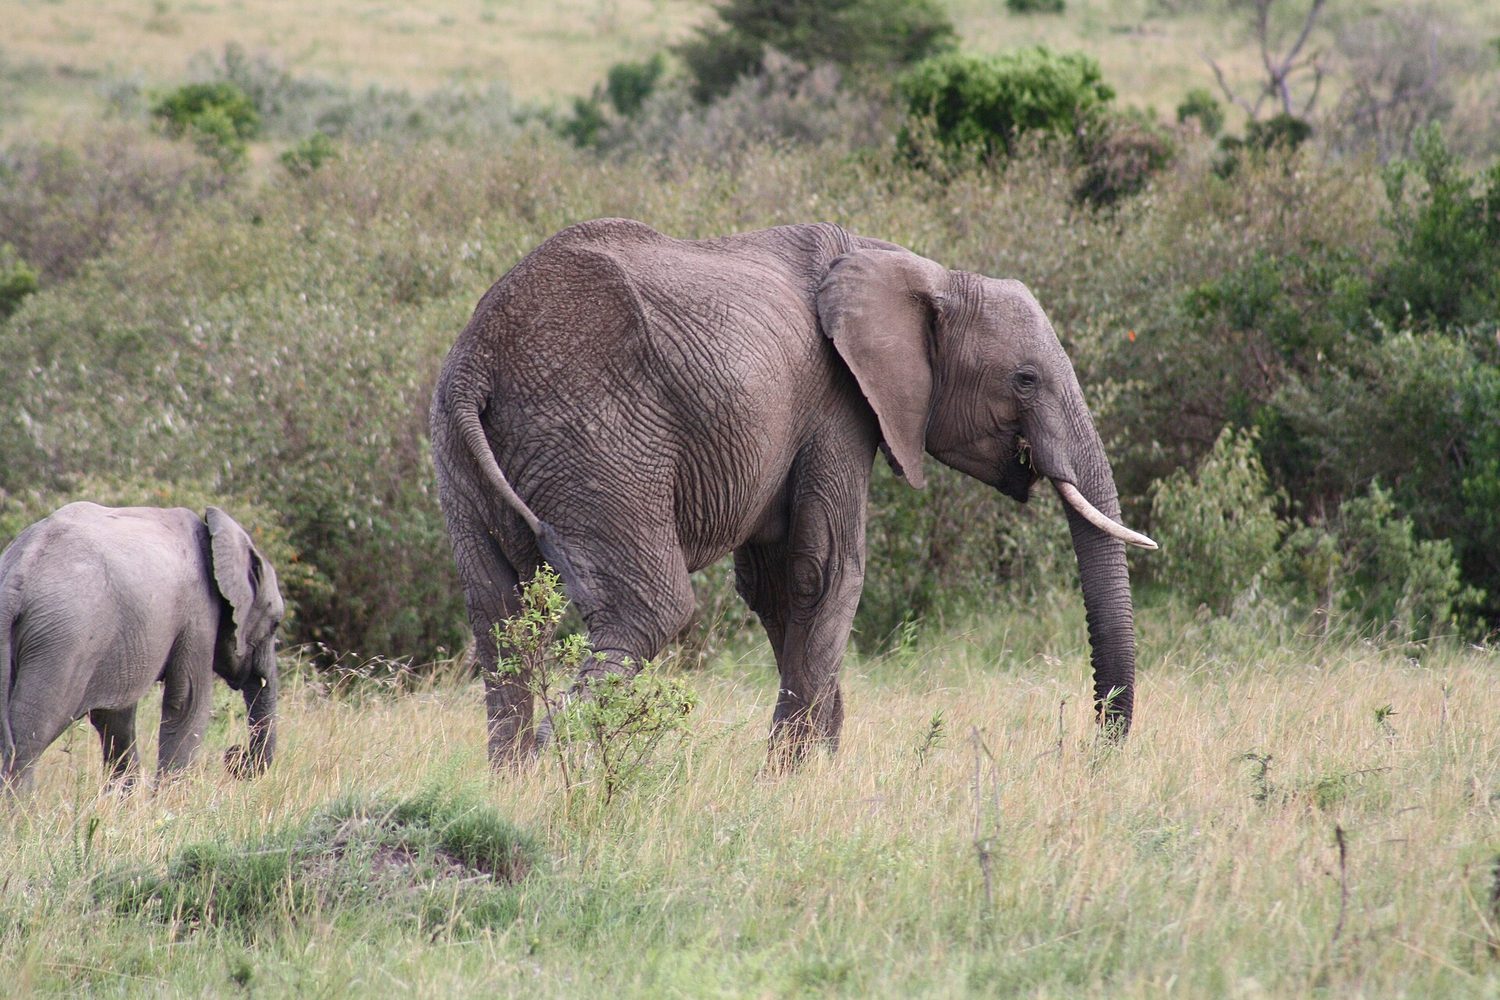
- $K$-selected species produce few offspring with much care, mature slowly, and live long (elephants, humans). They do well near carrying capacity in stable environments but recover slowly from losses.

3.3
Survivorship Curves
Syllabus
| Enduring Understanding | Learning Objective | Essential Knowledge |
|---|---|---|
ERT-3 | ERT-3.C |
|
Source: College Board AP Course and Exam Description
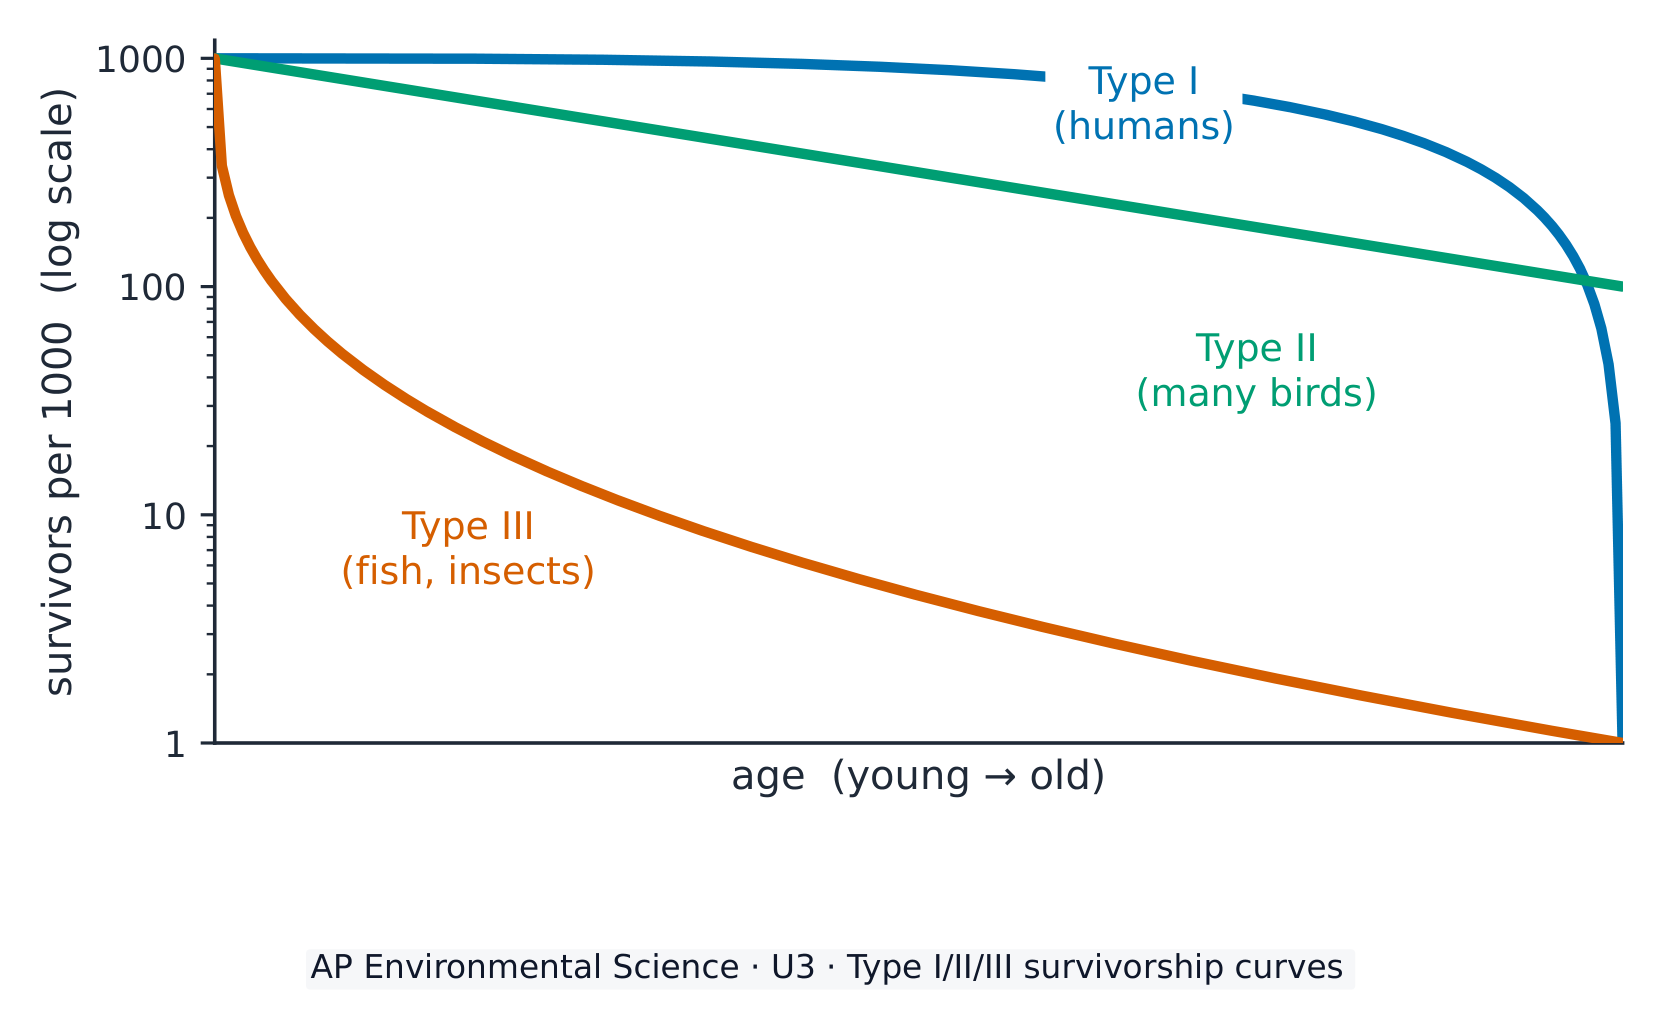
A survivorship curve 存活曲线 plots how many individuals survive at each age (on a log scale). Type I (humans): most survive to old age, then die – a convex curve. Type II (many birds): a constant death rate at all ages – a straight line. Type III ($r$-selected: fish, insects): most die young, a few survive – a concave curve.
Vocabulary
Train
| English |
|---|
| survivorship curve/səˈvaɪvəʃɪp kɜːv/ |
3.4
Carrying Capacity
Syllabus
| Enduring Understanding | Learning Objective | Essential Knowledge |
|---|---|---|
ERT-3 | ERT-3.D |
|
ERT-3.E |
|
Source: College Board AP Course and Exam Description
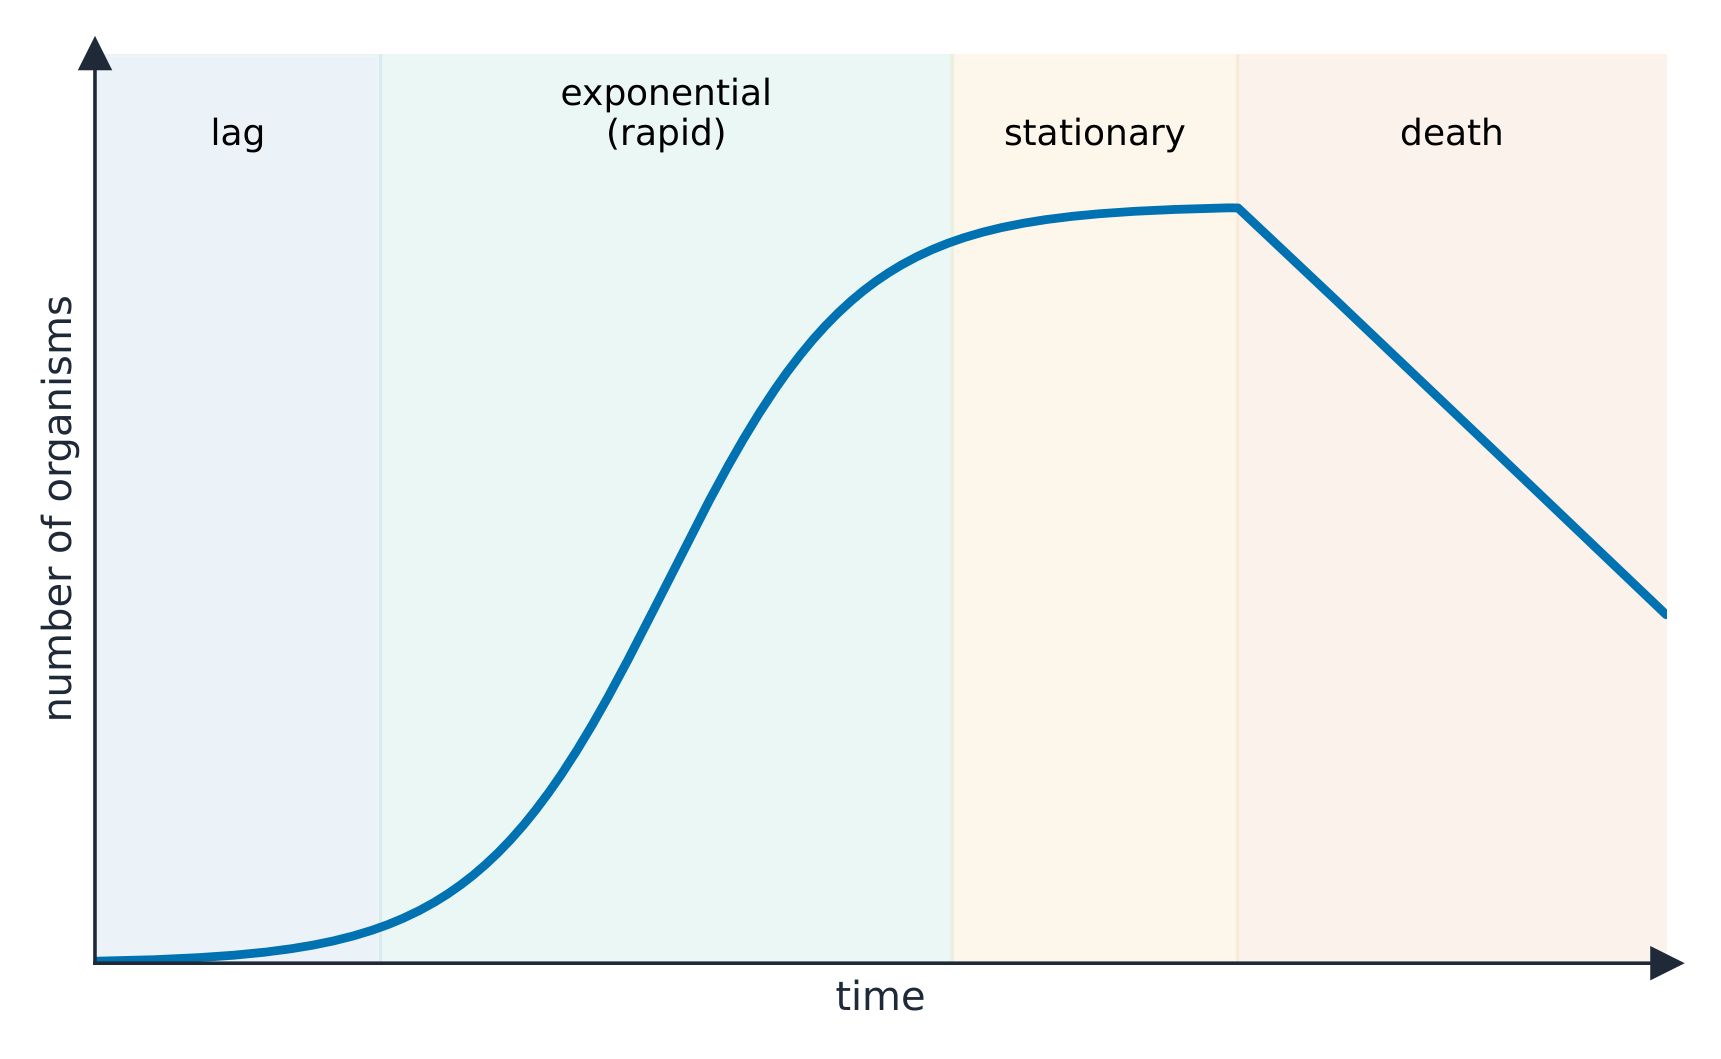
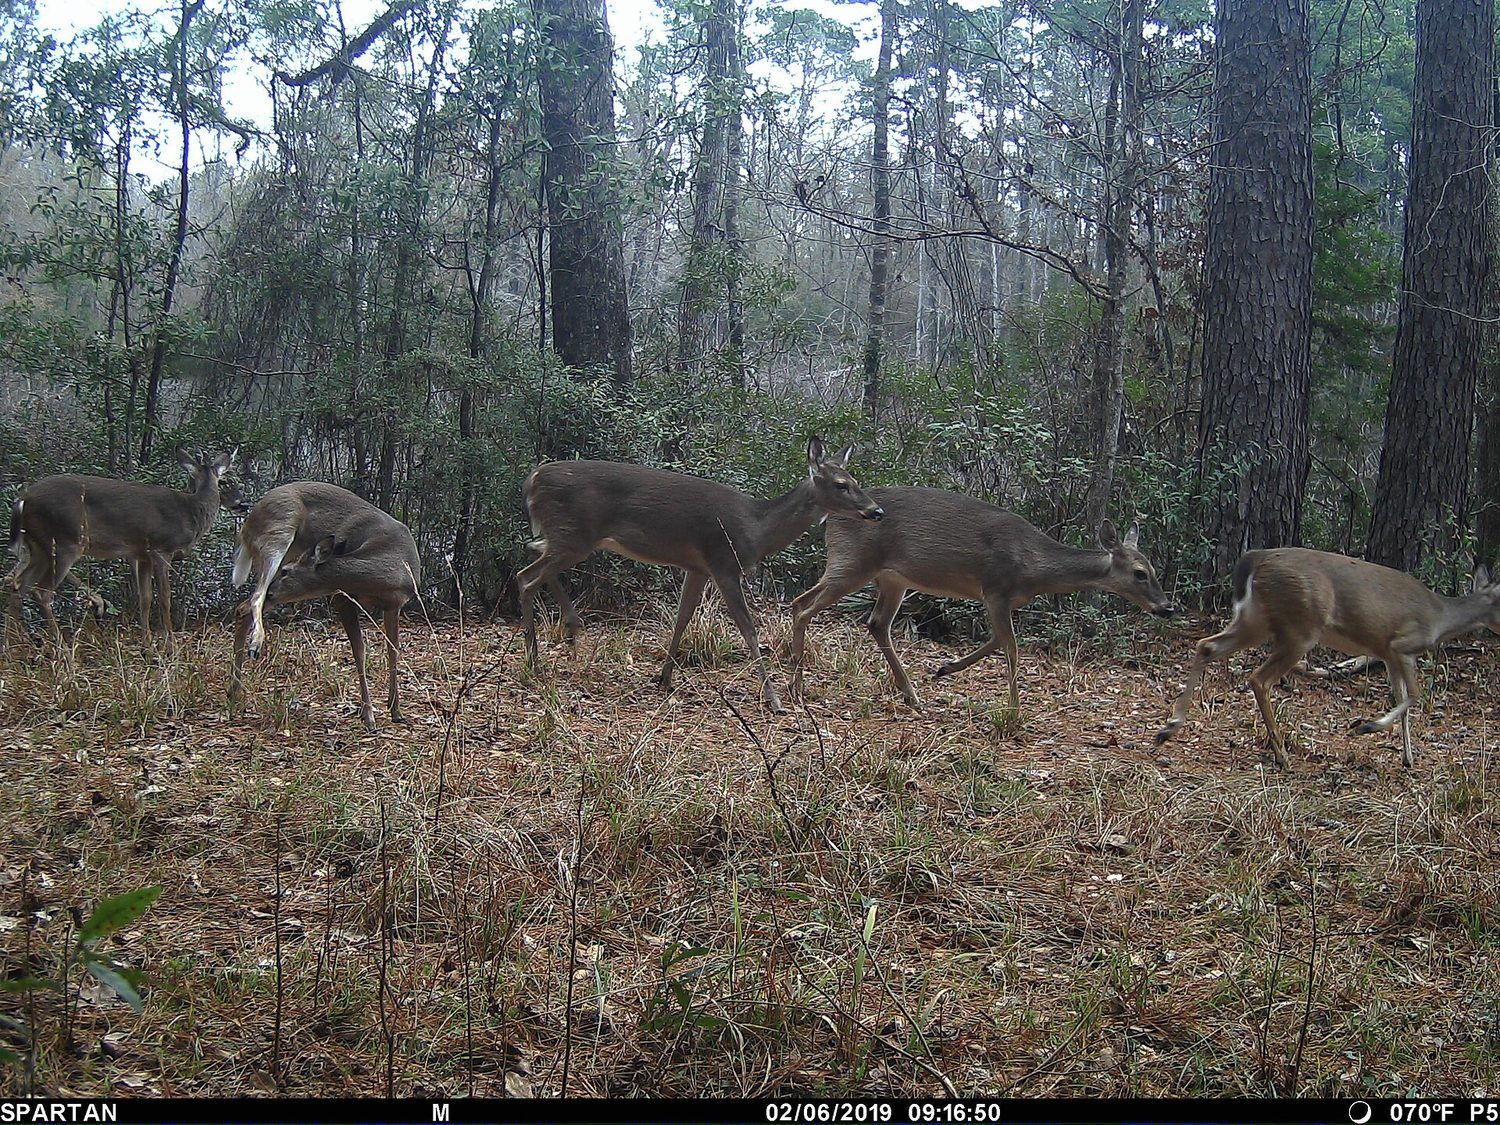
The carrying capacity 环境容纳量 ($K$) is the maximum population an environment can support long-term. A population may overshoot $K$ when resources are temporarily plentiful, then crash (dieback) as resources run out. Populations tend to fluctuate around $K$.
Explore
Growth up to carrying capacity
A population grows toward the carrying capacity $K$ its resources can support, then levels off. Push the growth rate up and watch it overshoot and settle.
Vocabulary
Train
| English |
|---|
| carrying capacity/ˈkæriɪŋ kəˈpæsɪti/ |
3.5
Population Growth and Resource Availability
Syllabus
| Enduring Understanding | Learning Objective | Essential Knowledge |
|---|---|---|
ERT-3 | ERT-3.F |
|
Source: College Board AP Course and Exam Description
With abundant resources a population grows exponentially 指数增长 ($J$-curve). As resources become limited, growth slows to logistic 逻辑斯蒂增长 ($S$-curve), leveling at $K$. Limiting factors 限制因素 (food, water, space, disease) set the ceiling.
Vocabulary
Train
| English |
|---|
| exponentially/ˌekspəˈnenʃəli/ |
| logistic/ləˈdʒɪstɪk/ |
| Limiting factors/ˈlɪmɪtɪŋ ˈfæktəz/ |
3.6
Age Structure Diagrams
Syllabus
| Enduring Understanding | Learning Objective | Essential Knowledge |
|---|---|---|
EIN-1 | EIN-1.A |
|
Source: College Board AP Course and Exam Description
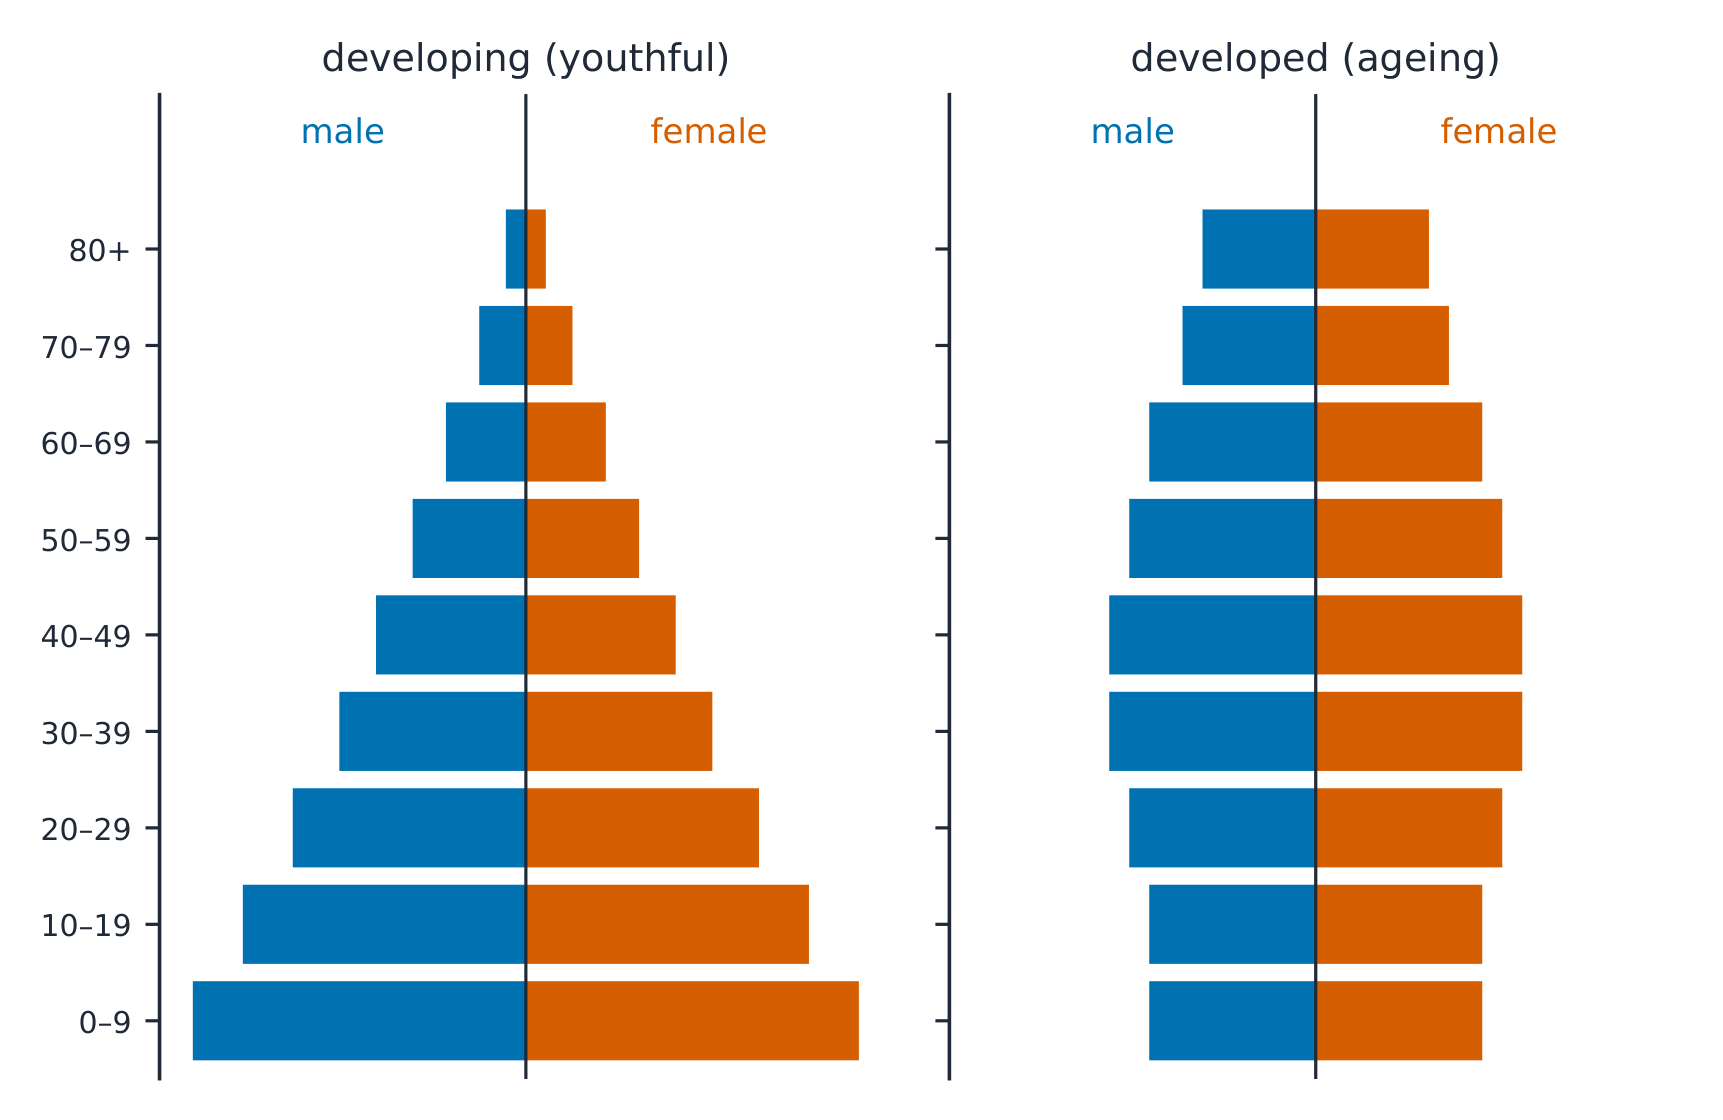
An age-structure diagram 年龄结构图 shows the proportion of a population in each age group. A wide base (many young) predicts rapid growth; even bars predict a stable population; a narrow base predicts decline. They forecast a country's future population.
Vocabulary
Train
| English |
|---|
| age-structure diagram/eɪdʒ ˈstrʌktʃə ˈdaɪəɡræm/ |
3.7
Total Fertility Rate
Syllabus
| Enduring Understanding | Learning Objective | Essential Knowledge |
|---|---|---|
EIN-1 | EIN-1.B |
|
Source: College Board AP Course and Exam Description
The total fertility rate 总生育率 (TFR) is the average number of children per woman. A replacement level of about 2.1 keeps a population steady; above it grows, below it shrinks. TFR falls with education, access to family planning, and lower infant mortality.
Vocabulary
Train
| English |
|---|
| total fertility rate/ˈtəʊtl fɜːˈtɪlɪti reɪt/ |
3.8
Human Population Dynamics

Syllabus
| Enduring Understanding | Learning Objective | Essential Knowledge |
|---|---|---|
EIN-1 | EIN-1.C.1 |
|
Source: College Board AP Course and Exam Description
Human population growth depends on birth rate, death rate, and migration. Rapid growth strains resources and increases the ecological footprint 生态足迹. Factors lowering birth rates include education (especially of women), urbanization, and economic development.
Worked example. A country has a birth rate of $30$ per $1000$ and a death rate of $10$ per $1000$. The natural growth rate is $\dfrac{30-10}{10}=2.0\%$ per year (dividing the per-thousand difference by $10$ converts it to a percent). By the rule of 70, the population doubles in about $\dfrac{70}{2.0}=35$ years. If development cut the growth rate to $1.0\%$, the doubling time would stretch to $\dfrac{70}{1.0}=70$ years.
Vocabulary
Train
| English |
|---|
| ecological footprint/ˌekəˈlɒdʒɪkl ˈfʊtprɪnt/ |
3.9
Demographic Transition
Syllabus
| Enduring Understanding | Learning Objective | Essential Knowledge |
|---|---|---|
EIN-1 | EIN-1.D |
|
Source: College Board AP Course and Exam Description
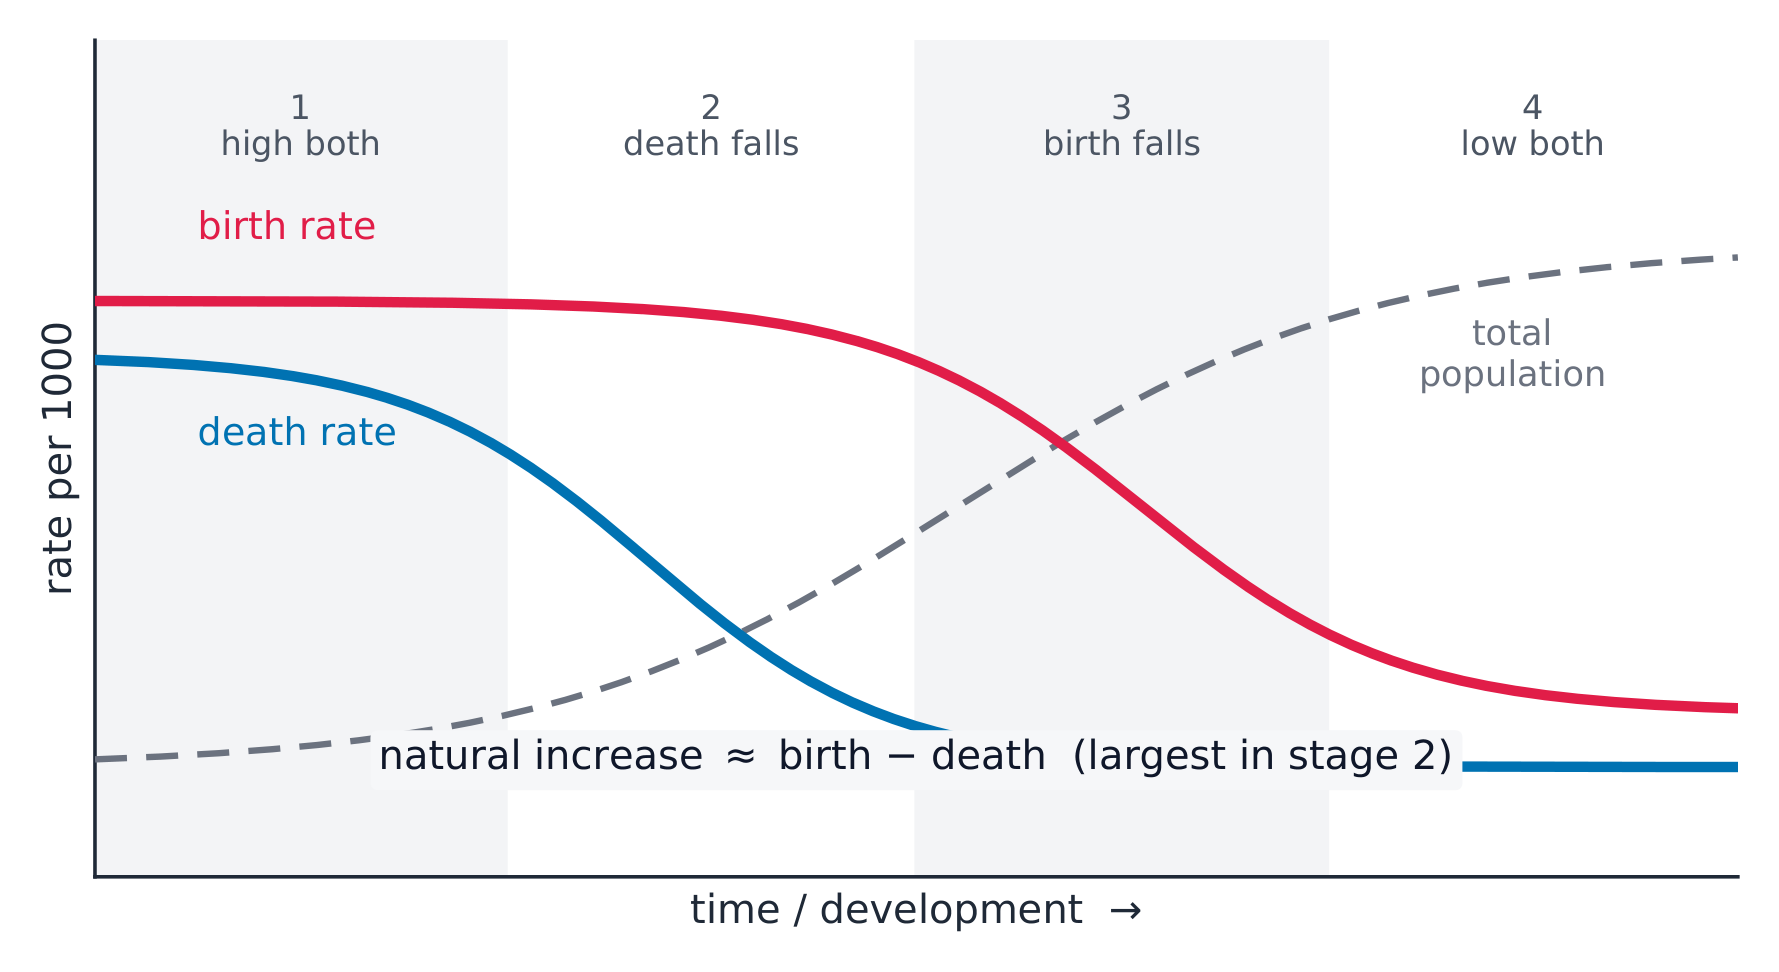
The demographic transition 人口转型 describes how a country's growth changes as it develops, in stages: (1) high birth and death rates (slow growth); (2) death rate falls (rapid growth); (3) birth rate falls (slowing growth); (4) both low (stable). Developed nations are in later stages; many developing nations are in the rapid-growth stages.
The population grows fastest in stages 2 and 3 – the gap between a still-high birth rate and an already-fallen death rate. That lag is why a country's population keeps climbing long after its death rate drops.
Vocabulary
Train
| English |
|---|
| demographic transition/ˌdeməˈɡræfɪk trænˈsɪʃn/ |
3.9
Exam tips
- Use the rule of 70: doubling time ≈ 70 ÷ growth-rate(%); a growth rate is (births − deaths) per 1000 ÷ 10.
- Read age-structure diagrams: a wide base predicts rapid growth, even bars a stable population.
- Contrast r-selected (many offspring, little care) and K-selected (few, much care) strategies.
- Know the demographic transition stages and what lowers birth rates (education, family planning, development).
- A falling growth rate still means growth — the population only shrinks when deaths exceed births.
Interactive lessons on this topic
Work through it step by step, with instant-check exercises.